
9.5 KiB
Name
多重均线超级趋势结合布林带突破交易策略-Multi-Moving-Average-Supertrend-with-Bollinger-Breakout-Trading-Strategy
Author
ChaoZhang
Strategy Description
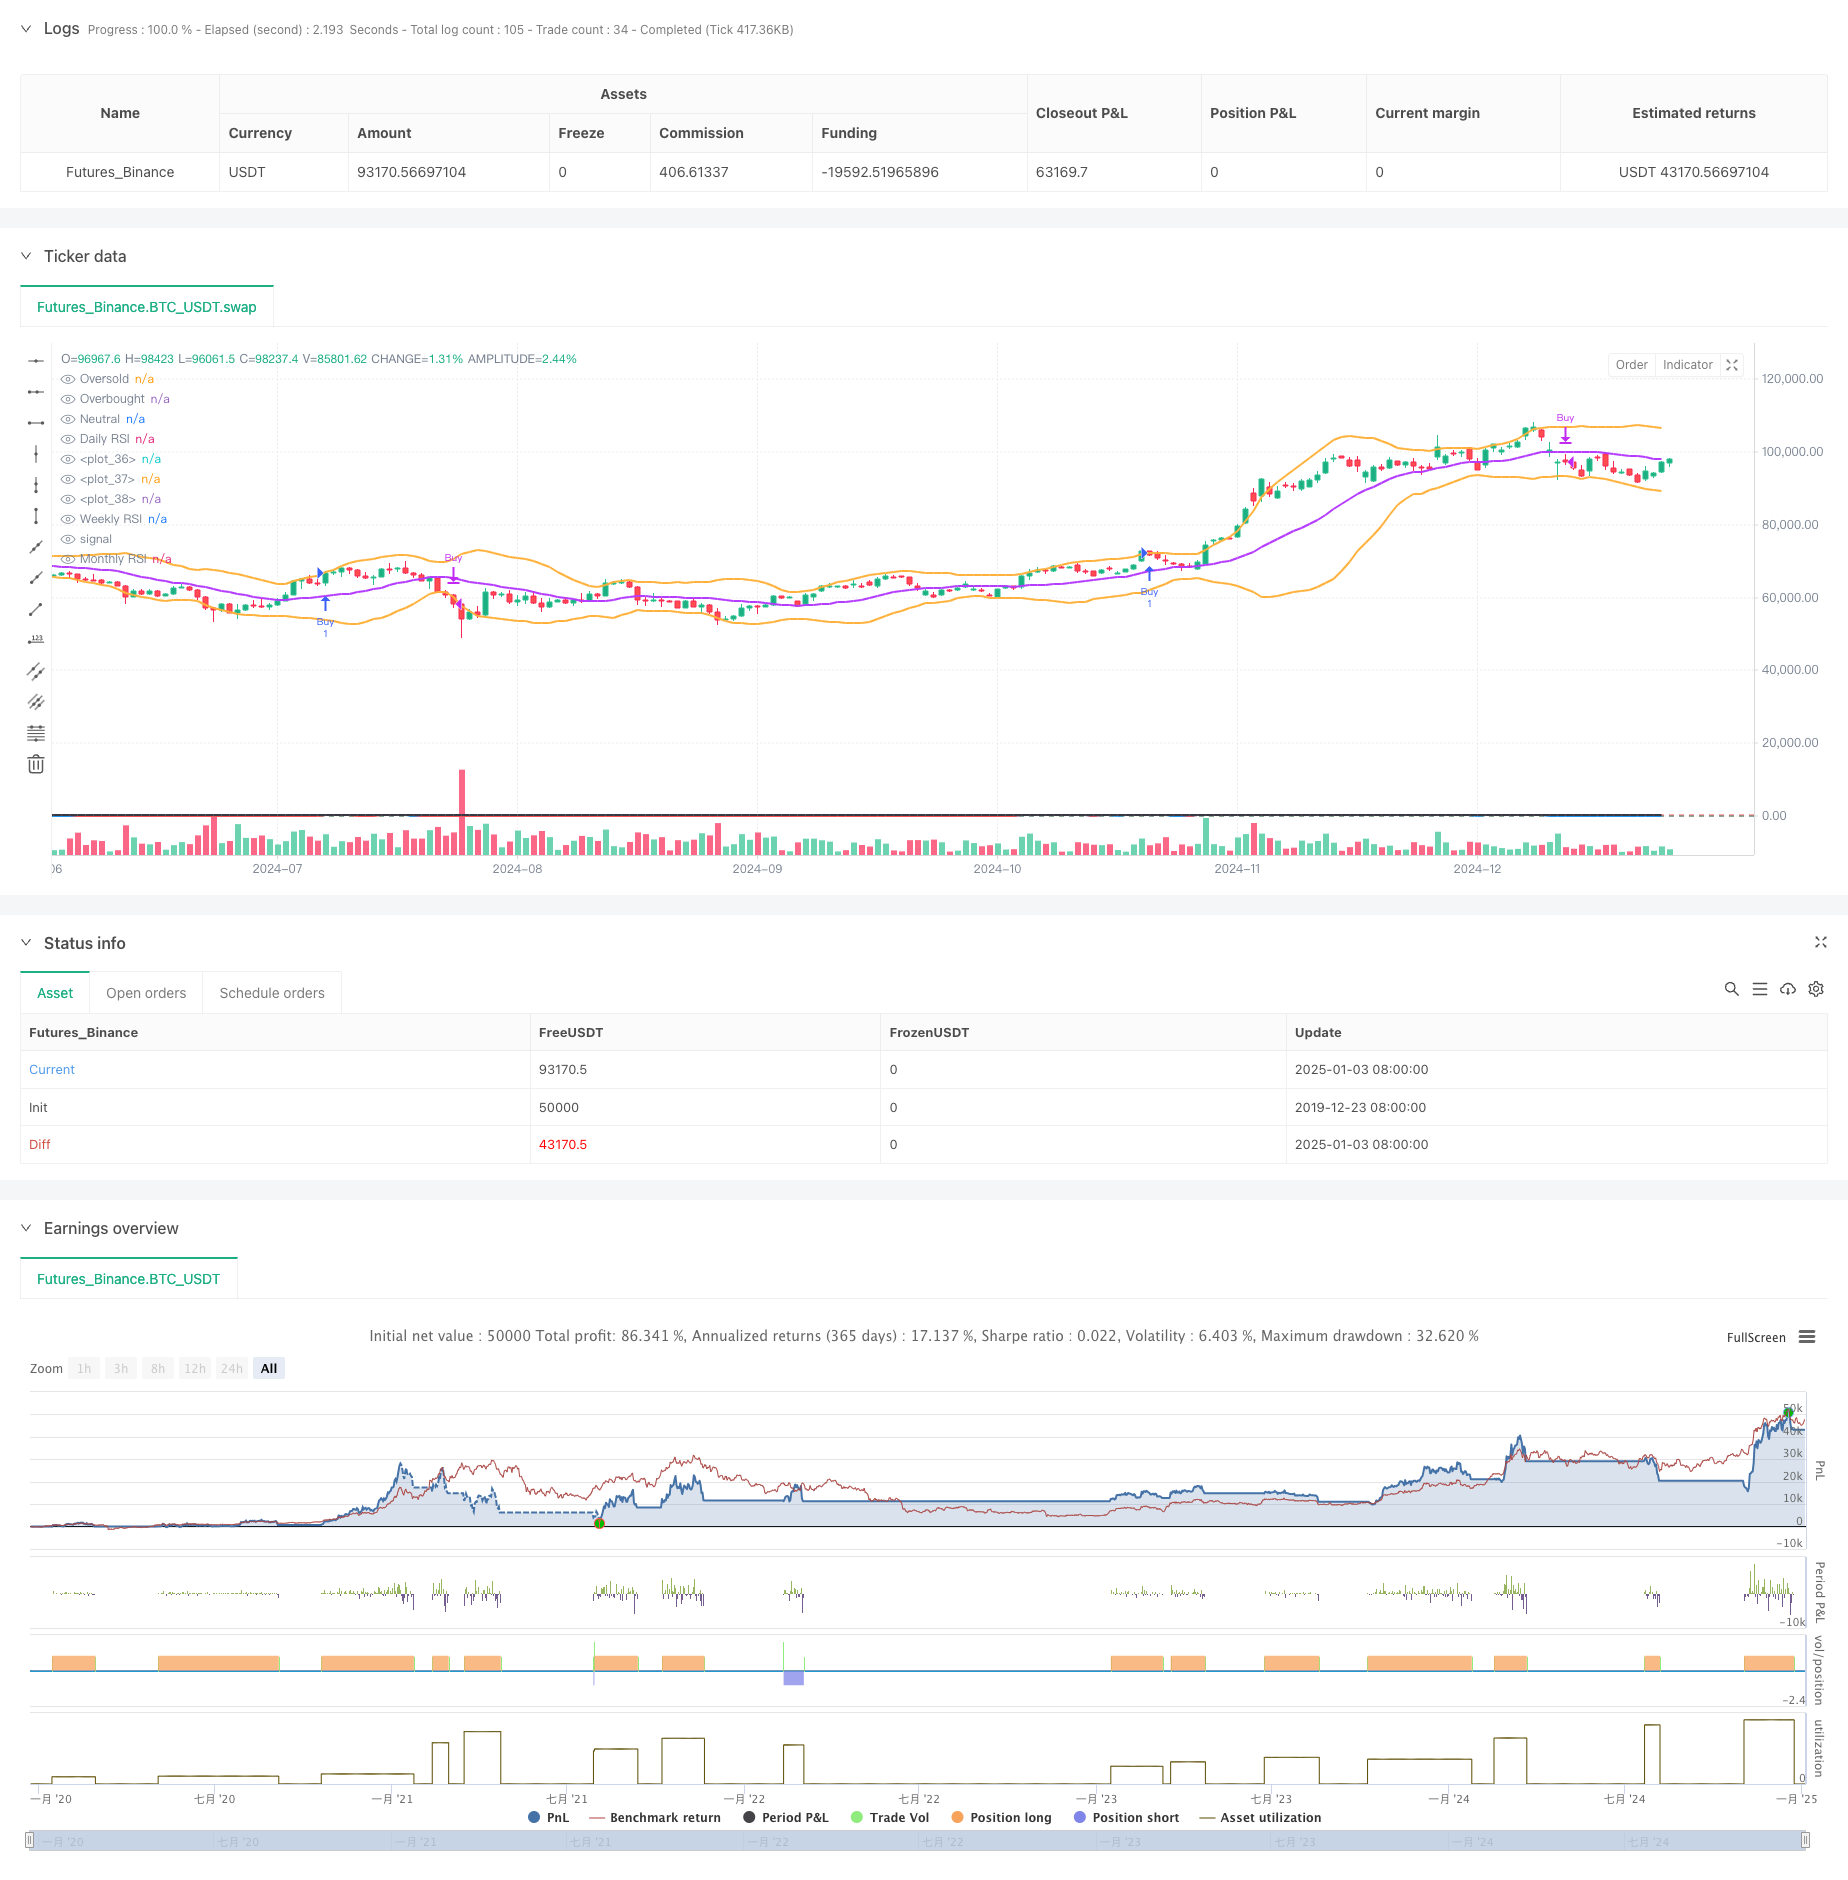
[trans]
概述
该策略是一个结合了多重指标的复合型交易系统,主要基于指数移动平均线(EMA)、超级趋势指标(Supertrend)、布林带(Bollinger Bands)和相对强弱指标(RSI)的综合分析。策略核心逻辑围绕EMA和Supertrend构建交易信号,同时结合布林带和RSI提供市场波动性和动量的辅助判断。交易系统采用多周期RSI分析法,包含日线、周线和月线周期,为交易决策提供更全面的市场视角。
策略原理
策略运用了多层技术指标组合来捕捉市场趋势和波动机会:
- 使用三重EMA(13,34,100)建立趋势跟踪系统,通过均线交叉和位置关系判断趋势方向
- 整合Supertrend指标作为趋势确认和止损参考
- 利用ADX指标筛选强趋势行情,设定25作为趋势强度临界值
- 采用布林带(20,2)监测价格波动区间
- 运用三周期RSI(14)分析市场超买超卖状态
交易信号的触发条件:
- 多头入场:Supertrend转多 + EMA13上穿EMA34 + 价格站上EMA100 + ADX>25
- 空头入场:Supertrend转多 + EMA13下穿EMA34 + 价格跌破EMA100 + ADX>25
- 平仓信号:价格与Supertrend交叉时退出相应方向的持仓
策略优势
- 多重技术指标的整合提供了更可靠的交易信号,有效降低虚假信号
- 三重EMA系统能够全面把握不同周期的趋势特征
- ADX指标的引入确保只在强趋势市场中交易
- 多周期RSI分析提供了更全面的市场动能评估
- Supertrend指标提供了客观的止损位置参考
- 布林带的整合帮助判断市场波动状态和潜在的突破机会
策略风险
- 多重指标系统可能导致信号滞后,影响入场时机
- 在震荡市场中可能产生频繁的假突破信号
- 固定的ADX阈值可能在不同市场环境下表现不一致
- 快速剧烈的市场波动可能导致止损位置不合理 风险控制建议:
- 根据不同市场特征动态调整ADX阈值
- 引入波动率自适应的止损机制
- 增加交易量分析作为信号确认
策略优化方向
- 指标参数优化
- 考虑引入自适应型EMA周期
- 根据波动率动态调整Supertrend系数
- 优化布林带参数以适应不同市场阶段
- 信号系统增强
- 整合成交量因素验证交易信号
- 添加市场结构分析
- 引入波动率过滤器
- 风险管理完善
- 设计动态止损机制
- 建立仓位管理系统
- 增加交易时间过滤器
总结
该策略通过多重技术指标的有机结合,构建了一个相对完整的交易系统。EMA和Supertrend的配合提供主要交易信号,ADX的筛选确保交易发生在强趋势环境,布林带和RSI的辅助分析提供了额外的市场视角。策略的主要优势在于信号的可靠性和系统的完整性,但同时也面临信号滞后和参数优化的挑战。通过提出的优化方向,策略有望在保持稳定性的同时提升盈利能力。 ||
Overview
This strategy is a comprehensive trading system that combines multiple indicators, primarily based on Exponential Moving Averages (EMA), Supertrend indicator, Bollinger Bands (BB), and Relative Strength Index (RSI). The core logic builds trading signals around EMA and Supertrend, while incorporating BB and RSI for supplementary analysis of market volatility and momentum. The system employs multi-timeframe RSI analysis, including daily, weekly, and monthly periods, providing a more comprehensive market perspective for trading decisions.
Strategy Principles
The strategy utilizes a multi-layer technical indicator combination to capture market trends and volatility opportunities:
- Uses triple EMA (13,34,100) to establish a trend-following system, determining trend direction through crossovers and relative positions
- Integrates Supertrend indicator for trend confirmation and stop-loss reference
- Employs ADX indicator to filter strong trends, setting 25 as the trend strength threshold
- Utilizes Bollinger Bands (20,2) to monitor price volatility range
- Implements triple-timeframe RSI (14) to analyze market overbought/oversold conditions
Trading signal triggers:
- Long Entry: Supertrend turns bullish + EMA13 crosses above EMA34 + price above EMA100 + ADX>25
- Short Entry: Supertrend turns bullish + EMA13 crosses below EMA34 + price below EMA100 + ADX>25
- Exit Signals: Price crosses Supertrend for respective position exits
Strategy Advantages
- Integration of multiple technical indicators provides more reliable trading signals, effectively reducing false signals
- Triple EMA system captures trend characteristics across different timeframes
- ADX incorporation ensures trading only in strong trend markets
- Multi-timeframe RSI analysis offers comprehensive market momentum assessment
- Supertrend indicator provides objective stop-loss reference points
- Bollinger Bands integration aids in determining market volatility states and potential breakout opportunities
Strategy Risks
- Multiple indicator system may lead to lagging signals, affecting entry timing
- May generate frequent false breakout signals in ranging markets
- Fixed ADX threshold may perform inconsistently across different market environments
- Rapid market volatility may result in suboptimal stop-loss placement Risk control suggestions:
- Dynamically adjust ADX threshold based on market characteristics
- Introduce volatility-adaptive stop-loss mechanism
- Add volume analysis for signal confirmation
Strategy Optimization Directions
- Indicator Parameter Optimization
- Consider introducing adaptive EMA periods
- Dynamically adjust Supertrend multiplier based on volatility
- Optimize Bollinger Bands parameters for different market phases
- Signal System Enhancement
- Integrate volume factors for trade signal verification
- Add market structure analysis
- Implement volatility filters
- Risk Management Improvement
- Design dynamic stop-loss mechanism
- Establish position sizing system
- Add trading time filters
Summary
This strategy constructs a relatively complete trading system through the organic combination of multiple technical indicators. EMA and Supertrend cooperation provides primary trading signals, ADX filtering ensures trading occurs in strong trend environments, while Bollinger Bands and RSI auxiliary analysis provides additional market perspectives. The strategy's main advantages lie in signal reliability and system completeness, but it also faces challenges in signal lag and parameter optimization. Through the proposed optimization directions, the strategy has the potential to enhance profitability while maintaining stability.[/trans]
Source (PineScript)
/*backtest
start: 2019-12-23 08:00:00
end: 2025-01-04 08:00:00
period: 1d
basePeriod: 1d
exchanges: [{"eid":"Futures_Binance","currency":"BTC_USDT"}]
*/

//made by Chinmay

//@version=6
strategy("CJ - Multi1", overlay=true)

// Input for RSI length
rsi_length = input.int(14, title="RSI Length")

// Calculate Daily RSI
daily_rsi = ta.rsi(close, rsi_length)

// Calculate Weekly RSI (using security function to get weekly data)
weekly_rsi = request.security(syminfo.tickerid, "W", ta.rsi(close, rsi_length))

// Calculate Monthly RSI (using security function to get weekly data)
monthly_rsi = request.security(syminfo.tickerid, "M", ta.rsi(close, rsi_length))

// Plot the RSIs
plot(daily_rsi, color=color.blue, title="Daily RSI", linewidth=2)
plot(weekly_rsi, color=color.red, title="Weekly RSI", linewidth=2)
plot(monthly_rsi, color=color.black, title="Monthly RSI", linewidth=2)

// Create horizontal lines at 30, 50, and 70 for RSI reference
hline(30, "Oversold", color=color.green)
hline(70, "Overbought", color=color.red)
hline(50, "Neutral", color=color.gray)

// Bollinger Bands Calculation
bb_length = 20
bb_mult = 2
bb_stddev = ta.stdev(close, bb_length)
bb_average = ta.sma(close, bb_length)
bb_upper = bb_average + bb_mult * bb_stddev
bb_lower = bb_average - bb_mult * bb_stddev

plot(bb_upper, color=color.new(#ffb13b, 0), linewidth=2)
plot(bb_average, color=color.new(#b43bff, 0), linewidth=2)
plot(bb_lower, color=color.new(#ffb13b, 0), linewidth=2)

// Inputs for EMA
ema_L1 = input.int(defval=13, title="EMA Length 1")
ema_L2 = input.int(defval=34, title="EMA Length 2")
ema_L3 = input.int(defval=100, title="EMA Length 3")
adx_level = input.int(defval=25, title="ADX Level")

// Inputs for Supertrend
atr_l = input.int(defval=10, title="ATR Length")
factor = input.float(defval=3.0, title="Supertrend Multiplier")

// Calculate EMA
ema1 = ta.ema(close, ema_L1)
ema2 = ta.ema(close, ema_L2)
ema3 = ta.ema(close, ema_L3)

// Calculate Supertrend
[supertrend, direction] = ta.supertrend(factor, atr_l)

// Calculate ADX and DI
[diplus, diminus, adx] = ta.dmi(14,14)

// Buy and Sell Conditions
buy = direction == -1 and ema1 > ema2 and close > ta.ema(close, 100) and adx > adx_level
short = direction == -1 and ema1 < ema2 and close < ta.ema(close, 100) and adx > adx_level

sell = ta.crossunder(close, supertrend)
cover = ta.crossover(close, supertrend)

// Strategy Logic
if buy
    strategy.entry("Buy", strategy.long, comment="Long Entry")

if sell
    strategy.close("Buy", comment="Sell Exit")

// Uncomment for Short Strategy
if short
    strategy.entry("Short", strategy.short, comment="Short Entry")

if cover
    strategy.close("Short", comment="Cover Exit")
Detail
https://www.fmz.com/strategy/477553
Last Modified
2025-01-06 13:48:19