
6.3 KiB
Name
多重均线突破策略Multi-Moving-Average-Breakout-Strategy
Author
ChaoZhang
Strategy Description
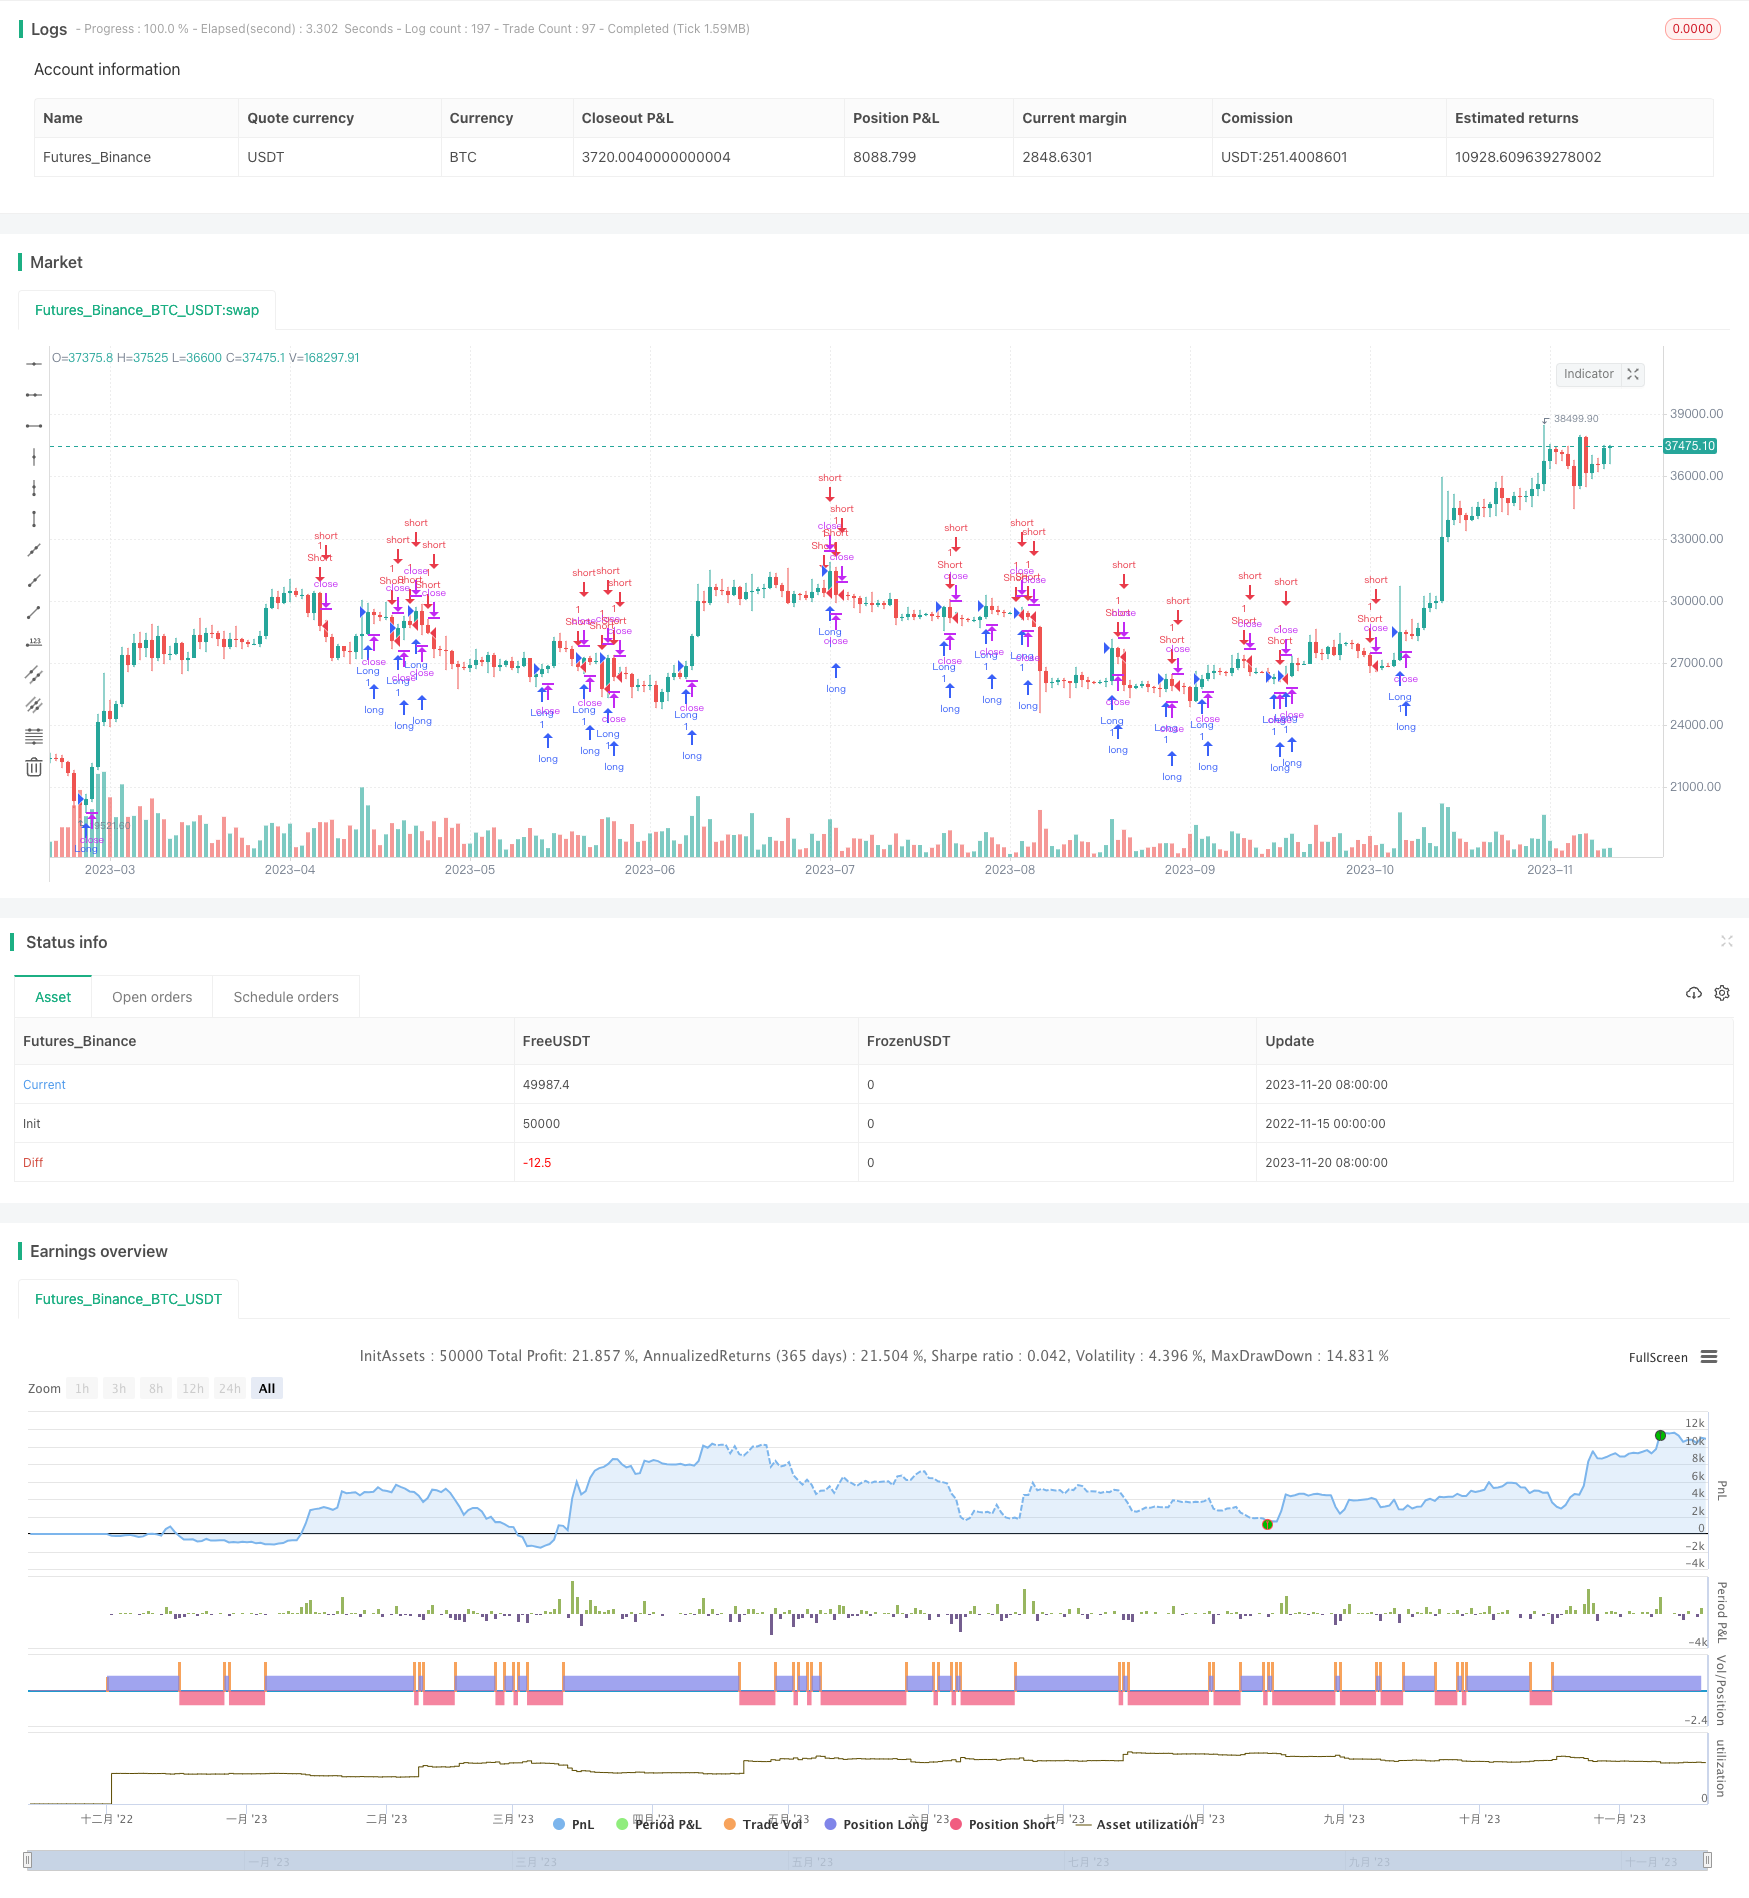
[trans]
概述
该策略利用多重移动平均线的突破和回破来产生交易信号。当价格突破上行的均线时,做多;当价格跌破下行的均线时,做空。
策略原理
代码中使用了4条不同周期的移动平均线——21日线、50日线、100日线和200日线。当价格突破这些均线时就入场做多,当价格跌破这些均线时就入场做空。此外,策略还设置了止损位和止盈位。具体来说,止损位设置为前一根K线的最低价附近,止盈位则设置为前一根K线最低价到最高价的3倍距离。
该策略的核心思想是利用移动平均线来判断价格趋势。当价格突破上行均线时,说明目前处于上升趋势,应该做多;当价格跌破下行均线时,说明目前处于下跌趋势,应该做空。使用多条不同周期的均线,可以更加准确地判断趋势,同时也可以通过趋势的一致性来验证交易信号。
优势分析
该策略优势主要有:
- 使用多重均线判断,可以有效过滤假信号
- 设置止损止盈策略,可以限制单笔损失
- 操作简单,容易实施
风险分析
该策略主要风险有:
- 移动平均线策略容易产生错位,从而错过价格反转点
- 突破假信号可能造成损失
- 止损止盈设置不当可能扩大损失
可以通过调整均线参数、优化止损止盈策略来降低这些风险。
优化方向
该策略可以从以下几个方面进行优化:
- 测试更多周期的均线组合,寻找最佳参数
- 加入其他指标判断,避免假突破
- 优化止损止盈策略,实现更好的风险收益比
- 在不同市场条件下调整参数,使策略更具鲁棒性
总结
该策略整体来说是一个典型的趋势跟踪策略。优点是思路清晰,易于理解和实现;缺点是容易产生误信号。通过参数优化和加入其他指标可以使策略效果更好。该策略适合中长线持仓,也可以作为短线交易策略的组成部分。
||
Overview
This strategy generates trading signals based on the breakthrough and callback of multiple moving average lines. It goes long when the price breaks through the upward moving average line and goes short when the price falls below the downward moving average line.
Strategy Logic
The code uses 4 moving average lines with different periods - 21-day, 50-day, 100-day and 200-day. It enters long positions when the price breaks through these MA lines and enters short positions when the price falls below these MA lines. In addition, stop loss and take profit levels are set in the strategy. Specifically, the stop loss is set near the lowest point of the previous candle, and the take profit is set at 3 times the distance between the lowest point and the highest point of the previous candle.
The core idea of this strategy is to judge the trend using moving averages. When the price breaks through the upward MA lines, it indicates an upward trend so should go long. When the price falls below the downward MA lines, it indicates a downward trend so should go short. Using multiple MA lines with different periods can judge the trend more accurately and also verify trading signals through consistency of the trend.
Advantage Analysis
The main advantages of this strategy are:
- Using multiple MAs can effectively filter false signals
- Setting stop loss and take profit can limit single loss
- Simple to implement
Risk Analysis
The main risks of this strategy are:
- MA strategies are prone to misalignment, thus missing price reversal points
- Breakthrough false signals may cause losses
- Improper stop loss and take profit settings may amplify losses
These risks can be reduced by adjusting MA parameters and optimizing stop loss and take profit.
Optimization
This strategy can be optimized in the following aspects:
- Test more MA combinations to find optimal parameters
- Add other indicators to avoid false breakouts
- Optimize stop loss and take profit for better risk-reward ratio
- Adjust parameters for different market conditions to make the strategy more robust
Summary
In general, this is a typical trend following strategy. The advantages are clear logic and easy to understand and implement. The disadvantage is prone to false signals. The strategy can be improved by parameter tuning and adding other indicators. It is suitable for medium-to-long term holding and can also be used as a component of short-term trading strategies.
[/trans]
Source (PineScript)
/*backtest
start: 2022-11-15 00:00:00
end: 2023-11-21 00:00:00
period: 1d
basePeriod: 1h
exchanges: [{"eid":"Futures_Binance","currency":"BTC_USDT"}]
*/

//@version=5
strategy("DolarBasar by AlperDursun", shorttitle="DOLARBASAR", overlay=true)

// Input for Moving Averages
ma21 = ta.sma(close, 21)
ma50 = ta.sma(close, 50)
ma100 = ta.sma(close, 100)
ma200 = ta.sma(close, 200)

// Calculate the lowest point of the previous candle for stop loss
lowestLow = ta.lowest(low, 2)

// Calculate the highest point of the previous candle for stop loss
highestHigh = ta.highest(high, 2)

// Calculate take profit levels
takeProfitLong = lowestLow - 3 * (lowestLow - highestHigh)
takeProfitShort = highestHigh + 3 * (lowestLow - highestHigh)

// Entry Conditions
longCondition = ta.crossover(close, ma21) or ta.crossover(close, ma50) or ta.crossover(close, ma100) or ta.crossover(close, ma200)
shortCondition = ta.crossunder(close, ma21) or ta.crossunder(close, ma50) or ta.crossunder(close, ma100) or ta.crossunder(close, ma200)

// Stop Loss Levels
stopLossLong = lowestLow * 0.995
stopLossShort = highestHigh * 1.005

// Exit Conditions
longExitCondition = low < stopLossLong or high > takeProfitLong
shortExitCondition = high > stopLossShort or low < takeProfitShort

if (longCondition)
    strategy.entry("Long", strategy.long)

if (shortCondition)
    strategy.entry("Short", strategy.short)

if (longExitCondition)
    strategy.exit("Long Exit", from_entry="Long", stop=stopLossLong, limit=takeProfitLong)

if (shortExitCondition)
    strategy.exit("Short Exit", from_entry="Short", stop=stopLossShort, limit=takeProfitShort)
Detail
https://www.fmz.com/strategy/432874
Last Modified
2023-11-22 13:41:38