
11 KiB
Name
多重均线成交量净值震荡趋势转换交易策略-Multi-Moving-Average-Net-Volume-Oscillator-Trend-Reversal-Trading-Strategy
Author
ianzeng123
Strategy Description
[trans]
概述
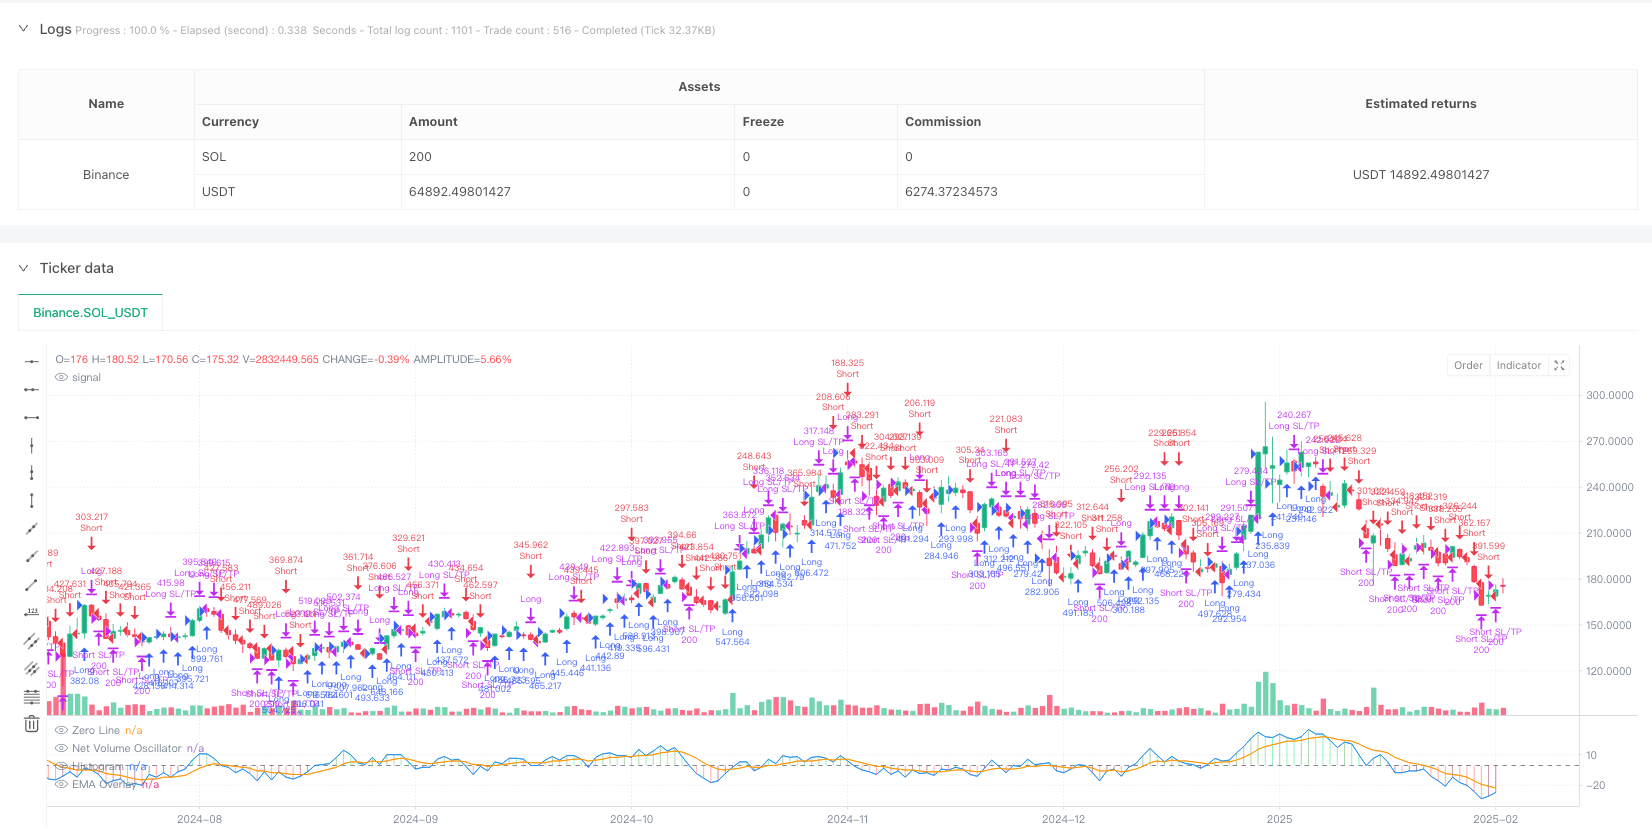
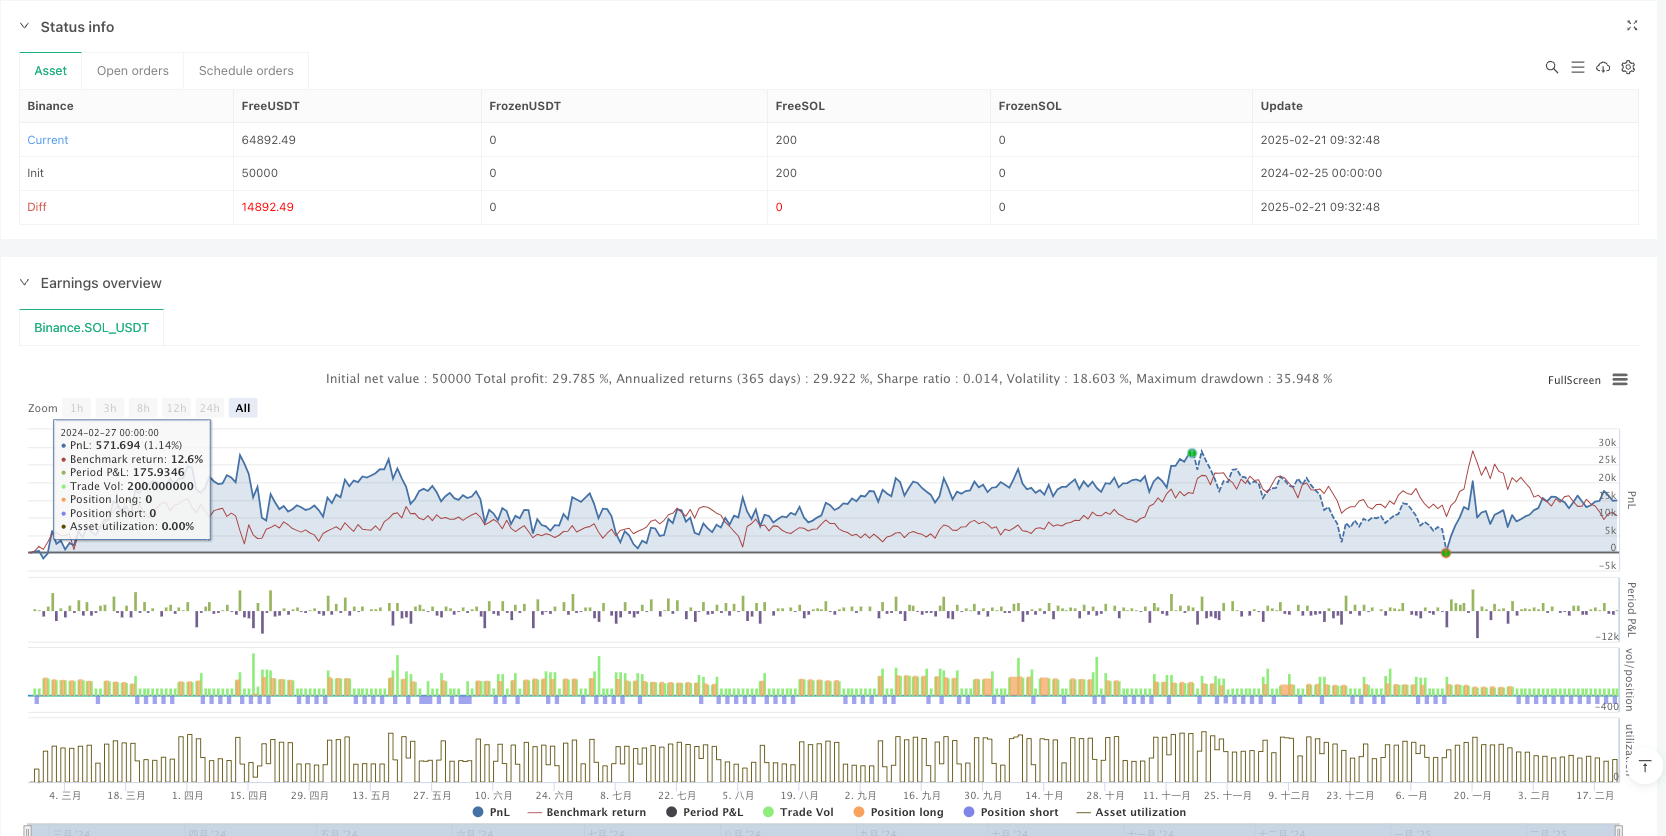
本策略是一个基于成交量和价格变动的趋势跟踪系统,通过计算净成交量震荡指标(NVO)来预测市场走向。策略结合了多种移动平均线类型(EMA、WMA、SMA、HMA),通过对比震荡指标与其EMA叠加线的位置关系来判断市场趋势,并在合适的时机进行交易。该策略还包含了止损和止盈机制,以控制风险和锁定利润。
策略原理
策略的核心是通过计算每日的净成交量震荡值来判断市场情绪。具体计算步骤如下:
- 计算价格区间乘数:基于当日最高价、最低价和收盘价计算一个介于0-1之间的乘数
- 计算有效上涨和下跌成交量:根据价格变动方向和乘数对成交量进行加权
- 计算净成交量:将有效上涨成交量减去有效下跌成交量
- 应用选定的移动平均线:对净成交量数据进行平滑处理
- 计算EMA叠加线:作为趋势判断的参考线
- 计算变化率(ROC):用于判断趋势强度变化
交易信号的产生基于以下规则:
- 做多条件:震荡指标上穿EMA叠加线
- 做空条件:震荡指标下穿EMA叠加线
- 止损:基于百分比的价格止损
- 止盈:基于百分比的价格止盈
策略优势
- 多维度分析:结合了价格、成交量和趋势变化率三个维度的市场信息
- 灵活性高:支持多种移动平均线类型,可根据不同市场特征进行调整
- 风险管理完善:包含止损止盈机制,能有效控制风险
- 可视化效果强:通过直方图显示趋势强度变化,便于理解市场状态
- 适应性强:通过参数化设计,可以适应不同的市场环境和交易品种
策略风险
- 趋势反转风险:在震荡市场中可能产生频繁的假信号
- 滞后性风险:移动平均线本身具有一定的滞后性,可能导致入场和出场时机不够理想
- 参数敏感性:不同参数组合可能导致策略表现差异较大
- 市场环境依赖:在某些市场环境下可能表现不佳
- 技术局限性:仅依赖技术指标,未考虑基本面因素
风险控制建议:
- 建议在不同市场环境下进行参数优化
- 可以结合其他技术指标进行信号确认
- 适当调整止损止盈参数以适应不同的市场波动性
策略优化方向
-
信号确认机制优化:
- 增加成交量确认条件
- 添加趋势强度过滤器
- 引入波动率自适应机制
-
风险管理优化:
- 实现动态止损机制
- 添加资金管理模块
- 引入分批建仓和减仓机制
-
参数优化:
- 开发自适应参数调整机制
- 实现基于市场环境的参数切换
- 添加机器学习模型进行参数优化
总结
该策略通过综合分析成交量和价格数据,构建了一个较为完整的趋势跟踪交易系统。策略的主要特点是结合了多种技术指标,并提供了灵活的参数配置选项。虽然存在一定的风险,但通过合理的风险控制和持续优化,该策略有望在实际交易中取得稳定的收益。建议交易者在实盘使用前进行充分的回测,并根据具体市场情况适当调整参数。
||
Overview
This strategy is a trend-following system based on volume and price movements, using the Net Volume Oscillator (NVO) to predict market direction. It combines multiple types of moving averages (EMA, WMA, SMA, HMA) and generates trading signals by comparing the oscillator's position relative to its EMA overlay. The strategy includes stop-loss and take-profit mechanisms for risk management.
Strategy Principles
The core mechanism calculates daily net volume oscillator values to gauge market sentiment. The calculation process includes:
- Price range multiplier calculation: Based on daily high, low, and closing prices
- Effective up/down volume calculation: Volume weighted by price movement direction and multiplier
- Net volume calculation: Effective up volume minus effective down volume
- Application of selected moving average: Smoothing the net volume data
- EMA overlay calculation: Reference line for trend determination
- Rate of Change (ROC) calculation: For trend strength analysis
Trading signals are generated based on:
- Long entry: Oscillator crosses above EMA overlay
- Short entry: Oscillator crosses below EMA overlay
- Stop-loss: Percentage-based price stops
- Take-profit: Percentage-based profit targets
Strategy Advantages
- Multi-dimensional analysis: Combines price, volume, and trend rate of change
- High flexibility: Supports multiple moving average types for different market characteristics
- Comprehensive risk management: Includes stop-loss and take-profit mechanisms
- Strong visualization: Histogram display of trend strength changes
- High adaptability: Parameterized design for different market conditions
Strategy Risks
- Trend reversal risk: May generate false signals in choppy markets
- Lag risk: Moving averages have inherent lag, potentially affecting entry/exit timing
- Parameter sensitivity: Different parameter combinations may lead to varying performance
- Market environment dependency: May underperform in certain market conditions
- Technical limitations: Relies solely on technical indicators, ignoring fundamentals
Risk control suggestions:
- Optimize parameters for different market environments
- Consider additional technical indicators for confirmation
- Adjust stop-loss and take-profit parameters based on market volatility
Strategy Optimization Directions
-
Signal confirmation optimization:
- Add volume confirmation conditions
- Implement trend strength filters
- Introduce volatility adaptation mechanisms
-
Risk management optimization:
- Develop dynamic stop-loss mechanisms
- Add position sizing module
- Implement scaled entry/exit mechanisms
-
Parameter optimization:
- Develop adaptive parameter adjustment mechanisms
- Implement market condition-based parameter switching
- Add machine learning models for parameter optimization
Summary
This strategy builds a comprehensive trend-following trading system through integrated analysis of volume and price data. Its main features include the combination of multiple technical indicators and flexible parameter configuration options. While certain risks exist, the strategy shows potential for stable returns through proper risk control and continuous optimization. Traders are advised to conduct thorough backtesting and adjust parameters according to specific market conditions before live trading.[/trans]
Source (PineScript)
/*backtest
start: 2024-02-25 00:00:00
end: 2025-02-22 08:00:00
period: 1d
basePeriod: 1d
exchanges: [{"eid":"Binance","currency":"SOL_USDT"}]
*/

//@version=5
strategy("EMA-Based Net Volume Oscillator with Trend Change", shorttitle="NVO Trend Change", overlay=false, initial_capital=100000, default_qty_type=strategy.percent_of_equity, default_qty_value=100)

// Input parameters
maType = input.string("WMA", "Moving Average Type", options=["WMA", "EMA", "SMA", "HMA"])
maLength = input.int(21, "MA Length", minval=1)
emaOverlayLength = input.int(9, "EMA Overlay Length", minval=1)
oscillatorMultiplier = input.float(1.0, "Oscillator Multiplier", minval=0.1, step=0.1)
showHistogram = input.bool(true, "Show Histogram")

stopLossPerc = input.float(1.0, "Stop Loss (%)", tooltip="Set 999 to disable")
takeProfitPerc = input.float(2.0, "Take Profit (%)", tooltip="Set 999 to disable")

// Calculate Net Volume Oscillator
priceRange = high - low
multiplier = priceRange > 0 ? (close - low) / priceRange : 0.5
var float effectiveUpVol = 0.0
var float effectiveDownVol = 0.0

if close > close[1]
    effectiveUpVol := volume * multiplier
    effectiveDownVol := volume * (1 - multiplier)
else if close < close[1]
    effectiveUpVol := volume * multiplier
    effectiveDownVol := volume * (1 - multiplier)
else
    effectiveUpVol := 0.0
    effectiveDownVol := 0.0

netVolume = effectiveUpVol - effectiveDownVol
dailyNetOscillator = volume > 0 ? (netVolume / volume) * 100 : 0

// Apply selected Moving Average
var float oscillator = na
if maType == "WMA"
    oscillator := ta.wma(dailyNetOscillator, maLength) * oscillatorMultiplier
else if maType == "EMA"
    oscillator := ta.ema(dailyNetOscillator, maLength) * oscillatorMultiplier
else if maType == "SMA"
    oscillator := ta.sma(dailyNetOscillator, maLength) * oscillatorMultiplier
else if maType == "HMA"
    oscillator := ta.hma(dailyNetOscillator, maLength) * oscillatorMultiplier

// EMA Overlay
emaOverlay = ta.ema(oscillator, emaOverlayLength)

// Rate of Change (ROC) for Oscillator
roc = ta.roc(oscillator, 1)  // 1-period rate of change

// Trading logic
longCondition = oscillator > emaOverlay
shortCondition = oscillator < emaOverlay

// Exit conditions
exitLong = oscillator < emaOverlay and strategy.position_size > 0
exitShort = oscillator > emaOverlay and strategy.position_size < 0

// Execute trades
if longCondition and strategy.position_size <= 0
    strategy.entry("Long", strategy.long)
if exitLong
    strategy.close("Long")

if shortCondition and strategy.position_size >= 0
    strategy.entry("Short", strategy.short)
if exitShort
    strategy.close("Short")

// Stop Loss and Take Profit
stopLossLong = stopLossPerc != 999 ? strategy.position_avg_price * (1 - stopLossPerc/100) : na
takeProfitLong = takeProfitPerc != 999 ? strategy.position_avg_price * (1 + takeProfitPerc/100) : na

stopLossShort = stopLossPerc != 999 ? strategy.position_avg_price * (1 + stopLossPerc/100) : na
takeProfitShort = takeProfitPerc != 999 ? strategy.position_avg_price * (1 - takeProfitPerc/100) : na

if (not na(stopLossLong) and not na(takeProfitLong) and strategy.position_size > 0)
    strategy.exit("Long SL/TP", "Long", stop=stopLossLong, limit=takeProfitLong)

if (not na(stopLossShort) and not na(takeProfitShort) and strategy.position_size < 0)
    strategy.exit("Short SL/TP", "Short", stop=stopLossShort, limit=takeProfitShort)

// Plotting
plot(oscillator, "Net Volume Oscillator", color.blue)
plot(emaOverlay, "EMA Overlay", color.orange)
hline(0, "Zero Line", color.gray)

// Histogram with Trend Change Visualization
var color histogramColor = na
if oscillator > 0
    histogramColor := roc >= 0 ? color.new(color.green, 70) : color.new(color.lime, 70)  // Green for bullish, light green for weakening
else if oscillator < 0
    histogramColor := roc >= 0 ? color.new(color.red, 70) : color.new(color.maroon, 70)  // Red for bearish, light red for weakening

plot(showHistogram ? oscillator : na, style=plot.style_histogram, color=histogramColor, title="Histogram")
Detail
https://www.fmz.com/strategy/483519
Last Modified
2025-02-27 16:46:30