
17 KiB
Name
多重均线回归MACD趋势确认策略-Multiple-EMA-Reversion-MACD-Trend-Confirmation-Strategy
Author
ianzeng123
Strategy Description
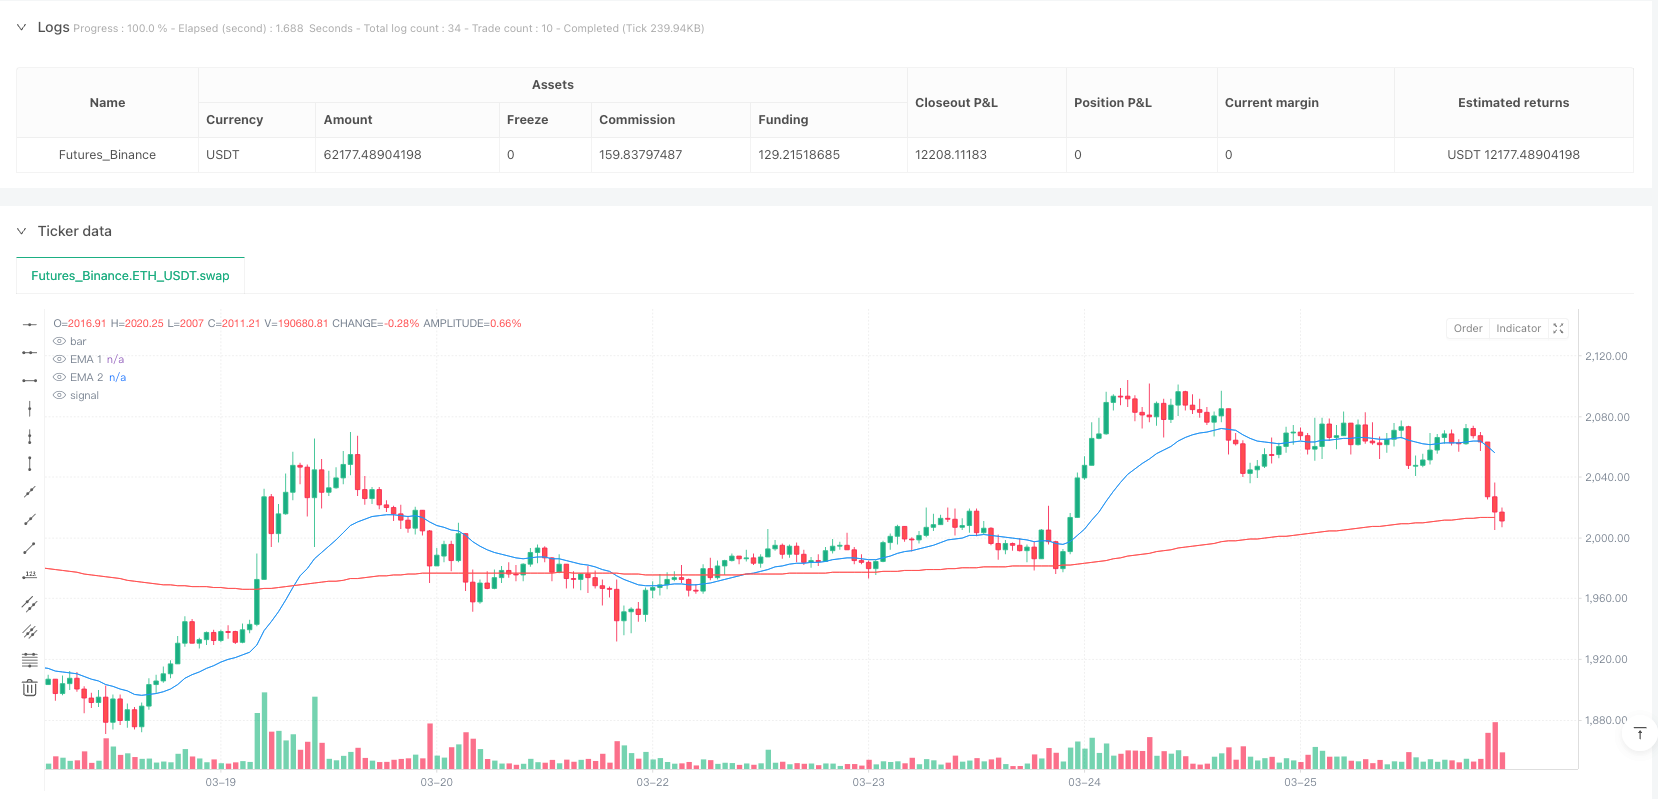
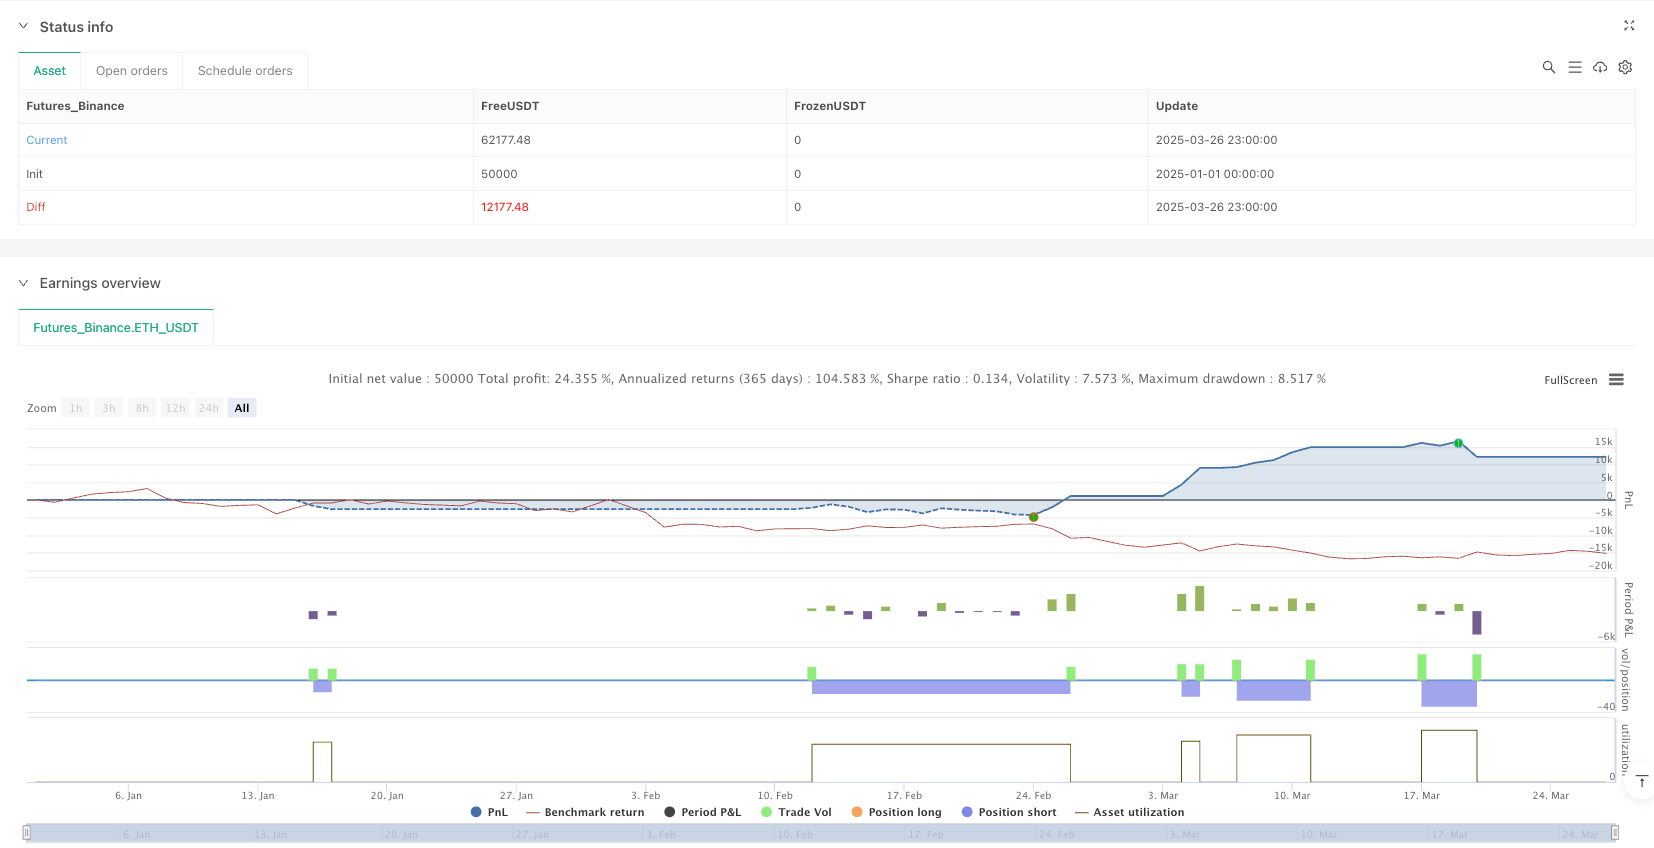
[trans]
概述
多重均线回归MACD趋势确认策略是一种结合了均线系统、价格回归和MACD指标的趋势交易系统。该策略核心理念在于寻找价格回归至长期均线(200/250均线)附近的交易机会,并使用MACD指标作为入场确认信号。策略同时运用了多重隐藏均线作为辅助筛选条件,以及基于ATR的动态止损和固定风险回报比设置,形成了一个完整的交易系统。
策略原理
这一策略基于以下核心原理进行交易:
- 趋势判断: 使用20均线与250均线的相对位置判断市场总体趋势。当20均线位于250均线上方时,认为市场处于上升趋势;当20均线位于250均线下方时,认为市场处于下降趋势。
- 价格回归: 策略只在价格回归至长期均线(250日均线)附近时寻找入场机会,这基于"价格最终会回归均线"的均值回归理论。
- 入场条件: 通过MACD交叉作为入场触发信号,结合均线位置过滤。
- 隐藏均线筛选: 策略使用三条额外的"隐藏均线"(2日、100日和300日均线)创建入场窗口,要求价格处于特定均线之间。
- 风险管理: 使用基于ATR的动态止损,默认为5倍ATR值,并通过预设的风险回报比(默认1.5)自动计算获利目标。
多头入场条件:
- 20均线位于250均线上方(确认上升趋势)
- 2日均线位于300日均线上方且2日均线位于100日均线下方(确认价格回归区域)
- MACD线上穿信号线(确认动量转变)
空头入场条件:
- 20均线位于250均线下方(确认下降趋势)
- 2日均线位于300日均线下方且2日均线位于100日均线上方(确认价格回归区域)
- MACD线下穿信号线(确认动量转变)
策略优势
- 趋势跟随与回调结合: 策略既尊重中长期趋势方向(通过20/250均线判断),又能在价格回调时捕捉更优的入场点,降低了追高或抄底的风险。
- 精确的入场区域: 通过多重均线的组合筛选,创建了一个相对精确的入场窗口,减少了错误信号。
- 动态风险管理: 基于ATR的止损设置使得策略能够根据市场波动性自动调整风险敞口,在高波动市场中设置更宽松的止损,低波动市场中设置更紧的止损。
- 系统化的获利目标: 通过预设的风险回报比自动计算目标价位,避免了主观判断。
- 信号筛选机制: 多重条件的交叉验证(均线位置+MACD交叉)降低了假信号的可能性。
- 视觉化辅助: 策略在满足入场条件时通过背景色标记,使交易者能够直观地识别入场机会。
策略风险
- 均线滞后性: 均线本质上是滞后指标,在快速变化的市场中可能无法及时反应价格变化,导致进出场信号延迟。解决方法:可以考虑调整均线参数,例如采用更短期的EMA1或使用权重更高的均线如Hull均线。
- 复杂条件导致交易机会稀少: 多重入场条件的叠加可能导致实际交易信号相对稀少,特别是在震荡市场中。解决方法:可以根据不同市场条件优化入场条件,或增加额外的入场逻辑。
- 固定风险回报比的局限性: 预设的固定风险回报比可能不适合所有市场环境,在趋势强劲时可能过早获利,而在震荡市场中可能导致目标价难以达成。解决方法:可以考虑动态调整风险回报比,或实施分批获利策略。
- 对参数变化敏感: 策略使用了多个均线和MACD参数,过度优化可能导致过拟合风险。解决方法:进行稳健性测试,确保在参数小幅变化时策略表现仍然稳定。
- 缺乏市场环境过滤: 策略没有识别整体市场环境(如趋势强度、波动率范围等)的机制,可能在不适合的市场条件下产生信号。解决方法:添加市场环境过滤器,如ADX指标判断趋势强度,或波动率阈值控制。
策略优化方向
- 动态调整风险回报比: 可以根据市场波动性或趋势强度自动调整风险回报比,例如在强趋势市场中使用更高的风险回报比,在震荡市场中使用更低的风险回报比。这样可以更好地适应不同市场环境,提高策略的适应性。
- 增加市场环境过滤: 引入额外指标如ADX(平均趋向指标)来判断趋势强度,只在趋势明确时执行交易。还可以基于VIX或ATR范围判断波动环境,避免在过度波动或波动不足的市场中交易。
- 分批获利策略: 可以实施分批获利策略,例如在达到0.5R、1R和最终目标时分别平仓一部分仓位,这样既能锁定部分利润,又能让部分仓位继续获取潜在收益。
- 改进均线系统: 可以尝试使用自适应均线如KAMA(考夫曼自适应移动平均线)或Hull均线替代标准EMA,减少均线滞后性并提高对价格变化的响应速度。
- 整合成交量确认: 在入场信号生成时增加成交量确认条件,例如要求MACD交叉时伴随成交量增加,提高信号可靠性。
- 增加时间过滤: 可以添加时间过滤器,避免在市场开盘或收盘前一小时等波动较大或流动性较差的时段交易。
- 优化止损机制: 可以实施追踪止损,而不是固定止损,特别是在利润达到一定水平后,这样可以最大化已有利润的保护。
总结
多重均线回归MACD趋势确认策略是一个融合了多种技术分析方法的综合交易系统,其核心优势在于结合了趋势判断、价格回归理论、动量确认和系统化风险管理。策略通过均线系统识别总体趋势方向,通过价格回归至长期均线附近的机制寻找高胜率入场点,并使用MACD作为动量确认信号减少假信号。
该策略特别适合中长期趋势市场,在强趋势环境中能够捕捉价格回调后继续沿趋势方向发展的机会。然而,策略也存在均线滞后性、交易机会稀少等潜在风险,需要通过市场环境过滤、动态风险管理等方式进行优化。
通过添加市场环境过滤机制、动态调整风险回报比以及改进均线系统,该策略有望进一步提高稳定性和适应性,成为一个更加全面和有效的交易系统。对于追求系统化交易的投资者而言,这种结合多重技术指标并具备完整风险管理机制的策略提供了一个值得考虑的交易框架。 ||
Overview
The Multiple EMA Reversion MACD Trend Confirmation Strategy is a trend trading system that combines a multi-EMA approach, price reversion, and MACD indicator. The core concept involves seeking trading opportunities when price reverts to the vicinity of a long-term moving average (200/250 EMA) and using the MACD indicator as an entry confirmation signal. The strategy also employs multiple hidden EMAs as auxiliary filtering conditions, along with ATR-based dynamic stop-loss and a fixed risk-reward ratio setup, forming a complete trading system.
Strategy Principles
This strategy executes trades based on the following core principles:
- Trend Determination: Uses the relative position of the 20 EMA to the 250 EMA to determine the overall market trend. When the 20 EMA is above the 250 EMA, the market is considered to be in an uptrend; when the 20 EMA is below the 250 EMA, the market is considered to be in a downtrend.
- Price Reversion: The strategy only looks for entry opportunities when the price reverts to the vicinity of the long-term moving average (250-day EMA), based on the mean reversion theory that "prices eventually return to their mean."
- Entry Conditions: Uses MACD crossovers as entry trigger signals, combined with EMA positioning filters.
- Hidden EMA Filtering: The strategy uses three additional "hidden EMAs" (2-day, 100-day, and 300-day EMAs) to create an entry window, requiring the price to be between specific EMAs.
- Risk Management: Uses ATR-based dynamic stop-loss, defaulting to 5 times the ATR value, and automatically calculates profit targets using a preset risk-reward ratio (default 1.5).
Long Entry Conditions:
- 20 EMA is above the 250 EMA (confirming uptrend)
- 2-day EMA is above the 300-day EMA and the 2-day EMA is below the 100-day EMA (confirming price reversion zone)
- MACD line crosses above the signal line (confirming momentum shift)
Short Entry Conditions:
- 20 EMA is below the 250 EMA (confirming downtrend)
- 2-day EMA is below the 300-day EMA and the 2-day EMA is above the 100-day EMA (confirming price reversion zone)
- MACD line crosses below the signal line (confirming momentum shift)
Strategy Advantages
- Combination of Trend Following and Pullbacks: The strategy respects the medium to long-term trend direction (determined by 20/250 EMAs) while capturing better entry points during price pullbacks, reducing the risk of chasing highs or catching falling knives.
- Precise Entry Zones: Through the combination of multiple EMAs, the strategy creates a relatively precise entry window, reducing false signals.
- Dynamic Risk Management: ATR-based stop-loss settings allow the strategy to automatically adjust risk exposure according to market volatility, setting wider stops in highly volatile markets and tighter stops in less volatile conditions.
- Systematic Profit Targets: Automatically calculates target prices through preset risk-reward ratios, avoiding subjective judgment.
- Signal Filtering Mechanism: Cross-validation of multiple conditions (EMA positions + MACD crossovers) reduces the possibility of false signals.
- Visual Assistance: The strategy marks entry conditions with background colors, allowing traders to visually identify entry opportunities.
Strategy Risks
- EMA Lag: EMAs are inherently lagging indicators and may not respond to price changes in time during rapidly changing markets, leading to delayed entry and exit signals. Solution: Consider adjusting EMA parameters, such as adopting a shorter-term EMA1 or using higher-weighted moving averages like Hull moving averages.
- Complex Conditions Leading to Scarce Trading Opportunities: The stacking of multiple entry conditions may result in relatively few actual trading signals, especially in range-bound markets. Solution: Optimize entry conditions based on different market conditions, or add additional entry logic.
- Limitations of Fixed Risk-Reward Ratios: Preset fixed risk-reward ratios may not be suitable for all market environments, potentially leading to premature profit-taking in strong trends and unattainable targets in range-bound markets. Solution: Consider dynamically adjusting risk-reward ratios, or implementing a scaled profit-taking strategy.
- Sensitivity to Parameter Changes: The strategy uses multiple EMA and MACD parameters, and excessive optimization may lead to overfitting risk. Solution: Conduct robustness testing to ensure strategy performance remains stable with small parameter changes.
- Lack of Market Environment Filtering: The strategy lacks mechanisms to identify overall market conditions (such as trend strength, volatility range, etc.), and may generate signals under unsuitable market conditions. Solution: Add market environment filters, such as ADX indicators to determine trend strength, or volatility thresholds.
Strategy Optimization Directions
- Dynamic Adjustment of Risk-Reward Ratios: Risk-reward ratios can be automatically adjusted based on market volatility or trend strength, using higher risk-reward ratios in strong trend markets and lower ones in range-bound markets. This can better adapt to different market environments and improve strategy adaptability.
- Add Market Environment Filtering: Introduce additional indicators such as ADX (Average Directional Index) to determine trend strength, executing trades only when trends are clear. VIX or ATR ranges can also be used to judge volatility environments, avoiding trading in excessively volatile or insufficiently volatile markets.
- Scaled Profit-Taking Strategy: Implement a scaled profit-taking strategy, such as closing portions of positions at 0.5R, 1R, and final targets respectively, both securing partial profits and allowing the remaining position to capture potential gains.
- Improve the EMA System: Try using adaptive moving averages such as KAMA (Kaufman's Adaptive Moving Average) or Hull moving averages instead of standard EMAs, reducing lag and improving responsiveness to price changes.
- Integrate Volume Confirmation: Add volume confirmation conditions when generating entry signals, such as requiring increased volume during MACD crossovers, improving signal reliability.
- Add Time Filters: Add time filters to avoid trading during periods of high volatility or poor liquidity, such as an hour before market opening or closing.
- Optimize Stop-Loss Mechanisms: Implement trailing stops instead of fixed stops, especially after profits reach certain levels, maximizing the protection of existing profits.
Summary
The Multiple EMA Reversion MACD Trend Confirmation Strategy is a comprehensive trading system that integrates multiple technical analysis methods. Its core advantages lie in combining trend determination, price reversion theory, momentum confirmation, and systematic risk management. The strategy identifies overall trend direction through the EMA system, seeks high-probability entry points through price reversion to long-term EMAs, and uses MACD as a momentum confirmation signal to reduce false signals.
This strategy is particularly suitable for medium to long-term trending markets, capturing opportunities for price pullbacks to continue developing along the trend direction in strong trend environments. However, the strategy also faces potential risks such as EMA lag and scarce trading opportunities, which need to be optimized through market environment filtering, dynamic risk management, and other methods.
By adding market environment filtering mechanisms, dynamically adjusting risk-reward ratios, and improving the EMA system, this strategy has the potential to further enhance stability and adaptability, becoming a more comprehensive and effective trading system. For investors pursuing systematic trading, this strategy, which combines multiple technical indicators and possesses complete risk management mechanisms, provides a trading framework worth considering. [/trans]
Source (PineScript)
/*backtest
start: 2025-01-01 00:00:00
end: 2025-03-27 00:00:00
period: 1h
basePeriod: 1h
exchanges: [{"eid":"Futures_Binance","currency":"ETH_USDT"}]
*/

//@version=5
strategy("Price Near 200 EMA", overlay=true, default_qty_type=strategy.percent_of_equity, default_qty_value=100)

// === User Inputs ===
ema1Length = input(20, title="EMA 1 Length")     // Main EMA (Trend)
ema2Length = input(250, title="EMA 2 Length")    // Long-term EMA
macdFastLength = input(12, title="MACD Fast Length")
macdSlowLength = input(26, title="MACD Slow Length")
macdSignalLength = input(9, title="MACD Signal Length")

rrRatio = input.float(1.5, title="Risk to Reward Ratio", minval=1, step=0.1)
atrMultiplier = input.float(5, title="ATR Multiplier for SL", minval=1, step=0.1)  // Default to 5x ATR
atrLength = input(14, title="ATR Length")  // User-defined ATR length

// === Hidden EMA Lengths (Hardcoded) ===
ema3Length = 2    // Fast EMA (Hidden)
ema4Length = 100  // Medium EMA (Hidden)
ema5Length = 300  // Long EMA (Hidden)

// === EMA Calculations ===
ema1 = ta.ema(close, ema1Length)  // 20 EMA
ema2 = ta.ema(close, ema2Length)  // 250 EMA
ema3 = ta.ema(close, ema3Length)  // 2 EMA (Hidden)
ema4 = ta.ema(close, ema4Length)  // 100 EMA (Hidden)
ema5 = ta.ema(close, ema5Length)  // 300 EMA (Hidden)

// === MACD Calculation ===
[macdLine, signalLine, _] = ta.macd(close, macdFastLength, macdSlowLength, macdSignalLength)
macdBullish = ta.crossover(macdLine, signalLine)
macdBearish = ta.crossunder(macdLine, signalLine)

// === ATR for Dynamic Stop Loss ===
atrValue = ta.atr(atrLength)

// === Long Conditions ===
bullishCondition1 = ema1 > ema2
bullishCondition2 = ema3 > ema5 and ema3 < ema4
bullishEntry = bullishCondition1 and bullishCondition2 and macdBullish

// === Short Conditions ===
bearishCondition1 = ema1 < ema2
bearishCondition2 = ema3 < ema5 and ema3 > ema4
bearishEntry = bearishCondition1 and bearishCondition2 and macdBearish

// === Calculate Stop Loss and Target Using ATR ===
longStopLoss = close - atrValue * atrMultiplier
longTargetPrice = close + (close - longStopLoss) * rrRatio

shortStopLoss = close + atrValue * atrMultiplier
shortTargetPrice = close - (shortStopLoss - close) * rrRatio

// === Entry and Exit Logic ===
if bullishEntry
    strategy.entry("Buy", strategy.long)
    strategy.exit("TP Long", "Buy", limit=longTargetPrice, stop=longStopLoss, comment="SL/TP Long")

if bearishEntry
    strategy.entry("Sell", strategy.short)
    strategy.exit("TP Short", "Sell", limit=shortTargetPrice, stop=shortStopLoss, comment="SL/TP Short")

// === Plotting Only Visible EMAs ===
plot(ema1, title="EMA 1", color=color.blue)
plot(ema2, title="EMA 2", color=color.red)

// === Background Highlight for Entries ===
bgcolor(bullishEntry ? color.new(color.green, 90) : na, title="Bullish Background")
bgcolor(bearishEntry ? color.new(color.red, 90) : na, title="Bearish Background")
Detail
https://www.fmz.com/strategy/488523
Last Modified
2025-03-28 15:40:36