
8.7 KiB
Name
多重均线交叉信号优化交易策略-Multiple-Moving-Average-Crossover-Signal-Enhanced-Trading-Strategy
Author
ChaoZhang
Strategy Description
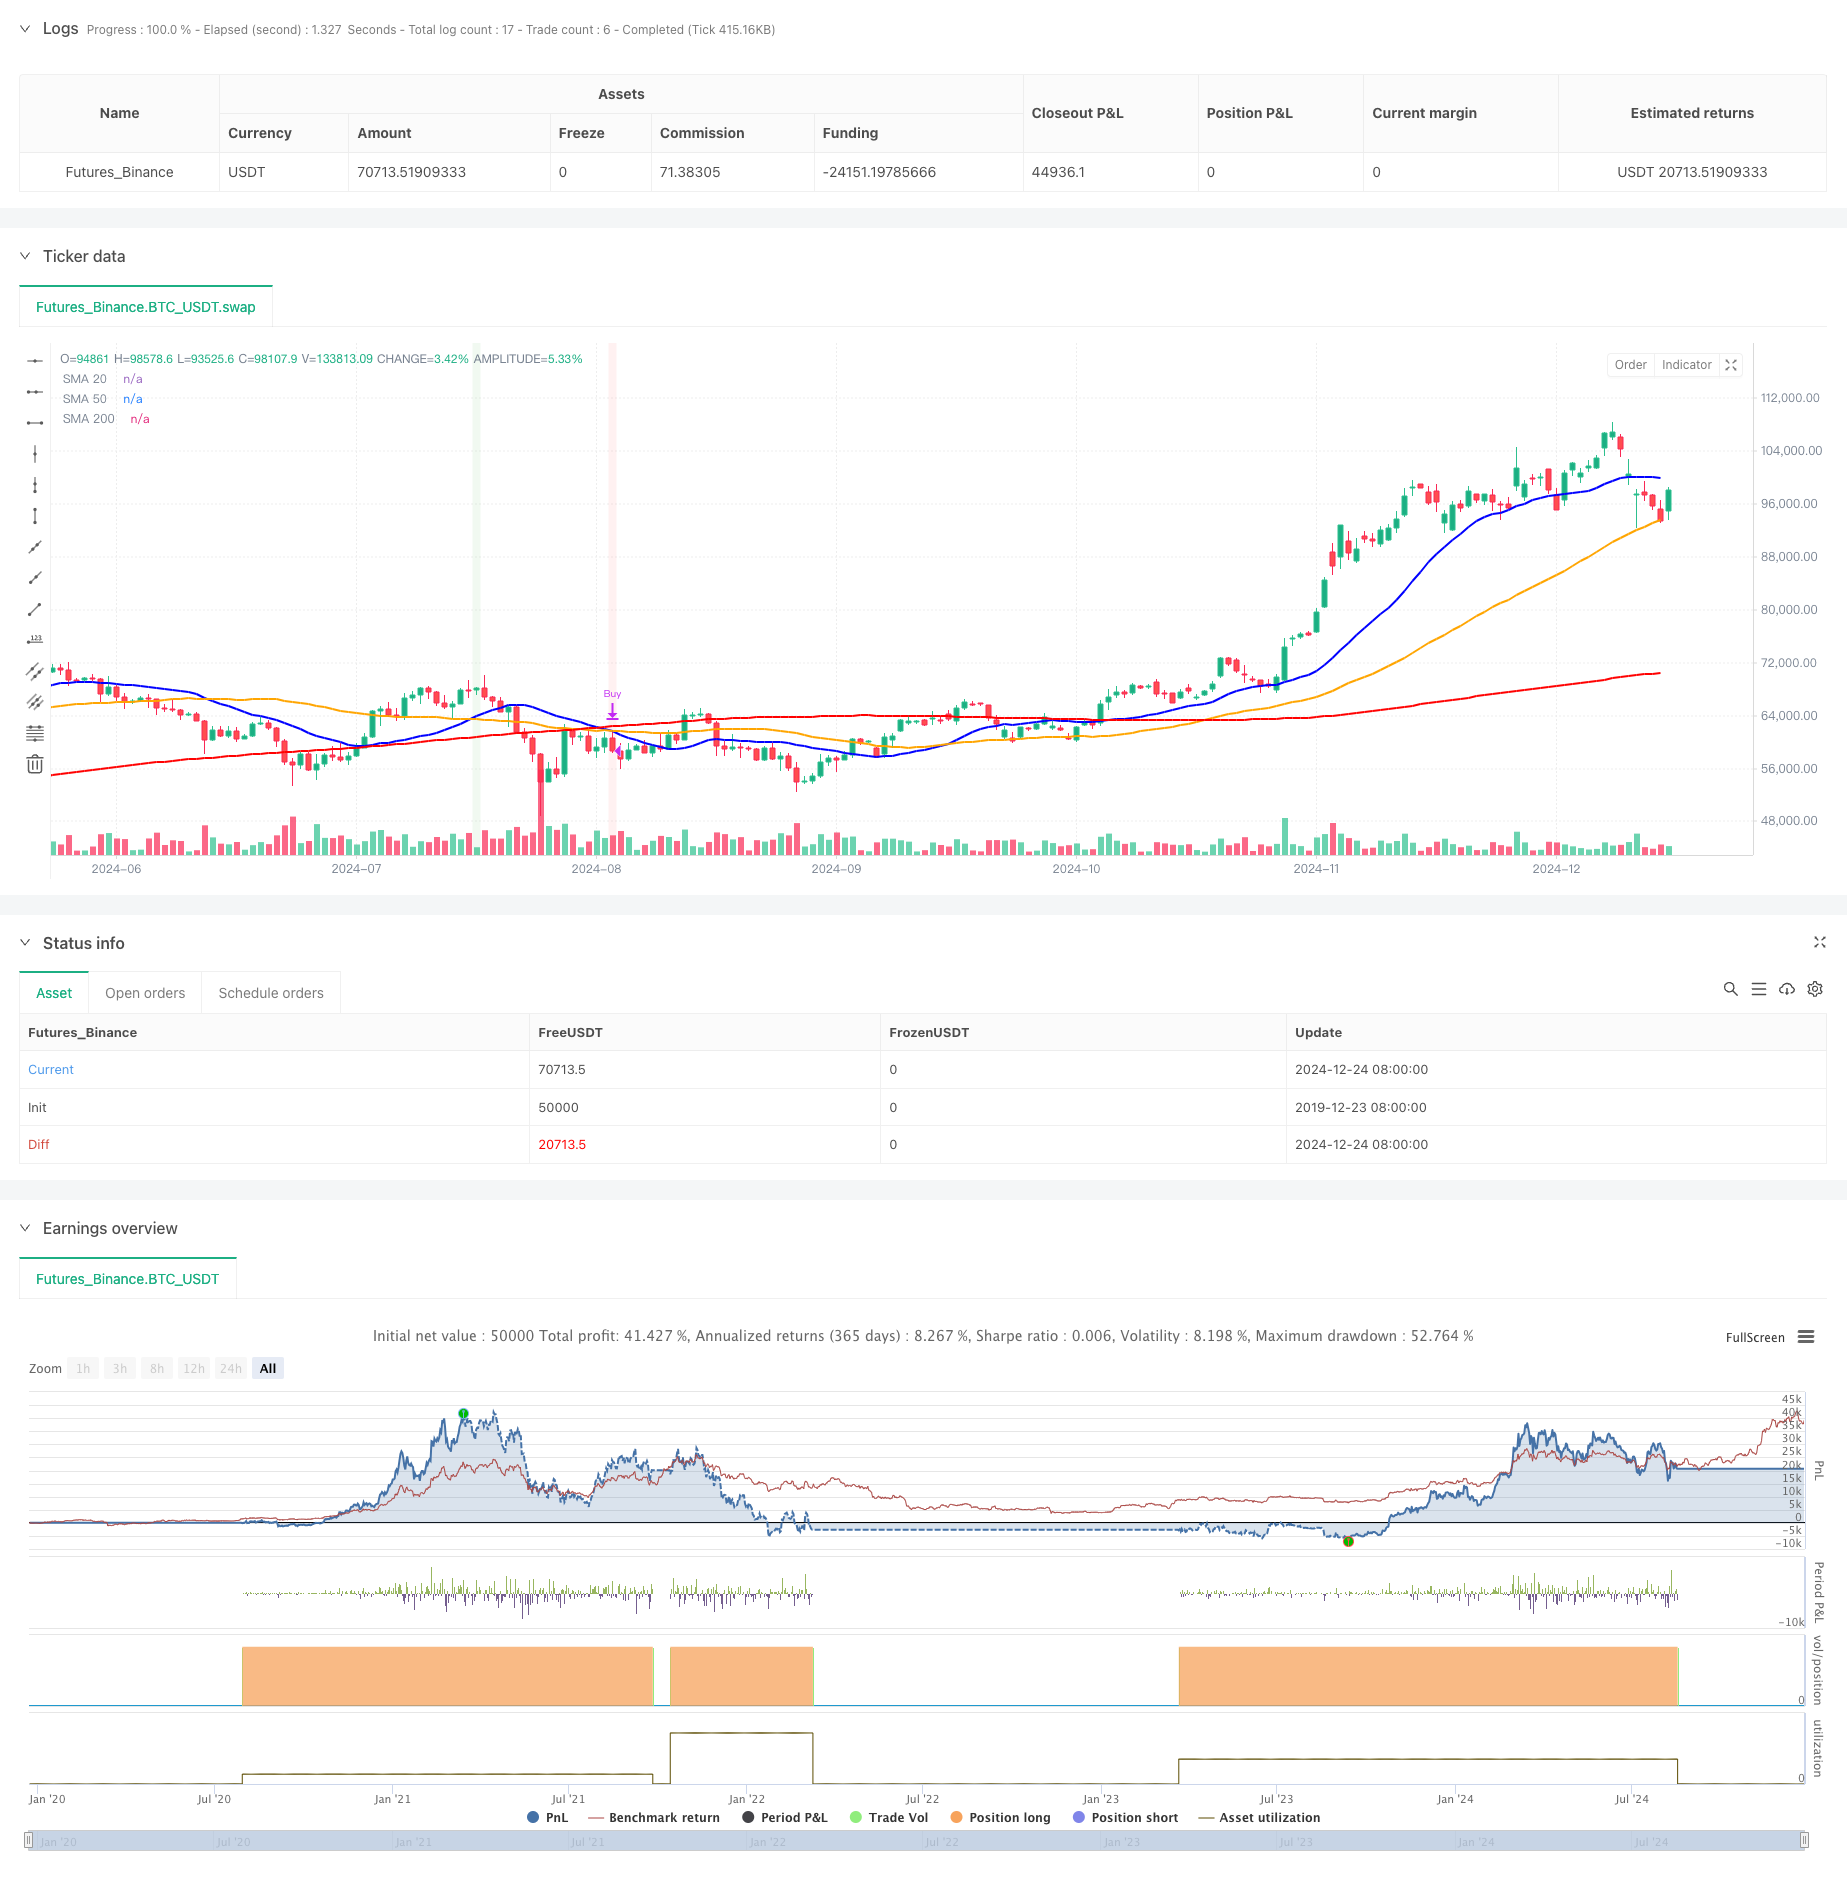
[trans]
概述
本策略是一个基于多重移动平均线(SMA)交叉信号的量化交易系统。它综合运用了20日、50日和200日三条不同周期的简单移动平均线,通过捕捉均线交叉信号和价格位置关系来识别市场趋势变化和潜在的交易机会。该策略不仅考虑了短期和中期均线的交叉信号,还将长期均线作为趋势过滤器,有效提升了交易质量。
策略原理
策略的核心逻辑基于以下几个关键要素:
- 使用20日均线作为短期趋势指标,50日均线作为中期趋势指标,200日均线作为长期趋势指标
- 主要入场信号:当20日均线向上穿越50日均线,且价格位于200日均线之上时,系统产生做多信号
- 主要出场信号:当20日均线向下穿越50日均线,且价格位于200日均线之下时,系统产生平仓信号
- 次要信号:监测50日均线与200日均线的交叉,作为辅助判断依据
- 通过可视化标记和背景色变化,直观显示交易信号
策略优势
- 多重时间框架分析:通过整合不同周期的移动平均线,全面把握市场走势
- 趋势过滤:利用200日均线作为趋势过滤器,有效降低假突破风险
- 信号分层:区分主次信号,提供更全面的市场洞察
- 可视化增强:使用标记和背景色,提升策略可读性
- 参数灵活:允许自定义均线周期、颜色和线宽,适应不同交易需求
策略风险
- 震荡市场风险:在横盘整理阶段可能产生频繁的虚假信号
- 滞后性风险:移动平均线本质上是滞后指标,可能错过关键转折点
- 参数依赖:不同市场环境下最优参数可能存在显著差异
- 趋势依赖:策略在明显趋势市场表现较好,但在区间震荡时效果欠佳
- 信号冲突:多重均线可能产生相互矛盾的信号
策略优化方向
- 引入波动率指标:考虑加入ATR等波动率指标,动态调整仓位规模
- 增加成交量确认:结合成交量分析,提高信号可靠性
- 优化出场机制:设计更灵活的止损止盈策略
- 加入市场环境过滤:开发市场环境识别模块,在不同市场状态下采用不同参数
- 实现自适应参数:根据市场特征动态调整均线周期
总结
这是一个结构完整、逻辑清晰的多重均线交易策略。通过综合运用不同周期的移动平均线,并结合价格位置关系,策略能够较好地捕捉市场趋势变化。虽然存在一定的滞后性和震荡市场风险,但通过合理的参数设置和信号过滤,策略仍具有较好的实用价值。未来可以通过引入更多技术指标和优化信号生成机制来进一步提升策略的稳定性和可靠性。 ||
Overview
This strategy is a quantitative trading system based on multiple Simple Moving Average (SMA) crossover signals. It utilizes three SMAs with different periods (20, 50, and 200 days) to identify market trend changes and potential trading opportunities by capturing moving average crossovers and price position relationships. The strategy considers both short-term and medium-term moving average crossovers while using the long-term moving average as a trend filter to enhance trading quality.
Strategy Principles
The core logic is based on the following key elements:
- Uses 20-day SMA as short-term trend indicator, 50-day SMA as medium-term trend indicator, and 200-day SMA as long-term trend indicator
- Main entry signal: When 20-day SMA crosses above 50-day SMA and price is above 200-day SMA, system generates long signal
- Main exit signal: When 20-day SMA crosses below 50-day SMA and price is below 200-day SMA, system generates closing signal
- Secondary signals: Monitors crossovers between 50-day and 200-day SMAs as supplementary indicators
- Visualizes trading signals through markers and background color changes
Strategy Advantages
- Multi-timeframe analysis: Integrates moving averages of different periods for comprehensive trend analysis
- Trend filtering: Uses 200-day SMA as trend filter to effectively reduce false breakout risks
- Signal hierarchy: Distinguishes between primary and secondary signals for better market insight
- Enhanced visualization: Uses markers and background colors to improve strategy readability
- Flexible parameters: Allows customization of moving average periods, colors, and line widths to adapt to different trading needs
Strategy Risks
- Sideways market risk: May generate frequent false signals during consolidation phases
- Lag risk: Moving averages are inherently lagging indicators and may miss critical turning points
- Parameter dependency: Optimal parameters may vary significantly across different market environments
- Trend dependency: Strategy performs better in trending markets but underperforms in ranging markets
- Signal conflicts: Multiple moving averages may generate contradictory signals
Strategy Optimization Directions
- Incorporate volatility indicators: Consider adding ATR or other volatility indicators for dynamic position sizing
- Add volume confirmation: Integrate volume analysis to improve signal reliability
- Optimize exit mechanism: Design more flexible stop-loss and take-profit strategies
- Add market environment filtering: Develop market state recognition module to use different parameters in different market conditions
- Implement adaptive parameters: Dynamically adjust moving average periods based on market characteristics
Summary
This is a well-structured moving average trading strategy with clear logic. By comprehensively utilizing moving averages of different periods combined with price position relationships, the strategy effectively captures market trend changes. While it has certain inherent risks such as lag and sideways market vulnerability, the strategy maintains practical value through reasonable parameter settings and signal filtering. Future improvements can focus on incorporating additional technical indicators and optimizing signal generation mechanisms to enhance strategy stability and reliability.[/trans]
Source (PineScript)
/*backtest
start: 2019-12-23 08:00:00
end: 2024-12-25 08:00:00
period: 1d
basePeriod: 1d
exchanges: [{"eid":"Futures_Binance","currency":"BTC_USDT"}]
*/

//@version=5
strategy("SMA 20/50/200 Strateji", overlay=true)

// SMA Periyotlarını, renklerini ve çizgi kalınlıklarını özelleştirme
sma20_period = input.int(20, title="SMA 20 Periyodu", minval=1)
sma50_period = input.int(50, title="SMA 50 Periyodu", minval=1)
sma200_period = input.int(200, title="SMA 200 Periyodu", minval=1)

sma20_color = input.color(color.blue, title="SMA 20 Rengi")
sma50_color = input.color(color.orange, title="SMA 50 Rengi")
sma200_color = input.color(color.red, title="SMA 200 Rengi")

sma20_width = input.int(2, title="SMA 20 Kalınlığı", minval=1, maxval=5)
sma50_width = input.int(2, title="SMA 50 Kalınlığı", minval=1, maxval=5)
sma200_width = input.int(2, title="SMA 200 Kalınlığı", minval=1, maxval=5)

// SMA Hesaplamaları
sma20 = ta.sma(close, sma20_period)
sma50 = ta.sma(close, sma50_period)
sma200 = ta.sma(close, sma200_period)

// Al ve Sat Koşulları
buyCondition = ta.crossover(sma20, sma50) and close > sma200
sellCondition = ta.crossunder(sma20, sma50) and close < sma200

buyCondition_50_200 = ta.crossover(sma50, sma200)
sellCondition_50_200 = ta.crossunder(sma50, sma200)

// Grafik üzerine SMA çizimleri
plot(sma20, color=sma20_color, linewidth=sma20_width, title="SMA 20")
plot(sma50, color=sma50_color, linewidth=sma50_width, title="SMA 50")
plot(sma200, color=sma200_color, linewidth=sma200_width, title="SMA 200")

// Al-Sat Stratejisi
if buyCondition
    strategy.entry("Buy", strategy.long)
    label.new(bar_index, low, "BUY", style=label.style_label_up, color=color.new(color.green, 0), textcolor=color.white)

if sellCondition
    strategy.close("Buy")
    label.new(bar_index, high, "SELL", style=label.style_label_down, color=color.new(color.red, 0), textcolor=color.white)

if buyCondition_50_200
    label.new(bar_index, low, "50/200 BUY", style=label.style_label_up, color=color.new(color.blue, 0), textcolor=color.white)

if sellCondition_50_200
    label.new(bar_index, high, "50/200 SELL", style=label.style_label_down, color=color.new(color.orange, 0), textcolor=color.white)

// Performans Görselleştirmesi İçin Arka Plan Rengi
bgColor = buyCondition ? color.new(color.green, 90) : sellCondition ? color.new(color.red, 90) : na
bgcolor(bgColor)
Detail
https://www.fmz.com/strategy/476268
Last Modified
2024-12-27 15:34:02