
6.2 KiB
Name
多重动量指标趋势追踪量化交易策略-Multi-Momentum-Indicator-Trend-Tracking-Quantitative-Trading-Strategy
Author
ianzeng123
Strategy Description
[trans]
概述
多重动量指数趋势追踪量化交易策略是一种结合指数移动平均线(EMA)、相对强弱指数(RSI)和移动平均收敛发散指标(MACD)的复合型量化交易方法。该策略通过整合多个技术指标,旨在提高交易信号的准确性和可靠性,特别适用于高波动性市场的短线和中线交易。
策略原理
该策略的核心原理是多重指标联合验证:
- 使用快速EMA(9周期)和慢速EMA(21周期)判断趋势方向和动量变化
- 通过RSI(14周期)确认市场动量和超买超卖状态
- 利用MACD指标验证趋势的动量和方向
具体交易信号生成规则:
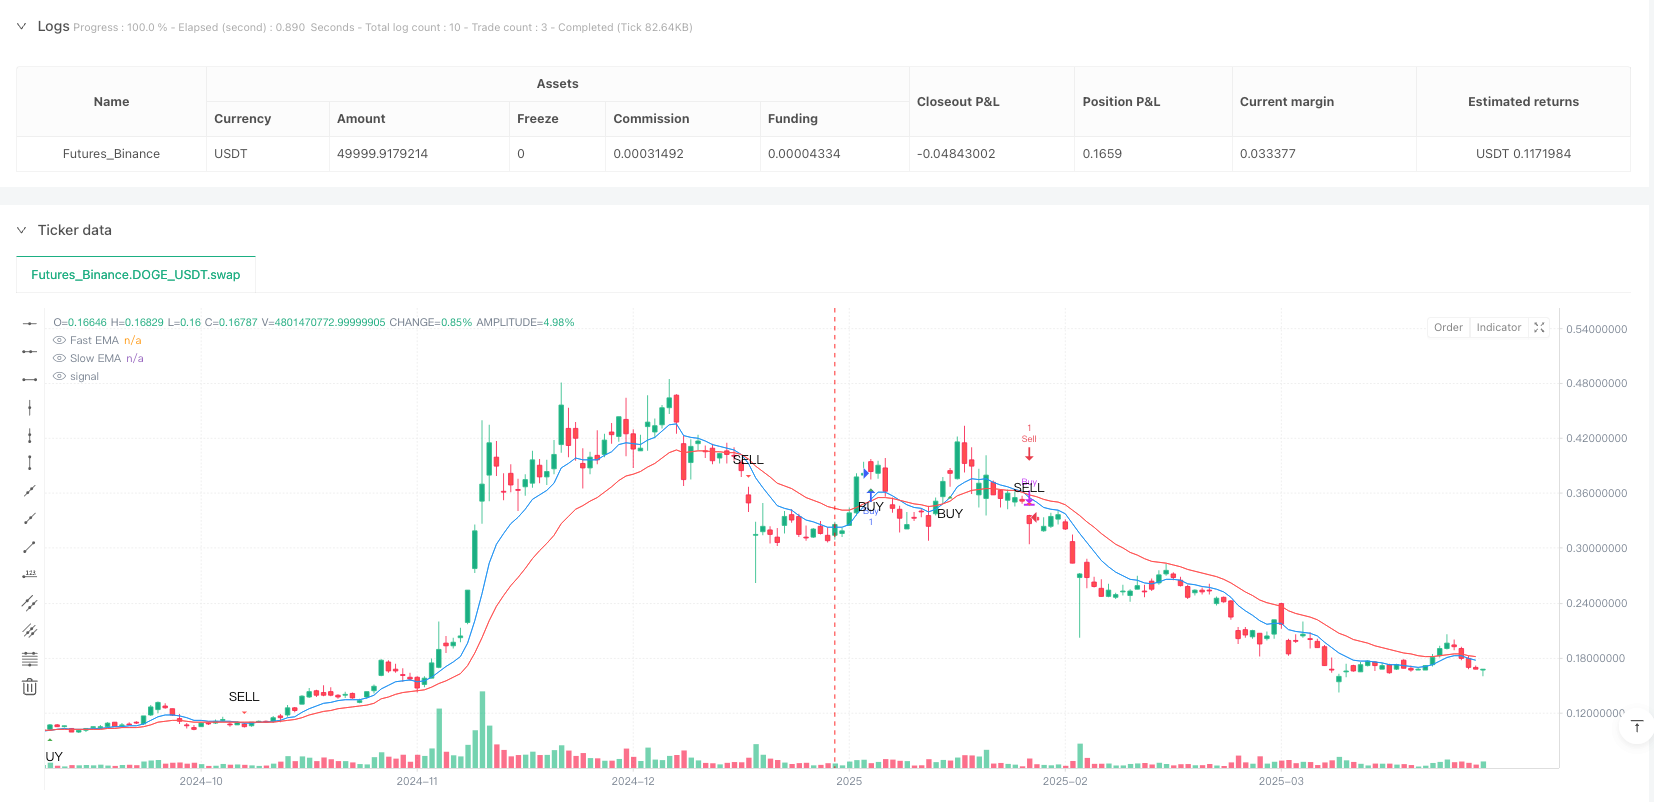
- 当快速EMA上穿慢速EMA,且RSI > 50,MACD线高于信号线时,产生买入信号
- 当快速EMA下穿慢速EMA,且RSI < 50,MACD线低于信号线时,产生卖出信号
策略优势
- 多重指标联合验证,显著降低假信号风险
- 动态捕捉市场趋势变化,适应性强
- 参数可调节,灵活应对不同市场环境
- 信号生成逻辑清晰,易于理解和实施
- 适用于高波动性市场的短线和中线交易
策略风险
- 在横盘市场中可能产生频繁无效交易
- 指标参数选择不当可能导致交易效率降低
- 未考虑交易成本和滑点影响
- 单一市场环境下策略稳定性存在局限性
策略优化方向
- 引入附加过滤条件,如成交量确认
- 增加止损和止盈机制
- 动态调整EMA、RSI和MACD参数
- 开发基于机器学习的参数自适应算法
- 引入更多市场环境的判断指标
总结
多重动量指标趋势追踪量化交易策略通过整合EMA、RSI和MACD三种关键技术指标,构建了一个相对robust的交易信号生成系统。该策略既保持了足够的灵活性,又具备较强的风险控制能力,为量化交易者提供了一个值得深入研究的交易方案。
||
Overview
The Multi-Momentum Indicator Trend Tracking Quantitative Trading Strategy is a composite quantitative trading method that combines Exponential Moving Average (EMA), Relative Strength Index (RSI), and Moving Average Convergence Divergence (MACD). By integrating multiple technical indicators, the strategy aims to improve the accuracy and reliability of trading signals, particularly suitable for short and medium-term trading in high-volatility markets.
Strategy Principle
The core principle of this strategy is multi-indicator joint verification:
- Use fast EMA (9 periods) and slow EMA (21 periods) to judge trend direction and momentum changes
- Confirm market momentum and overbought/oversold states through RSI (14 periods)
- Verify trend momentum and direction using MACD indicator
Specific signal generation rules:
- When fast EMA crosses above slow EMA, RSI > 50, and MACD line is above signal line, generate a buy signal
- When fast EMA crosses below slow EMA, RSI < 50, and MACD line is below signal line, generate a sell signal
Strategy Advantages
- Multi-indicator joint verification significantly reduces false signal risk
- Dynamically capture market trend changes with strong adaptability
- Adjustable parameters, flexible for different market environments
- Clear signal generation logic, easy to understand and implement
- Suitable for short and medium-term trading in high-volatility markets
Strategy Risks
- Potential frequent invalid trades in range-bound markets
- Inappropriate indicator parameter selection may reduce trading efficiency
- Does not consider transaction costs and slippage
- Limited stability in single market environment
Strategy Optimization Directions
- Introduce additional filtering conditions, such as volume confirmation
- Add stop-loss and take-profit mechanisms
- Dynamically adjust EMA, RSI, and MACD parameters
- Develop machine learning-based parameter adaptive algorithms
- Introduce more market environment judgment indicators
Summary
The Multi-Momentum Indicator Trend Tracking Quantitative Trading Strategy builds a relatively robust trading signal generation system by integrating three key technical indicators: EMA, RSI, and MACD. The strategy maintains sufficient flexibility while possessing strong risk control capabilities, providing quantitative traders with a trading solution worth in-depth research.[/trans]
Source (PineScript)
/*backtest
start: 2025-01-01 00:00:00
end: 2025-04-01 00:00:00
period: 1d
basePeriod: 1d
exchanges: [{"eid":"Futures_Binance","currency":"DOGE_USDT"}]
*/

//@version=6
strategy("EMA + RSI + MACD Strategy", overlay=true)

// Input for EMA Lengths
emaFastLength = input(9, title="Fast EMA Length")
emaSlowLength = input(21, title="Slow EMA Length")

// RSI Settings
rsiLength = input(14, title="RSI Length")
rsiOverbought = input(70, title="RSI Overbought Level")
rsiOversold = input(30, title="RSI Oversold Level")

// MACD Settings
[macdLine, signalLine, _] = ta.macd(close, 12, 26, 9)

// Calculate EMAs
emaFast = ta.ema(close, emaFastLength)
emaSlow = ta.ema(close, emaSlowLength)

// Calculate RSI
rsi = ta.rsi(close, rsiLength)

// Plot EMAs
plot(emaFast, title="Fast EMA", color=color.blue, linewidth=1)
plot(emaSlow, title="Slow EMA", color=color.red, linewidth=1)

// Buy and Sell Conditions
bullishCrossover = ta.crossover(emaFast, emaSlow) and rsi > 50 and macdLine > signalLine
bearishCrossover = ta.crossunder(emaFast, emaSlow) and rsi < 50 and macdLine < signalLine

// Plot Buy and Sell Signals
plotshape(series=bullishCrossover, title="BuySignal", location=location.belowbar, color=color.green, style=shape.triangleup, size=size.small, text="BUY")
plotshape(series=bearishCrossover, title="SellSignal", location=location.abovebar, color=color.red, style=shape.triangledown, size=size.small, text="SELL")

// Strategy Execution
if bullishCrossover
    strategy.entry("Buy", strategy.long)

if bearishCrossover
    strategy.close("Buy")
    strategy.entry("Sell", strategy.short)
Detail
https://www.fmz.com/strategy/489198
Last Modified
2025-04-02 16:19:35