
15 KiB
Name
多维趋势动量价值过滤交易策略-Multi-Dimensional-Trend-Momentum-Value-Filtering-Trading-Strategy
Author
ianzeng123
Strategy Description
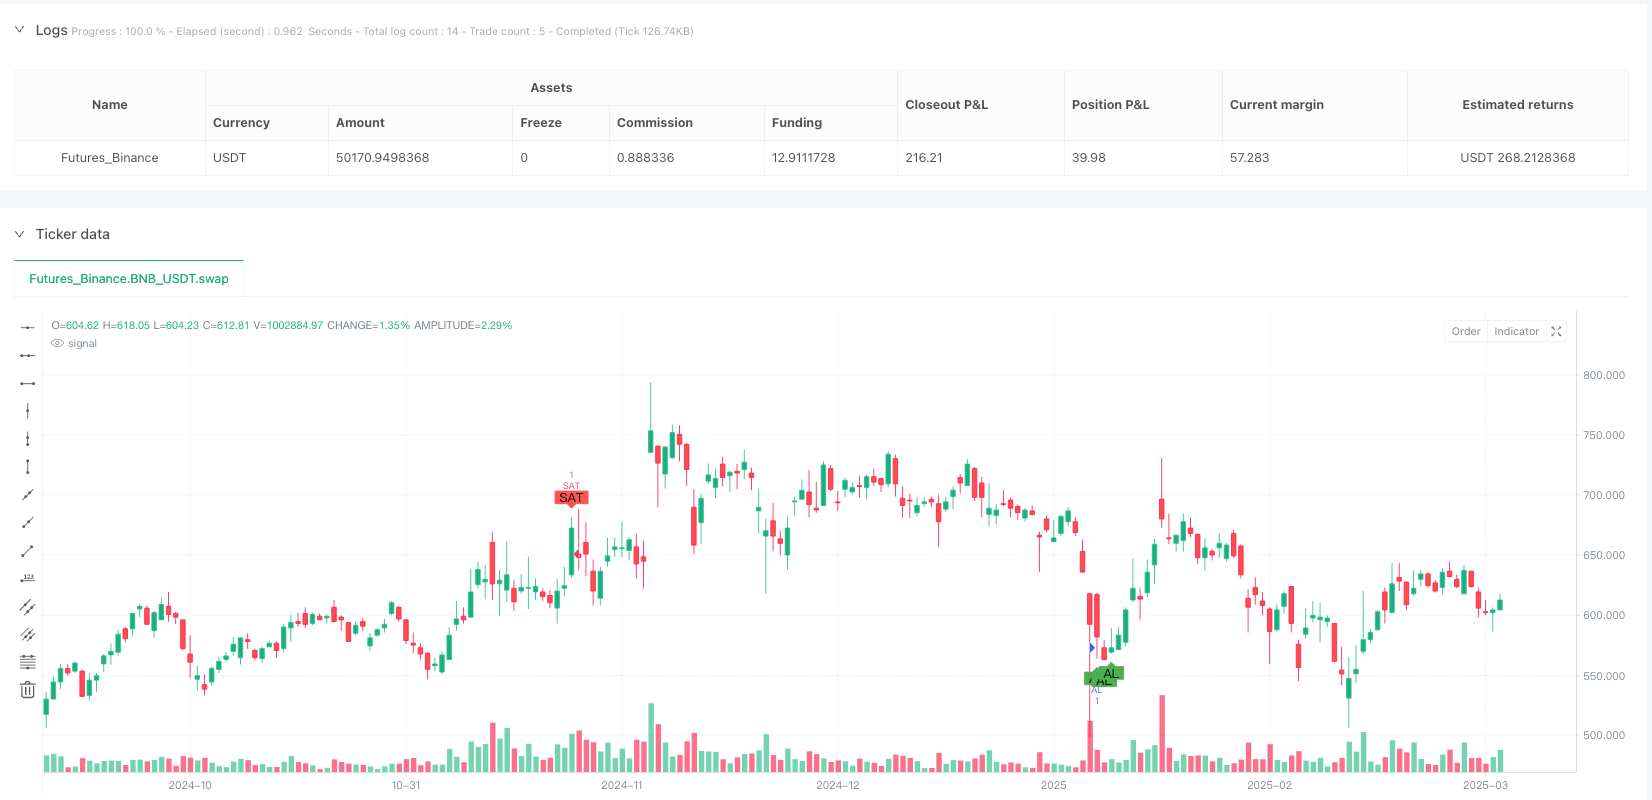
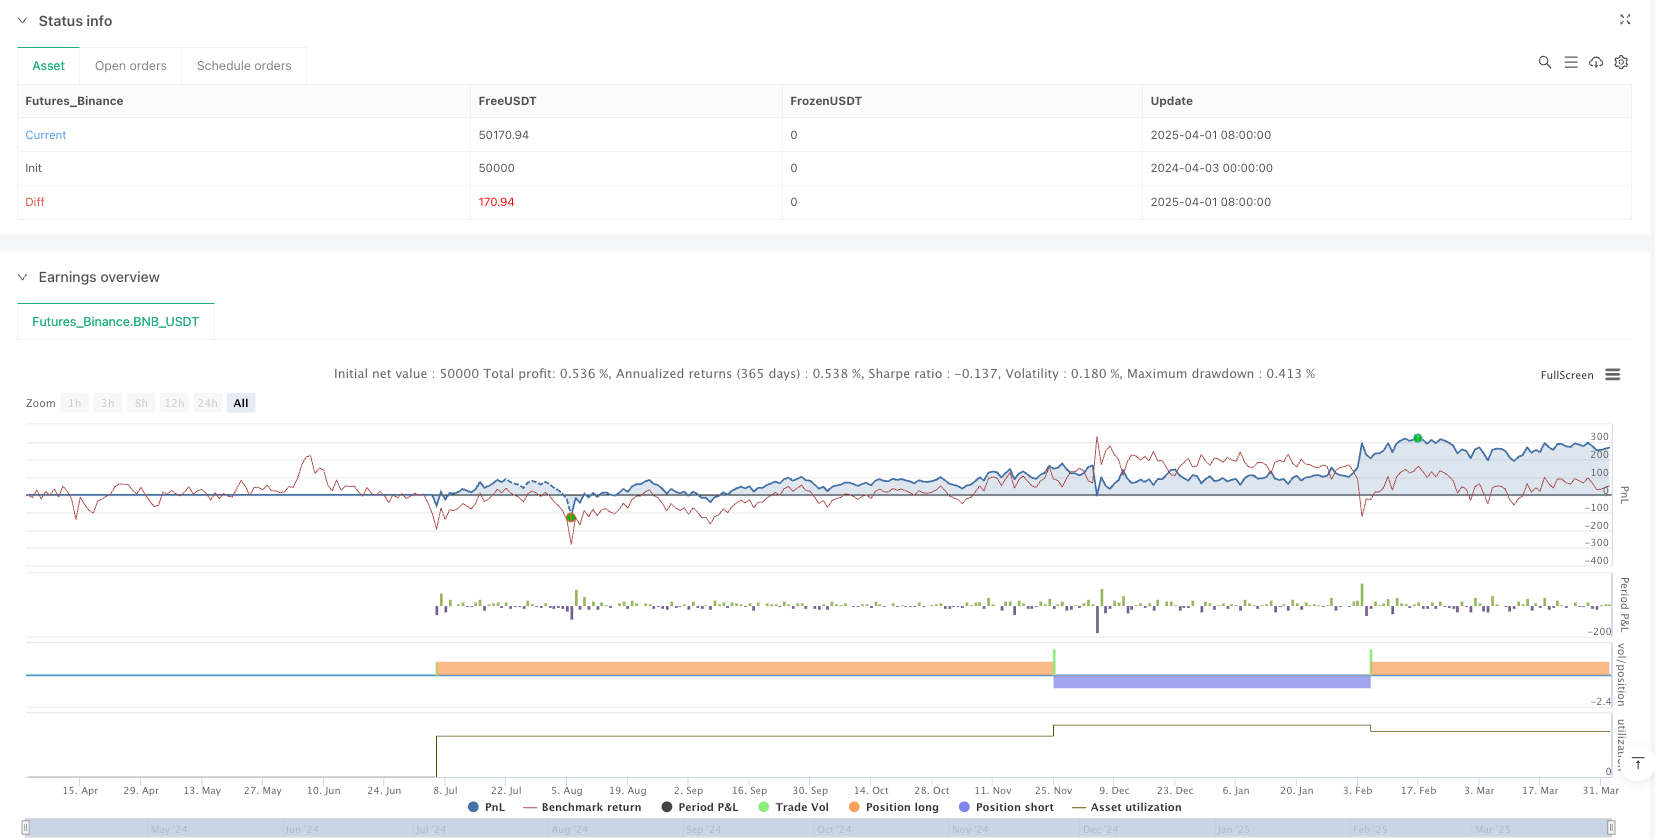
[trans]
概述
多维趋势动量价值过滤交易策略是一种结合多种技术指标的量化交易策略,旨在通过多维分析确定市场的强劲趋势和关键的买入/卖出机会。该策略主要依靠ADX、RSI、随机RSI以及VWAP四个核心指标,通过指标间的协同确认来过滤市场噪音,只选取具有高概率成功的交易信号。策略设计遵循"多重确认"原则,即至少三个条件同时满足才会触发交易信号,这大大提高了交易的准确性和可靠性。
策略原理
该策略的核心原理基于多维分析框架,整合了趋势强度、动量和价值评估三个维度:
-
趋势强度评估:使用平均定向指数(ADX)确认市场是否处于明确趋势中。ADX大于25被视为强趋势存在的信号,这是策略的基础过滤器。
-
动量指标分析:
- 相对强弱指标(RSI)用于识别超卖(低于30)和超买(高于70)状态
- 随机RSI进一步检测动量变化,超卖区域(低于20)和超买区域(高于80)被用作信号确认
-
价值过滤:
- 成交量加权平均价格(VWAP)作为价值参考
- 买入条件要求价格低于VWAP(潜在低估)
- 卖出条件要求价格高于VWAP(潜在高估)
交易信号的具体触发条件如下:
- 买入信号:ADX > 25 AND RSI < 30 AND 随机RSI < 20 AND 收盘价 < VWAP
- 卖出信号:ADX > 25 AND RSI > 70 AND 随机RSI > 80 AND 收盘价 > VWAP
策略采用手动ADX计算方法,通过比较上涨幅度和下跌幅度来计算+DI和-DI,然后进一步计算ADX值,这为策略提供了更精细的趋势强度测量。
策略优势
该策略展现出多项显著优势:
-
多维确认系统:通过整合多个不同类型的指标(趋势、动量和价值),策略能够从不同角度验证交易信号,大幅减少假信号。
-
强趋势识别能力:ADX的使用确保策略仅在明确趋势存在时进行交易,避免了震荡市场中的频繁交易。
-
良好的风险管理:通过动量指标的极值(超买/超卖)作为信号条件,策略能够捕捉到潜在的反转点,提高了入场和出场的时机精确度。
-
价值评估整合:VWAP的加入为策略提供了价格与交易量的关系视角,帮助确认价格是否已偏离合理价值区域。
-
灵活的时间框架适应性:虽然代码注释建议使用15分钟图表,但该策略的核心逻辑适用于多种时间周期,可根据交易需求调整。
-
代码简洁高效:策略实现代码结构清晰,逻辑紧凑,计算效率高,便于理解和维护。
策略风险
尽管该策略具有多项优势,但仍存在以下风险需要关注:
-
过度优化风险:策略使用多个指标的特定阈值(如ADX > 25,RSI < 30等),这些参数可能存在过度优化的风险,在不同市场环境中可能需要调整。
-
信号滞后问题:所有使用的技术指标本质上都是滞后指标,可能导致入场和出场时机略有延迟,尤其在快速变动的市场中更为明显。
-
趋势反转不及时:对ADX的依赖可能导致在趋势即将结束但ADX仍然高于阈值时产生错误信号。
-
缺乏止损机制:当前策略实现中未包含明确的止损设置,这可能在市场突发变化时增加风险敞口。
-
指标冲突:在某些市场条件下,不同指标可能给出相互矛盾的信号,需要额外的判断机制。
-
回撤控制不足:策略主要关注入场条件,但对持仓期间的风险控制机制较少,可能导致已获利润回吐。
优化方向
针对上述风险,策略可以从以下几个方向进行优化:
-
引入自适应参数:将固定的阈值(如ADX > 25)替换为基于市场波动性自动调整的动态阈值,提高策略对不同市场环境的适应性。
-
增加止损机制:引入ATR(平均真实波幅)基础上的止损设置,为每笔交易设定明确的风险限制。
-
时间过滤器:加入时间过滤条件,避开市场开盘和收盘前的高波动期间,或者特定的经济数据发布时段。
-
趋势确认强化:结合移动平均线系统(如EMA交叉或者MACD)作为额外的趋势确认,减少假突破。
-
部分获利机制:实施分批平仓策略,在达到一定盈利目标时平掉部分仓位,既锁定利润又保留上涨空间。
-
交易量确认:加入交易量分析组件,确保信号出现时有足够的交易量支持,提高信号的可靠性。
-
波动率过滤:在低波动率环境下调整策略参数或暂停交易,因为多指标策略在低波动环境中容易产生噪音。
总结
多维趋势动量价值过滤交易策略通过整合ADX、RSI、随机RSI和VWAP等指标,构建了一个全面的交易决策系统,能够有效识别强劲趋势下的关键交易机会。策略的核心价值在于其多重确认机制,通过不同维度的市场分析交叉验证交易信号,显著提高了信号质量。
该策略特别适合中等波动性的市场环境,尤其是在明确趋势建立后的交易。在实际应用中,交易者可以根据具体的市场特性和风险承受能力,调整指标参数和确认条件的严格程度,以达到最佳的风险回报比。
通过引入本文提出的优化建议,特别是自适应参数系统和完善的风险管理机制,该策略可以进一步提升其稳健性和长期盈利能力。对于寻求技术分析驱动交易系统的量化交易者而言,本策略提供了一个结构化且可扩展的框架,值得在实际交易中尝试应用和进一步定制开发。 ||
Overview
The Multi-Dimensional Trend Momentum Value Filtering Trading Strategy is a quantitative trading approach that combines multiple technical indicators to identify strong trend-based entry and exit opportunities. This strategy relies on four core indicators: ADX, RSI, Stochastic RSI, and VWAP, using their collaborative confirmation to filter out market noise and select only high-probability trading signals. The strategy follows a "multiple confirmation" principle, requiring at least three conditions to be simultaneously satisfied before triggering a trade signal, which significantly enhances the accuracy and reliability of trades.
Strategy Principles
The core principle of this strategy is based on a multi-dimensional analysis framework, integrating three dimensions: trend strength, momentum, and value assessment:
-
Trend Strength Evaluation: Uses Average Directional Index (ADX) to confirm whether the market is in a defined trend. ADX greater than 25 is considered a signal of strong trend presence, serving as the base filter for the strategy.
-
Momentum Indicator Analysis:
- Relative Strength Index (RSI) identifies oversold (below 30) and overbought (above 70) conditions
- Stochastic RSI further detects momentum shifts, with oversold (below 20) and overbought (above 80) zones used for signal confirmation
-
Value Filtering:
- Volume Weighted Average Price (VWAP) serves as a value reference
- Buy conditions require price below VWAP (potentially undervalued)
- Sell conditions require price above VWAP (potentially overvalued)
The specific trigger conditions for trading signals are:
- Buy Signal: ADX > 25 AND RSI < 30 AND Stochastic RSI < 20 AND Close < VWAP
- Sell Signal: ADX > 25 AND RSI > 70 AND Stochastic RSI > 80 AND Close > VWAP
The strategy employs a manual ADX calculation method, comparing upward and downward movements to calculate +DI and -DI, then further calculating the ADX value, providing a more refined measurement of trend strength.
Strategy Advantages
This strategy demonstrates several significant advantages:
-
Multi-Dimensional Confirmation System: By integrating multiple indicators of different types (trend, momentum, and value), the strategy can verify trading signals from different angles, greatly reducing false signals.
-
Strong Trend Identification Capability: The use of ADX ensures the strategy only trades when clear trends exist, avoiding frequent trading in oscillating markets.
-
Sound Risk Management: By using extreme momentum indicator values (overbought/oversold) as signal conditions, the strategy can capture potential reversal points, improving the precision of entry and exit timing.
-
Value Assessment Integration: The inclusion of VWAP provides the strategy with a perspective on the relationship between price and trading volume, helping to confirm whether the price has deviated from reasonable value zones.
-
Flexible Timeframe Adaptability: Although the code comments suggest using 15-minute charts, the core logic of the strategy is applicable to multiple time periods and can be adjusted according to trading requirements.
-
Clean and Efficient Code: The strategy implementation code is clearly structured, logically compact, and computationally efficient, making it easy to understand and maintain.
Strategy Risks
Despite its numerous advantages, the strategy still has the following risks that need attention:
-
Over-Optimization Risk: The strategy uses specific thresholds for multiple indicators (such as ADX > 25, RSI < 30, etc.), which may be subject to over-optimization risk and might need adjustment in different market environments.
-
Signal Lag Issues: All technical indicators used are inherently lagging indicators, which may lead to slightly delayed entry and exit timing, especially in rapidly changing markets.
-
Delayed Trend Reversal Recognition: Dependence on ADX may lead to false signals when a trend is about to end but ADX is still above the threshold.
-
Lack of Stop-Loss Mechanism: The current strategy implementation does not include explicit stop-loss settings, which may increase risk exposure during sudden market changes.
-
Indicator Conflicts: Under certain market conditions, different indicators may give contradictory signals, requiring additional judgment mechanisms.
-
Insufficient Drawdown Control: The strategy mainly focuses on entry conditions but has fewer risk control mechanisms during the holding period, which may lead to giving back previously earned profits.
Optimization Directions
In response to the above risks, the strategy can be optimized in the following directions:
-
Introduce Adaptive Parameters: Replace fixed thresholds (such as ADX > 25) with dynamic thresholds that automatically adjust based on market volatility, improving the strategy's adaptability to different market environments.
-
Add Stop-Loss Mechanism: Introduce ATR (Average True Range) based stop-loss settings to establish clear risk limits for each trade.
-
Time Filter: Add time filtering conditions to avoid high volatility periods at market open and close, or specific economic data release periods.
-
Trend Confirmation Enhancement: Combine moving average systems (such as EMA crossover or MACD) as additional trend confirmation to reduce false breakouts.
-
Partial Profit-Taking Mechanism: Implement a staged position-closing strategy, closing part of the position when certain profit targets are reached, both securing profits and retaining upside potential.
-
Volume Confirmation: Add a volume analysis component to ensure sufficient trading volume supports signals, improving signal reliability.
-
Volatility Filter: Adjust strategy parameters or pause trading in low volatility environments, as multi-indicator strategies tend to generate noise in low volatility environments.
Summary
The Multi-Dimensional Trend Momentum Value Filtering Trading Strategy integrates indicators like ADX, RSI, Stochastic RSI, and VWAP to build a comprehensive trading decision system capable of effectively identifying key trading opportunities in strong trends. The core value of the strategy lies in its multiple confirmation mechanism, cross-validating trading signals through different dimensions of market analysis, significantly improving signal quality.
This strategy is particularly suitable for market environments with moderate volatility, especially for trading after clear trends have been established. In practical application, traders can adjust indicator parameters and the strictness of confirmation conditions according to specific market characteristics and risk tolerance to achieve the optimal risk-reward ratio.
By introducing the optimization suggestions proposed in this article, especially adaptive parameter systems and comprehensive risk management mechanisms, this strategy can further enhance its robustness and long-term profitability. For quantitative traders seeking technically-driven trading systems, this strategy provides a structured and extensible framework worth trying in actual trading and further customization.[/trans]
Source (PineScript)
/*backtest
start: 2024-04-03 00:00:00
end: 2025-04-02 00:00:00
period: 1d
basePeriod: 1d
exchanges: [{"eid":"Futures_Binance","currency":"BNB_USDT"}]
*/

//@version=5
strategy("BuySell Strategy OD", overlay=true)

// === INPUTS === //
rsiPeriod   = input.int(14, "RSI Period")
stochPeriod = input.int(14, "Stoch RSI Period")
adxPeriod   = input.int(14, "ADX Period")

// === INDICATORS === //

// RSI
rsi = ta.rsi(close, rsiPeriod)

// Stoch RSI
rsiMin = ta.lowest(rsi, stochPeriod)
rsiMax = ta.highest(rsi, stochPeriod)
stochRsi = rsiMax != rsiMin ? (rsi - rsiMin) / (rsiMax - rsiMin) * 100 : 0

// ADX (manual calculation)
upMove   = high - high[1]
downMove = low[1] - low
plusDM   = (upMove > downMove and upMove > 0) ? upMove : 0
minusDM  = (downMove > upMove and downMove > 0) ? downMove : 0

tr = math.max(math.max(high - low, high - close[1]), low - close[1])
atr = ta.rma(tr, adxPeriod)

plusDI = 100 * ta.rma(plusDM, adxPeriod) / atr
minusDI = 100 * ta.rma(minusDM, adxPeriod) / atr
dx = 100 * ((plusDI - minusDI) >= 0 ? (plusDI - minusDI) : (minusDI - plusDI)) / (plusDI + minusDI)
adx = ta.rma(dx, adxPeriod)

// VWAP
vwap = ta.vwap(hlc3)

// === BUY CONDITION === //
buyCond = (adx > 25) and (rsi < 30) and (stochRsi < 20) and (close < vwap)

// === SELL CONDITION === //
sellCond = (adx > 25) and (rsi > 70) and (stochRsi > 80) and (close > vwap)

// === PLOTS === //
plotshape(buyCond, title="BUY", location=location.belowbar, color=color.green, style=shape.labelup, text="BUY")
plotshape(sellCond, title="SELL", location=location.abovebar, color=color.red, style=shape.labeldown, text="SELL")

// === STRATEGY ORDERS === //
if buyCond
    strategy.entry("BUY", strategy.long)

if sellCond
    strategy.entry("SELL", strategy.short)
Detail
https://www.fmz.com/strategy/489286
Last Modified
2025-04-03 15:16:18