
19 KiB
Name
多维度量化交易系统高级VSA-MACD-FVG策略分析与优化框架-Advanced-Quantitative-Trading-System-VSA-MACD-FVG-Strategy-Analysis-and-Optimization-Framework
Author
ianzeng123
Strategy Description
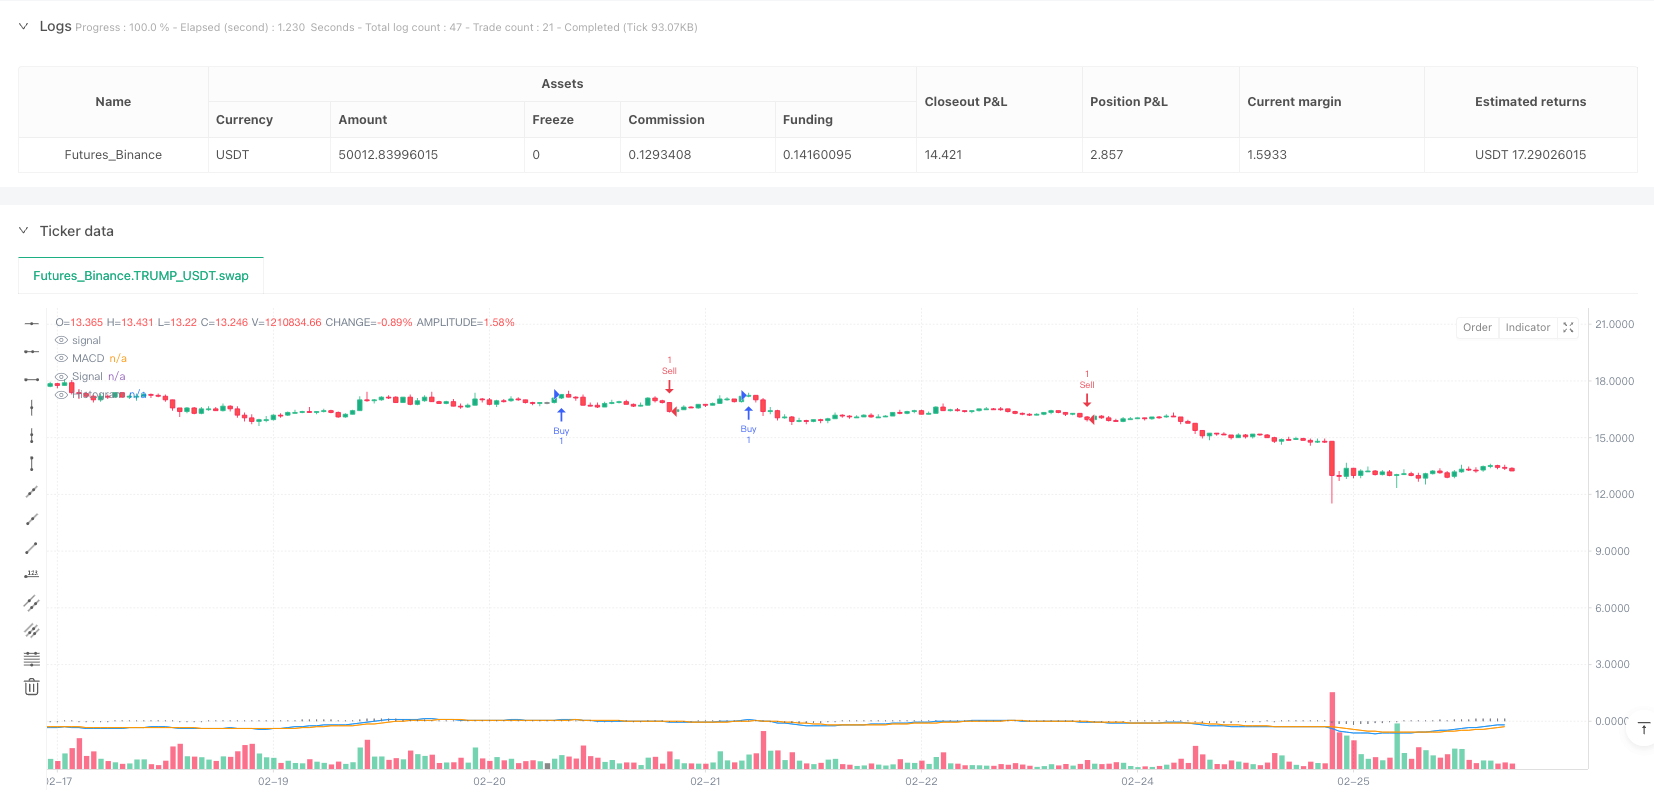
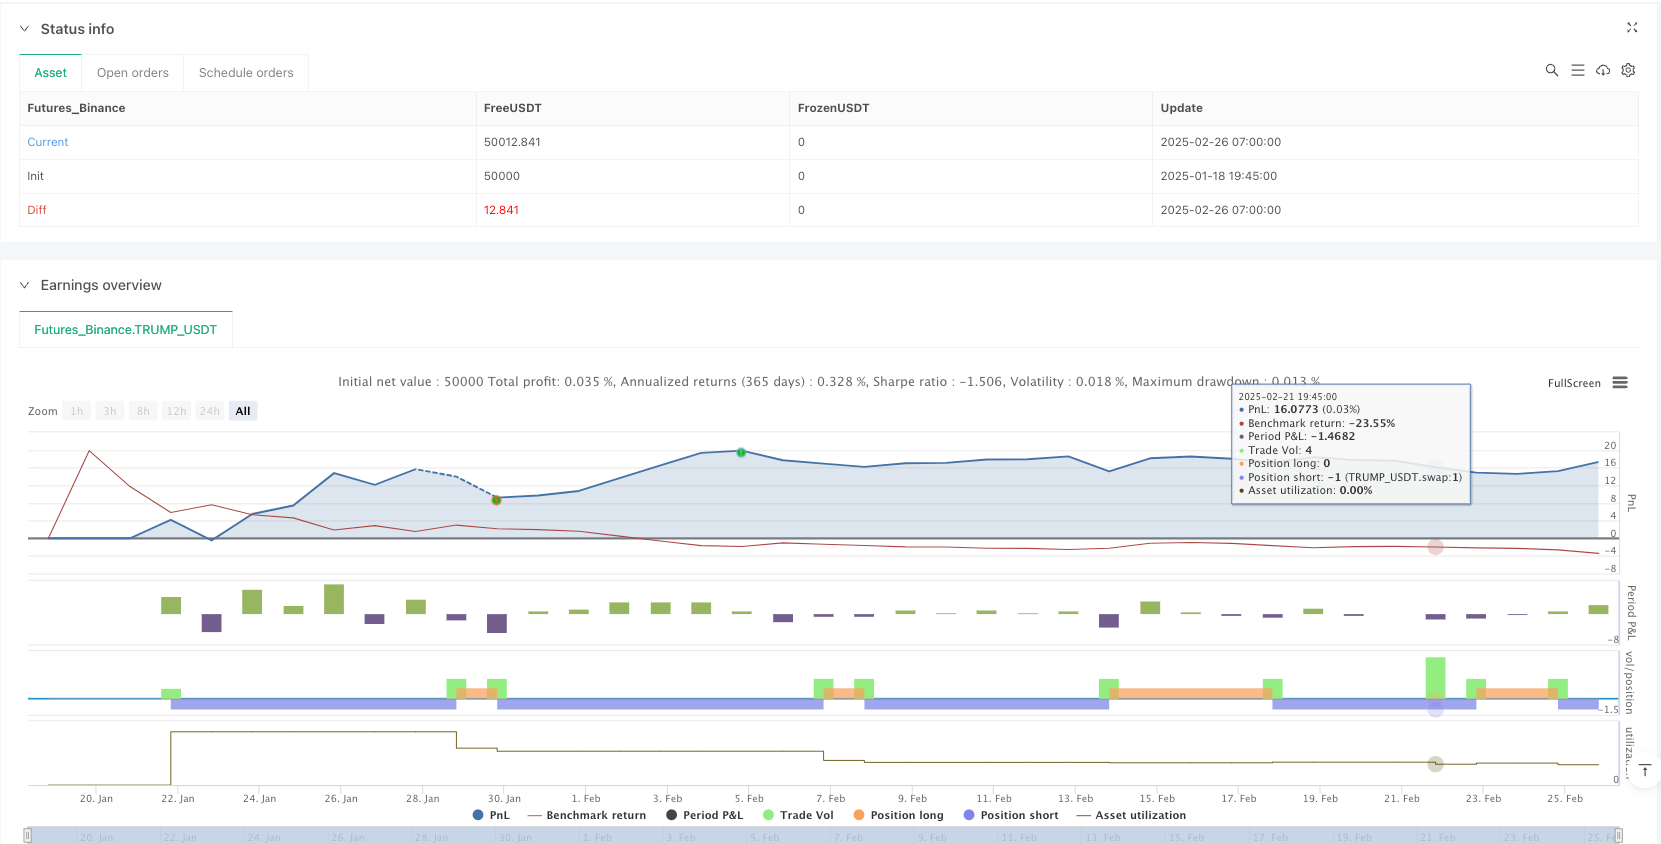
[trans]
概述
这是一个结合了成交量价格分析(VSA)、移动平均线收敛发散指标(MACD)和公允价值缺口(FVG)三大技术分析方法的量化交易策略。该策略使用多维度技术指标来确认交易信号,并通过FVG区域识别潜在的价格不平衡区域,旨在捕捉市场中强势波动的交易机会。策略通过综合考量价格动量、交易量异常以及价格结构缺口来提高交易准确性,同时通过视觉化界面增强交易判断的直观性。
策略原理
该策略的核心原理基于三个独立但相互关联的交易理念:
-
MACD指标分析: 策略使用12、26和9作为参数计算MACD指标。当MACD线(快线)位于信号线(慢线)上方且为正值时,被判定为看涨信号;反之,当MACD线位于信号线下方且为负值时,被判定为看跌信号。这一组件主要用于确认市场动量方向。
-
VSA(成交量价格分析): 策略检测价格和成交量之间的关系。当收盘价高于开盘价、当前成交量大于20天成交量均值、并且收盘价突破前5个周期最高价时,产生看涨VSA信号;反之,当收盘价低于开盘价、当前成交量大于20天成交量均值、并且收盘价突破前5个周期最低价时,产生看跌VSA信号。这一组件主要捕捉由大额交易驱动的突破行为。
-
FVG(公允价值缺口)识别: 策略检测市场中存在的价格缺口。当当前蜡烛的最低价高于前两个蜡烛的最高价且前一蜡烛为阳线时,识别为上行FVG;当当前蜡烛的最高价低于前两个蜡烛的最低价且前一蜡烛为阴线时,识别为下行FVG。FVG被视为市场中的不平衡区域,价格通常会回到这些区域。
交易信号的生成需要所有三个条件同时满足:
- 买入信号: VSA看涨 + MACD看涨 + 价格在FVG区域内 + 当前无多头持仓
- 卖出信号: VSA看跌 + MACD看跌 + 价格在FVG区域内 + 当前无空头持仓
策略还通过矩形框视觉化展示FVG区域,并在产生交易信号时添加标签,以增强交易决策的直观性。
策略优势
-
多维度确认机制: 结合技术指标(MACD)、成交量分析(VSA)和价格结构分析(FVG)三个独立维度来确认交易信号,显著降低了假信号风险,提高了交易精确度。
-
市场不平衡捕捉: FVG组件能够有效识别市场中的价格不平衡区域,这些区域通常代表了机构快速进出市场留下的"价值真空",提供了高概率的交易机会。
-
成交量确认: 通过VSA分析,确保交易信号背后有足够的交易量支撑,避免在低流动性环境下交易,减少滑点和假突破的风险。
-
视觉化辅助决策: 策略通过FVG矩形框和交易信号标签,直观展示了潜在交易区域和入场点,帮助交易者更清晰地理解市场结构和交易逻辑。
-
避免过度交易: 策略的多重条件过滤机制确保只在满足严格条件时才生成交易信号,有效减少了过度交易的问题。
-
灵活的参数控制: 代码设计允许用户调整关键参数,包括MACD参数、VSA的成交量阈值和历史价格参考周期,以及FVG区域的视觉表现,使策略能够适应不同市场环境和个人交易风格。
策略风险
-
信号滞后性: MACD是一个滞后指标,在快速变化的市场中可能导致入场较晚,错过最佳价格点位。解决方法是考虑引入更敏感的早期预警指标,如RSI或随机指标,作为补充。
-
高波动期间的假信号: 在市场高波动期间,VSA组件可能因大量但无方向性的成交量而产生错误信号。建议增加市场波动率过滤器,在波动率异常高时提高信号确认标准。
-
FVG识别的局限性: 当前FVG识别仅考虑了固定的两个周期间隔,这可能无法适应所有市场状况。应考虑动态调整FVG识别的时间窗口,或引入多时间框架FVG确认。
-
止损缺失: 当前策略没有明确的止损机制,在趋势突然逆转时可能导致重大损失。建议实现基于ATR或关键支撑/阻力位的止损策略。
-
市场状态适应性不足: 策略未区分趋势市场和震荡市场,可能在不适合的市场环境中生成过多交易信号。应考虑增加市场状态识别组件,在不同市场状态下应用不同的交易参数或逻辑。
-
资金管理薄弱: 当前策略使用固定仓位进行交易,没有考虑风险调整。建议实现基于波动率的仓位大小调整机制,以优化资金效率和风险管控。
策略优化方向
-
多时间框架分析整合: 当前策略仅在单一时间框架内运行,可以通过整合更高时间框架的趋势确认来提高交易质量。实现方法是使用security函数获取更高时间框架的MACD和VSA信号,只在与更高时间框架趋势一致时才入场。这将减少逆趋势交易,显著提高胜率。
-
自适应参数优化: 将MACD和VSA的固定参数改为基于市场波动性自动调整的参数。例如,在高波动市场中延长MACD周期以减少噪音,在低波动市场中缩短周期以增加敏感度。这种优化可以通过计算近期ATR并据此调整参数来实现。
-
FVG失效时间设定: 当前FVG一旦形成就保持有效,但实际上FVG应有时效性。建议添加FVG失效机制,例如在特定K线数量后或价格远离FVG区域一定百分比后使FVG失效。这可以减少基于过时FVG的错误交易。
-
整合订单流分析: VSA分析可以通过整合更详细的订单流数据(如大单比例、买卖压力等)来增强。虽然这需要额外的数据源,但可以显著提高成交量分析的准确性。
-
风险管理架构: 添加完整的风险管理系统,包括:
- 基于ATR的动态止损
- 分级获利策略(部分仓位在不同目标价位平仓)
- 基于账户风险百分比的仓位大小计算
- 日亏损限制和连续亏损后的自动降低交易频率机制
-
机器学习优化: 考虑使用简单的机器学习模型来预测FVG区域的有效性。通过历史数据训练模型,识别哪些特征组合下的FVG更可能被回补,从而提高FVG交易的成功率。
总结
VSA-MACD-FVG策略是一个多维度交易系统,通过结合技术动量指标、成交量分析和价格结构分析来识别高概率交易机会。该策略的主要优势在于多因素确认机制,能有效过滤假信号;而主要风险来自于参数固定导致的市场适应性不足以及风险管理体系的缺失。
通过实施建议的优化方向,尤其是多时间框架分析、自适应参数和完善的风险管理系统,该策略有潜力成为一个更加稳健的交易系统。最重要的是,策略应该根据特定的交易风格和目标市场进行个性化调整,并在实盘应用前进行全面的回测验证。
该策略特别适合中长期交易者,尤其是那些关注市场结构和大资金流动的交易者。通过精细调整和补充必要的风险控制措施,它可以在多种市场环境中保持相对稳定的表现。||
Overview
This is a quantitative trading strategy that combines Volume Spread Analysis (VSA), Moving Average Convergence Divergence (MACD), and Fair Value Gap (FVG) technical analysis methods. The strategy utilizes multi-dimensional technical indicators to confirm trading signals and identifies potential price imbalance areas through FVG zones, aiming to capture strong market movement opportunities. By comprehensively considering price momentum, volume anomalies, and price structure gaps, the strategy enhances trading accuracy while providing visual interfaces to improve trading judgment intuitiveness.
Strategy Principles
The core principles of this strategy are based on three independent but interconnected trading concepts:
-
MACD Indicator Analysis: The strategy uses parameters 12, 26, and 9 to calculate the MACD indicator. When the MACD line (fast line) is above the signal line (slow line) and has a positive value, it is identified as a bullish signal; conversely, when the MACD line is below the signal line and has a negative value, it is identified as a bearish signal. This component primarily confirms market momentum direction.
-
VSA (Volume Spread Analysis): The strategy detects relationships between price and volume. A bullish VSA signal is generated when the closing price is higher than the opening price, current volume exceeds the 20-day volume average, and the closing price breaks through the highest price of the previous 5 periods. Conversely, a bearish VSA signal is generated when the closing price is lower than the opening price, current volume exceeds the 20-day volume average, and the closing price breaks through the lowest price of the previous 5 periods. This component mainly captures breakout behaviors driven by large transactions.
-
FVG (Fair Value Gap) Identification: The strategy detects price gaps in the market. An upward FVG is identified when the current candle's low price is higher than the high price of the candle from two periods ago, and the previous candle is bullish. A downward FVG is identified when the current candle's high price is lower than the low price of the candle from two periods ago, and the previous candle is bearish. FVGs are viewed as imbalance areas in the market where prices typically return.
The generation of trading signals requires all three conditions to be met simultaneously:
- Buy signal: Bullish VSA + Bullish MACD + Price within FVG area + No current long position
- Sell signal: Bearish VSA + Bearish MACD + Price within FVG area + No current short position
The strategy also visually displays FVG areas through rectangular boxes and adds labels when trading signals are generated, enhancing the intuitiveness of trading decisions.
Strategy Advantages
-
Multi-dimensional Confirmation Mechanism: By combining technical indicators (MACD), volume analysis (VSA), and price structure analysis (FVG) from three independent dimensions to confirm trading signals, the strategy significantly reduces the risk of false signals and improves trading precision.
-
Market Imbalance Capture: The FVG component effectively identifies price imbalance areas in the market, which typically represent "value vacuums" left by institutions rapidly entering or exiting the market, providing high-probability trading opportunities.
-
Volume Confirmation: Through VSA analysis, the strategy ensures that there is sufficient volume supporting the trading signals, avoiding trading in low liquidity environments and reducing the risks of slippage and false breakouts.
-
Visual Decision Support: The strategy intuitively displays potential trading areas and entry points through FVG rectangular boxes and trading signal labels, helping traders better understand market structure and trading logic.
-
Prevention of Overtrading: The strategy's multiple condition filtering mechanism ensures that trading signals are only generated when strict conditions are met, effectively reducing the problem of overtrading.
-
Flexible Parameter Control: The code design allows users to adjust key parameters, including MACD parameters, VSA volume thresholds and historical price reference periods, as well as the visual appearance of FVG areas, enabling the strategy to adapt to different market environments and personal trading styles.
Strategy Risks
-
Signal Lag: MACD is a lagging indicator that may lead to late entries in rapidly changing markets, missing optimal price points. The solution is to consider introducing more sensitive early warning indicators, such as RSI or stochastic indicators, as supplements.
-
False Signals During High Volatility: During periods of high market volatility, the VSA component may generate incorrect signals due to large but non-directional volume. It is recommended to add a market volatility filter that raises signal confirmation standards when volatility is abnormally high.
-
Limitations of FVG Identification: The current FVG identification only considers a fixed two-period interval, which may not be suitable for all market conditions. Consider dynamically adjusting the time window for FVG identification or introducing multi-timeframe FVG confirmation.
-
Lack of Stop Loss: The current strategy does not have an explicit stop-loss mechanism, which could lead to significant losses when trends suddenly reverse. Implementation of stop-loss strategies based on ATR or key support/resistance levels is recommended.
-
Insufficient Market State Adaptability: The strategy does not distinguish between trending markets and oscillating markets, potentially generating too many trading signals in unsuitable market environments. Consider adding a market state identification component to apply different trading parameters or logic in different market states.
-
Weak Money Management: The current strategy uses fixed position sizing for trading without considering risk adjustment. Implementation of a volatility-based position sizing mechanism is recommended to optimize capital efficiency and risk control.
Strategy Optimization Directions
-
Multi-timeframe Analysis Integration: The current strategy only operates within a single timeframe. Trading quality can be improved by integrating trend confirmation from higher timeframes. This can be implemented by using the security function to obtain MACD and VSA signals from higher timeframes, only entering trades when aligned with higher timeframe trends. This will reduce counter-trend trading and significantly improve win rates.
-
Adaptive Parameter Optimization: Replace the fixed parameters of MACD and VSA with parameters that automatically adjust based on market volatility. For example, extend MACD periods in high-volatility markets to reduce noise, and shorten periods in low-volatility markets to increase sensitivity. This optimization can be implemented by calculating recent ATR and adjusting parameters accordingly.
-
FVG Expiration Time Setting: Currently, once an FVG forms, it remains valid indefinitely, but in reality, FVGs should have a time limit. It is recommended to add an FVG expiration mechanism, such as making the FVG invalid after a specific number of candles or when the price moves away from the FVG area by a certain percentage. This can reduce erroneous trades based on outdated FVGs.
-
Integration of Order Flow Analysis: VSA analysis can be enhanced by integrating more detailed order flow data (such as large order ratios, buying/selling pressure, etc.). While this requires additional data sources, it can significantly improve the accuracy of volume analysis.
-
Risk Management Framework: Add a complete risk management system, including:
- Dynamic stop-loss based on ATR
- Tiered profit-taking strategy (partial position closing at different target prices)
- Position sizing calculation based on account risk percentage
- Daily loss limits and automatic reduction of trading frequency after consecutive losses
-
Machine Learning Optimization: Consider using simple machine learning models to predict the effectiveness of FVG areas. By training models with historical data, identify which feature combinations make FVGs more likely to be filled, thereby improving the success rate of FVG trading.
Summary
The VSA-MACD-FVG strategy is a multi-dimensional trading system that identifies high-probability trading opportunities by combining technical momentum indicators, volume analysis, and price structure analysis. The main advantages of the strategy lie in its multi-factor confirmation mechanism, which effectively filters out false signals; the main risks come from insufficient market adaptability due to fixed parameters and the absence of a risk management system.
By implementing the suggested optimization directions, especially multi-timeframe analysis, adaptive parameters, and a comprehensive risk management system, the strategy has the potential to become a more robust trading system. Most importantly, the strategy should be customized according to specific trading styles and target markets, and undergo comprehensive backtesting verification before live application.
This strategy is particularly suitable for medium to long-term traders, especially those who focus on market structure and large capital flows. With fine-tuning and supplementation of necessary risk control measures, it can maintain relatively stable performance across various market environments.[/trans]
Source (PineScript)
/*backtest
start: 2025-01-18 19:45:00
end: 2025-02-26 08:00:00
period: 1h
basePeriod: 1h
exchanges: [{"eid":"Futures_Binance","currency":"TRUMP_USDT"}]
*/

//@version=5
strategy("VSA_MACD_FVG Strategy", overlay=true)

// === MACD Calculation ===
[macdLine, signalLine, hist] = ta.macd(close, 12, 26, 9)
macdBullish = macdLine > signalLine and macdLine > 0
macdBearish = macdLine < signalLine and macdLine < 0

// === VSA Basic Implementation ===
vsaBullish = close > open and volume > ta.sma(volume, 20) and close > ta.highest(high, 5)[1]
vsaBearish = close < open and volume > ta.sma(volume, 20) and close < ta.lowest(low, 5)[1]

// === FVG (Fair Value Gap) Detection ===
fvgUpCondition = low > high[2] and close[1] > open[1]
fvgDownCondition = high < low[2] and close[1] < open[1]

var float fvgTop = 0.0
var float fvgBottom = 0.0
var bool inFVG = false

// Detect and Store FVG
if fvgUpCondition
    fvgTop := low
    fvgBottom := high[2]
    inFVG := true
else if fvgDownCondition
    fvgTop := low[2]
    fvgBottom := high
    inFVG := true

// Check if price is in FVG
priceInFVG = (high >= fvgBottom and low <= fvgTop)

// === Position Tracking ===
isLongOpen = strategy.position_size > 0
isShortOpen = strategy.position_size < 0

// === Trading Conditions ===
buySignal = vsaBullish and macdBullish and priceInFVG and not isLongOpen
sellSignal = vsaBearish and macdBearish and priceInFVG and not isShortOpen

// === Execute Trades ===
if buySignal
    strategy.entry("Buy", strategy.long)

if sellSignal
    strategy.entry("Sell", strategy.short)

// === Visual Markers ===
if buySignal
    label.new(bar_index, low, "BUY",
              color=color.green,
              textcolor=color.white,
              style=label.style_label_up)

if sellSignal
    label.new(bar_index, high, "SELL",
              color=color.red,
              textcolor=color.white,
              style=label.style_label_down)

// === Plot MACD for reference ===
plot(macdLine, "MACD", color=color.blue)
plot(signalLine, "Signal", color=color.orange)
plot(hist, "Histogram", style=plot.style_histogram, color=color.gray)
Detail
https://www.fmz.com/strategy/484089
Last Modified
2025-02-28 09:39:23