
8.6 KiB
Name
多维度云图价格突破趋势确认量化交易策略-Multi-Dimensional-Ichimoku-Cloud-Price-Breakthrough-Trend-Confirmation-Trading-Strategy
Author
ChaoZhang
Strategy Description
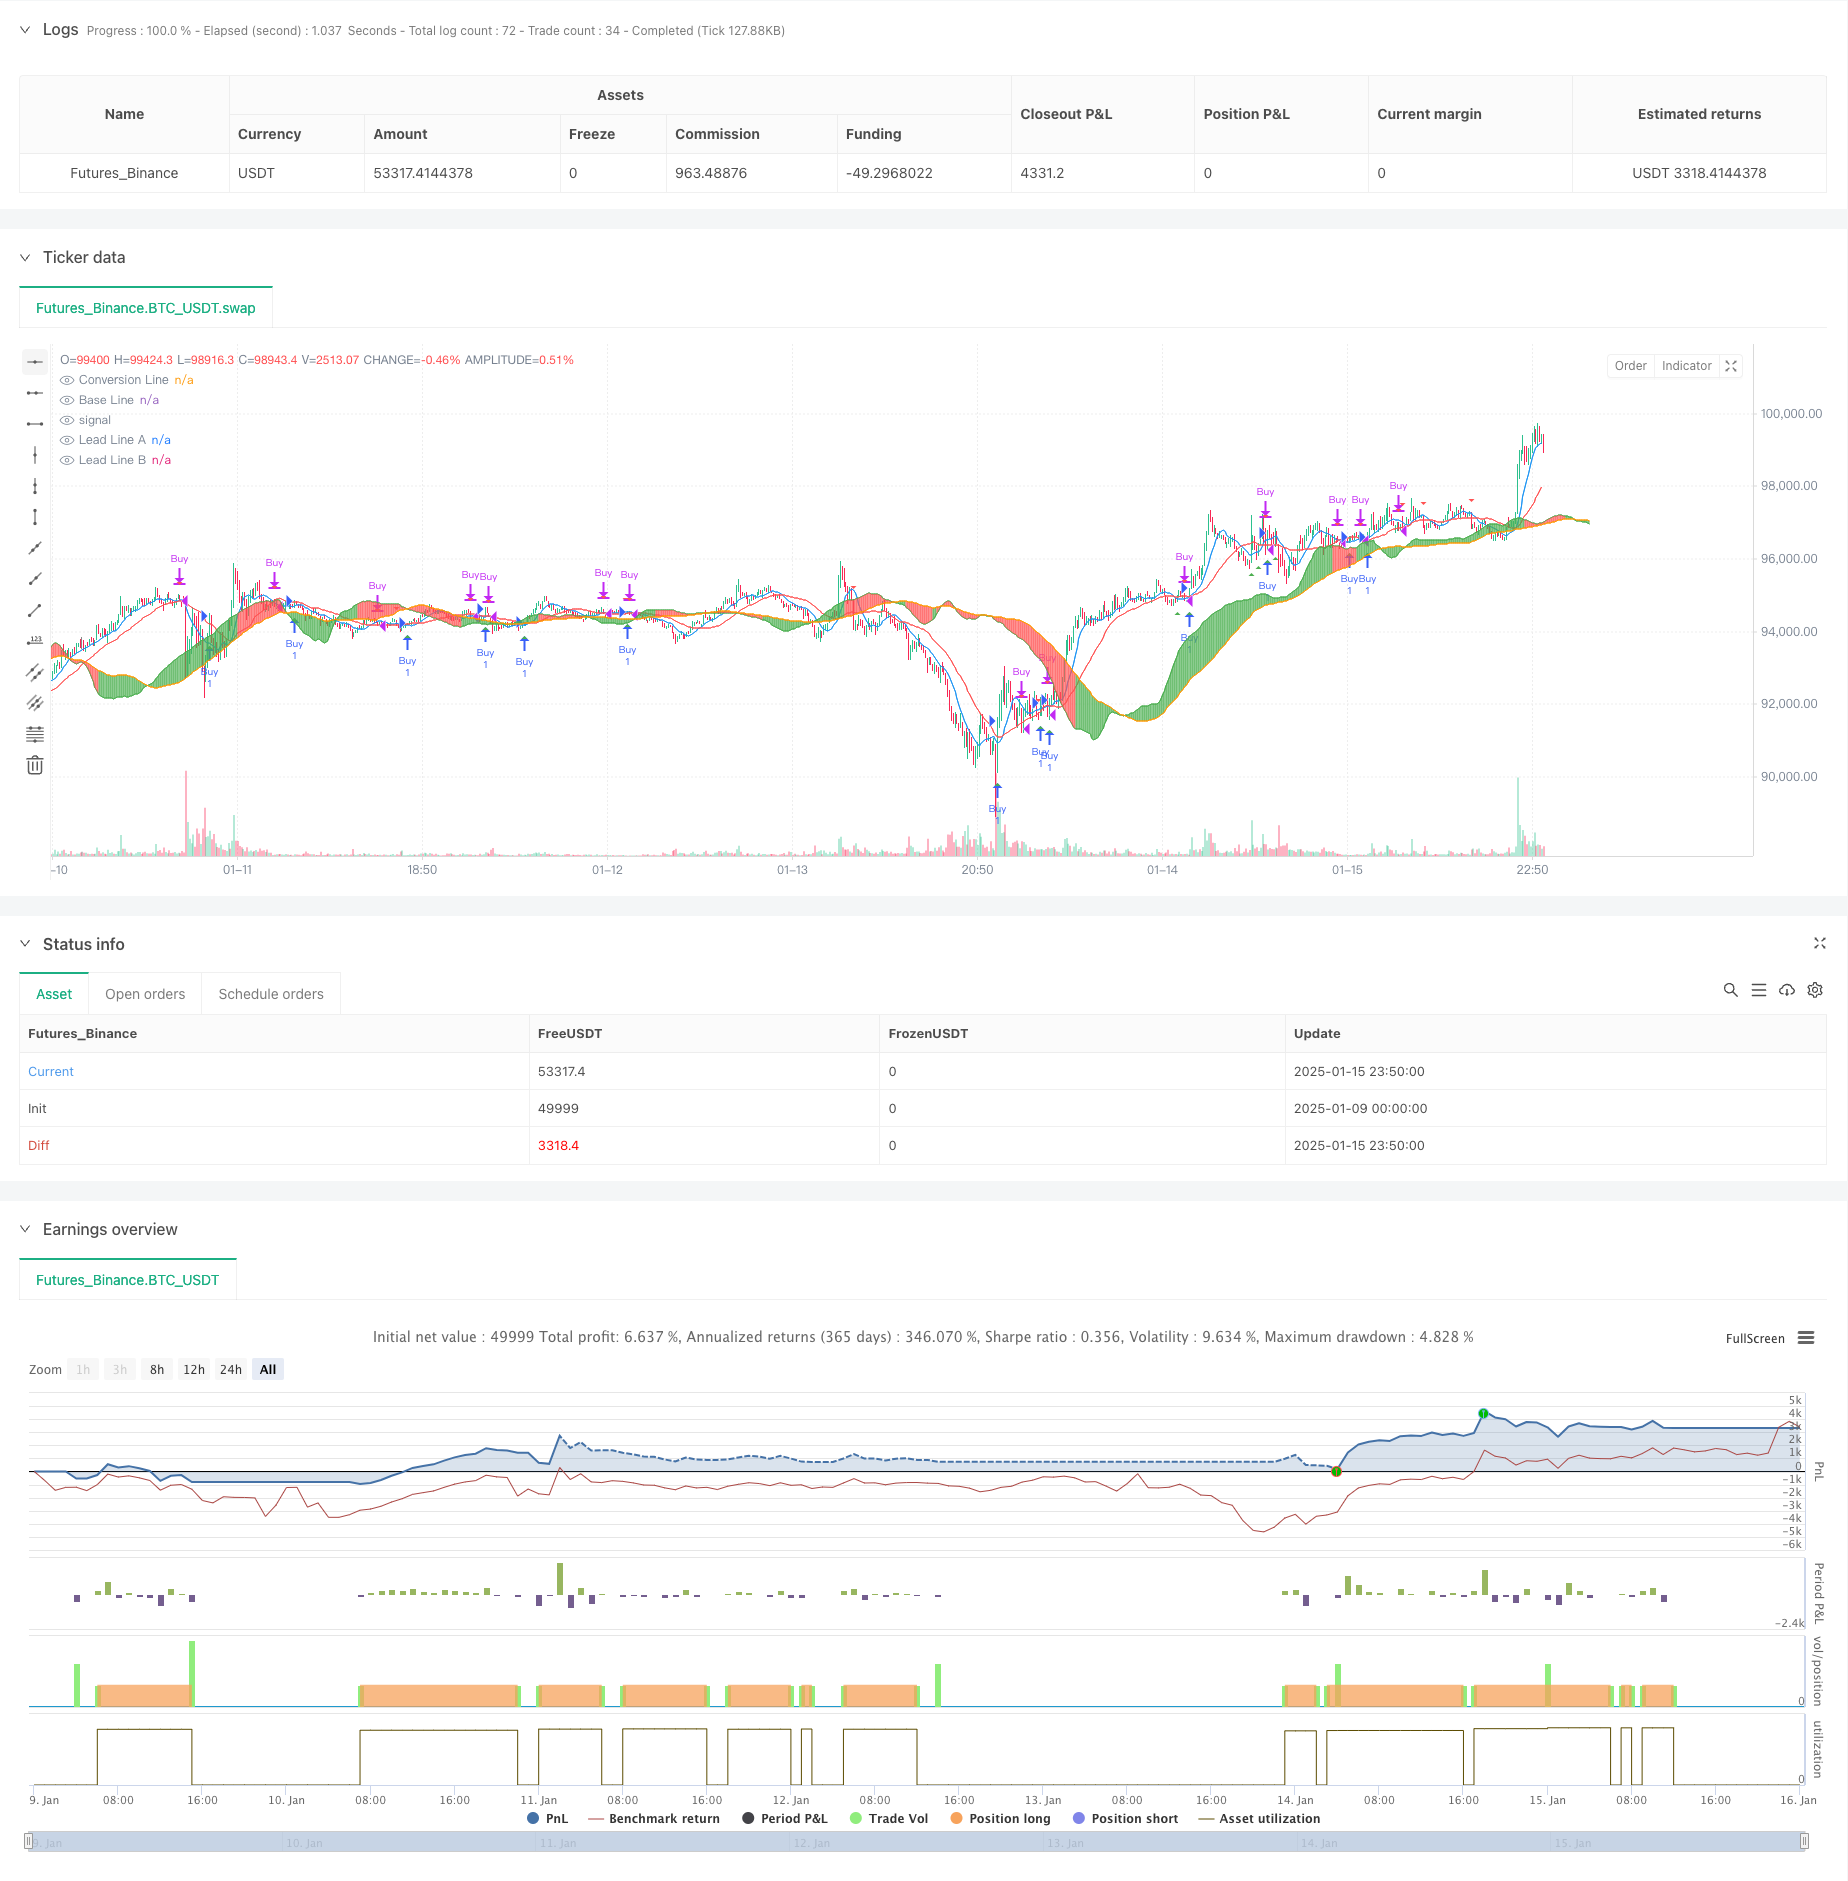
[trans]
概述
该策略是一个基于多维度云图(Ichimoku Cloud)指标的趋势跟踪交易系统。策略通过云图的核心组件交叉来识别市场趋势,并在价格突破关键技术位时产生交易信号。该策略采用非重绘方式,所有信号均在K线收盘时确认,有效降低了虚假信号的风险。策略适用于多个时间周期,尤其适合波动性较强的市场环境。
策略原理
策略的核心逻辑基于以下三个关键条件:
- 价格突破基准线(Base Line)上方,表明短期趋势转强
- 价格突破前导线A(Lead Line A)上方,确认中期趋势方向
- 价格位于转换线(Conversion Line)上方,验证趋势持续性 当这三个条件同时满足时,系统会在K线收盘时发出做多信号。相反的条件组合则触发平仓信号。策略还采用了云图填充来增强趋势的可视化效果,云图呈绿色表示多头市场,红色表示空头市场。
策略优势
- 信号可靠性高:采用多重条件确认,有效降低假突破风险
- 非重绘设计:所有信号在K线收盘时确认,避免回测美化
- 多周期适用:可在5分钟到周线等多个时间周期上应用
- 趋势跟踪能力强:通过云图组件的配合,准确把握主要趋势
- 可视化效果好:使用三角形标记信号点,云图填充清晰显示趋势变化
- 灵活性强:关键参数可调整,适应不同市场环境
策略风险
- 震荡市场风险:在横盘整理阶段可能产生频繁假信号
- 滞后性风险:使用移动平均计算导致信号存在一定滞后
- 资金管理风险:缺乏止损机制可能导致较大回撤
- 参数优化风险:过度优化可能导致过拟合
- 市场环境依赖:策略在强趋势市场表现最佳,弱趋势期效果欠佳
策略优化方向
- 增加波动率过滤:引入ATR指标过滤低波动期间的信号
- 完善止损机制:设置跟踪止损来保护利润
- 优化信号确认:结合RSI、MACD等指标增强信号可靠性
- 加入成交量分析:通过成交量确认价格突破的有效性
- 市场环境识别:开发趋势强度指标来选择最佳交易时机
总结
该策略通过对云图指标的创新应用,建立了一个可靠的趋势跟踪交易系统。策略的非重绘设计和多重确认机制显著提高了信号质量。虽然在震荡市场表现欠佳,但通过建议的优化方向可以进一步提升策略的稳定性和适用性。策略特别适合追踪中长期趋势,对于寻求趋势跟踪机会的交易者来说是一个很好的选择。 ||
Overview
This strategy is a trend-following trading system based on the Ichimoku Cloud indicator. It identifies market trends through crossovers of cloud components and generates trading signals when price breaks through key technical levels. The strategy employs a non-repainting approach, with all signals confirmed at bar close, effectively reducing the risk of false signals. It is applicable across multiple timeframes and particularly suitable for volatile market conditions.
Strategy Principles
The core logic is based on three key conditions:
- Price breaks above the Base Line, indicating strengthening short-term trend
- Price breaks above Lead Line A, confirming medium-term trend direction
- Price remains above the Conversion Line, validating trend continuity When these three conditions are simultaneously met, the system generates a buy signal at bar close. Opposite conditions trigger exit signals. The strategy also utilizes cloud filling for enhanced trend visualization, with green clouds indicating bullish markets and red clouds indicating bearish markets.
Strategy Advantages
- High Signal Reliability: Multiple confirmation conditions reduce false breakout risks
- Non-Repainting Design: All signals confirmed at bar close, preventing backtest beautification
- Multi-Timeframe Applicability: Works on various timeframes from 5-minute to weekly
- Strong Trend Following Capability: Accurately captures major trends through cloud component coordination
- Excellent Visualization: Uses triangle markers for signal points, clear cloud filling for trend changes
- High Flexibility: Key parameters adjustable for different market conditions
Strategy Risks
- Choppy Market Risk: May generate frequent false signals during consolidation phases
- Lag Risk: Signal delay due to moving average calculations
- Money Management Risk: Lack of stop-loss mechanism may lead to significant drawdowns
- Parameter Optimization Risk: Over-optimization may result in overfitting
- Market Environment Dependency: Strategy performs best in strong trends, suboptimal in weak trend periods
Strategy Optimization Directions
- Add Volatility Filtering: Introduce ATR indicator to filter signals during low volatility periods
- Improve Stop-Loss Mechanism: Implement trailing stops to protect profits
- Enhance Signal Confirmation: Integrate RSI, MACD indicators to strengthen signal reliability
- Incorporate Volume Analysis: Confirm price breakout validity through volume
- Market Environment Recognition: Develop trend strength indicators for optimal trading timing
Summary
The strategy establishes a reliable trend-following trading system through innovative application of the Ichimoku Cloud indicator. Its non-repainting design and multiple confirmation mechanisms significantly improve signal quality. While performance may be suboptimal in choppy markets, the suggested optimization directions can further enhance strategy stability and applicability. The strategy is particularly suitable for tracking medium to long-term trends, making it an excellent choice for traders seeking trend-following opportunities. [/trans]
Source (PineScript)
/*backtest
start: 2025-01-09 00:00:00
end: 2025-01-16 00:00:00
period: 10m
basePeriod: 10m
exchanges: [{"eid":"Futures_Binance","currency":"BTC_USDT","balance":49999}]
*/

//@version=5
strategy("Ichimoku Cloud Buy Strategy (Non-Repainting)", overlay=true)

// === Ichimoku Cloud Settings ===
lengthConversionLine = input(9, title="Conversion Line Length")
lengthBaseLine = input(26, title="Baseline Length")
lengthLeadLine = input(52, title="Lead Line Length")

// === Calculate Ichimoku Cloud Components ===
conversionLine = ta.sma((high + low) / 2, lengthConversionLine)
baseLine = ta.sma((high + low) / 2, lengthBaseLine)
leadLineA = (conversionLine + baseLine) / 2
leadLineB = ta.sma((high + low) / 2, lengthLeadLine)

// === Forward Projected Lead Lines (Fixes Ichimoku Calculation) ===
leadLineA_Future = leadLineA[lengthBaseLine]  // Shift forward
leadLineB_Future = leadLineB[lengthBaseLine]

// === Define Buy and Sell Conditions (Confirmed at Bar Close) ===
buyCondition = ta.crossover(close, baseLine) and ta.crossover(close, leadLineA) and close > conversionLine and bar_index > bar_index[1]
sellCondition = ta.crossunder(close, baseLine) and ta.crossunder(close, leadLineA) and close < conversionLine and bar_index > bar_index[1]

// === Plot Buy and Sell Signals (Confirmed at Bar Close) ===
plotshape(buyCondition, style=shape.triangleup, location=location.belowbar, color=color.green, size=size.small, title="Buy Signal")
plotshape(sellCondition, style=shape.triangledown, location=location.abovebar, color=color.red, size=size.small, title="Sell Signal")

// === Implement Strategy Logic (Trades at Bar Close) ===
if (buyCondition)
    strategy.entry("Buy", strategy.long)

if (sellCondition)
    strategy.close("Buy")

// === Plot Ichimoku Cloud Components with Future Projection ===
pConversionLine = plot(conversionLine, color=color.blue, title="Conversion Line")
pBaseLine = plot(baseLine, color=color.red, title="Base Line")
pLeadLineA = plot(leadLineA_Future, color=color.green, title="Lead Line A", offset=lengthBaseLine)
pLeadLineB = plot(leadLineB_Future, color=color.orange, title="Lead Line B", offset=lengthBaseLine)

// === Fill Ichimoku Cloud for Better Visualization ===
fill(pLeadLineA, pLeadLineB, color=leadLineA > leadLineB ? color.green : color.red, transp=80)

// === Alert Conditions (Only Triggered on Confirmed Signals) ===
alertcondition(buyCondition, title="Ichimoku Cloud Buy Signal", message="Ichimoku Cloud Buy Signal Triggered")
alertcondition(sellCondition, title="Ichimoku Cloud Sell Signal", message="Ichimoku Cloud Sell Signal Triggered")
Detail
https://www.fmz.com/strategy/478686
Last Modified
2025-01-17 14:21:28