
9.6 KiB
Name
多时间框架RSI-EMA动量交易策略与头寸缩放-Multi-Timeframe-RSI-EMA-Momentum-Trading-Strategy-with-Position-Scaling
Author
ChaoZhang
Strategy Description
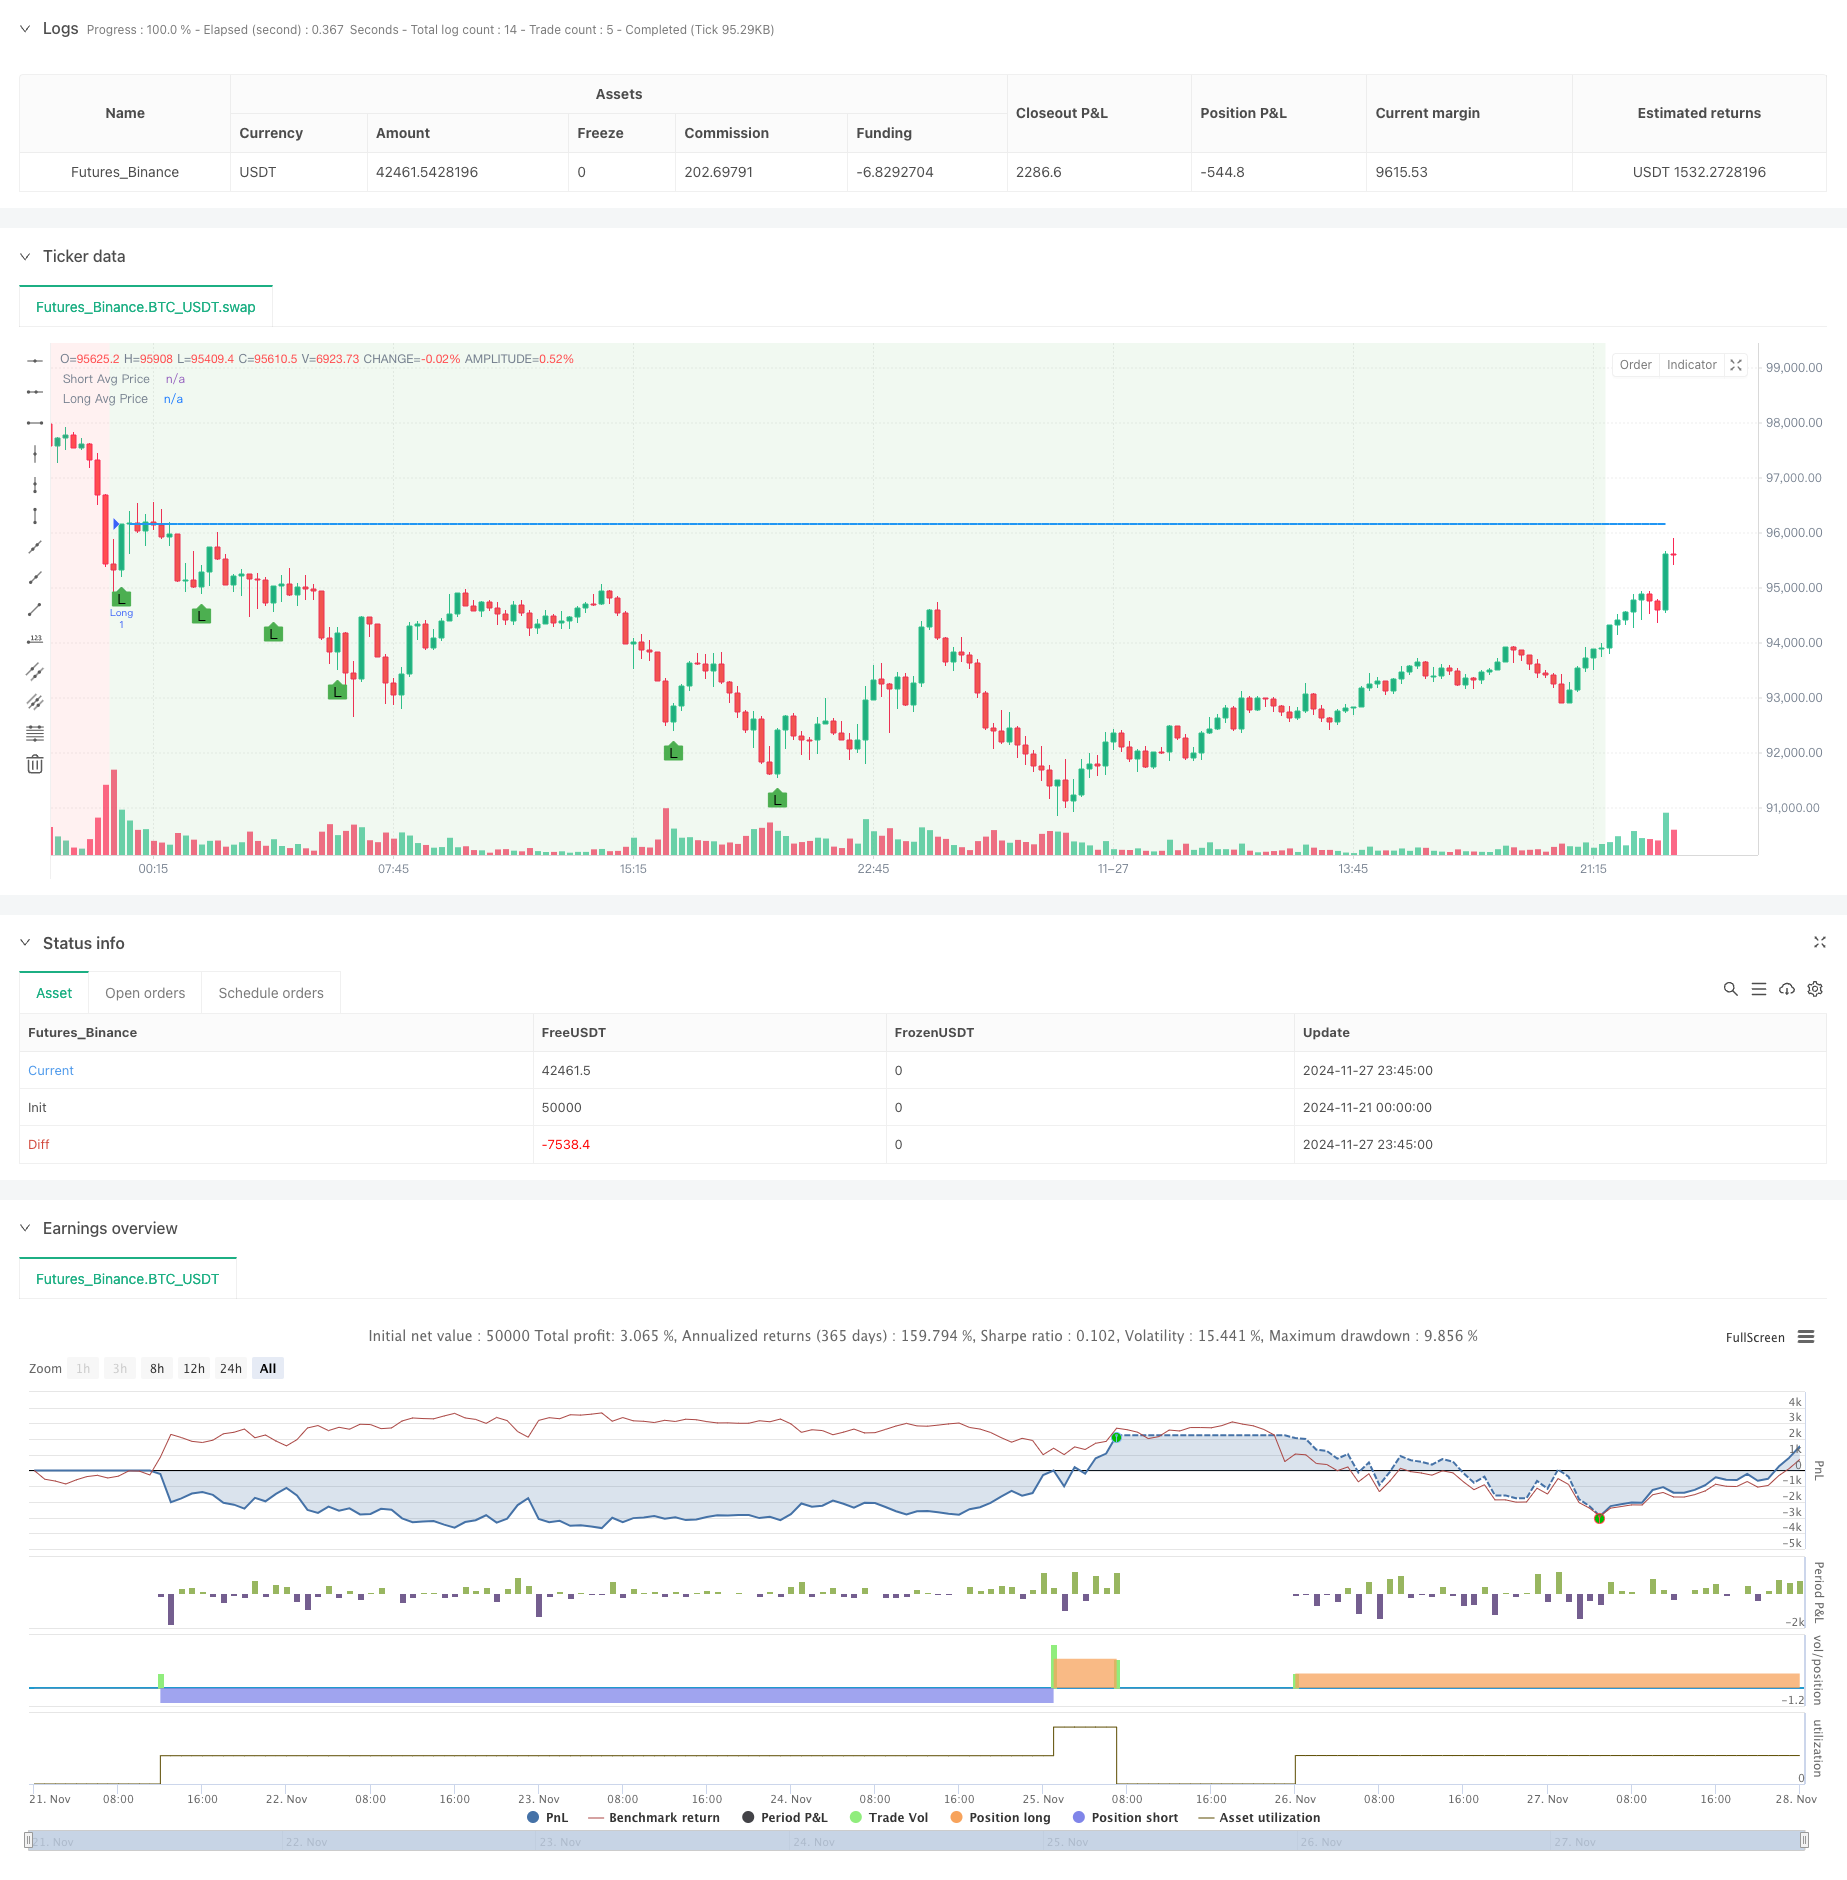
[trans]
概述
这是一个基于RSI和EMA指标的动量交易策略,结合了多重时间周期的技术分析方法。该策略通过RSI超买超卖信号与EMA趋势确认来进行交易,并采用仓位动态调整机制。策略的核心在于将短期RSI(2周期)与中期RSI(14周期)的信号结合,同时使用三条不同周期的EMA(50/100/200)来确认市场趋势方向。
策略原理
策略采用多层验证机制进行交易决策。做多条件需要RSI14低于31且RSI2向上突破10,同时要求EMA50、EMA100、EMA200呈现空头排列。做空条件则要求RSI14高于69且RSI2向下跌破90,同时要求EMA50、EMA100、EMA200呈现多头排列。策略还包含基于RSI指标的止盈机制,当RSI达到极值且价格对持仓有利时自动平仓。特别之处在于策略采用了基于账户权益的动态仓位管理系统,每次建仓都会根据当前权益计算合适的仓位大小。
策略优势
- 信号确认机制完善,通过多重技术指标验证降低虚假信号风险
- 动态仓位管理系统能够根据账户规模自动调整交易量
- 使用不同周期的RSI配合EMA趋势确认,提高了交易的准确性
- 具有清晰的止盈机制,能够及时锁定利润
- 策略具有良好的可视化效果,便于交易者理解市场状态
- 采用分层的技术指标组合,能够更好地捕捉市场动量变化
策略风险
- 高杠杆(20倍)可能导致较大的账户波动
- 在横盘市场中可能产生频繁的假突破信号
- 仓位倍增机制可能在连续亏损时加剧损失
- 没有设置止损机制,在极端行情下可能造成较大损失
- EMA趋势判断可能在市场快速转向时滞后
- RSI指标在某些市场条件下可能产生误导性信号
策略优化方向
- 引入动态止损机制,可以基于ATR或波动率设置止损点位
- 优化仓位管理系统,设置最大仓位限制以控制风险
- 加入市场波动率过滤器,在高波动率环境下调整交易参数
- 考虑增加时间过滤器,避免在不利时段交易
- 引入更多的市场状态判断指标,如成交量指标
- 开发自适应参数系统,根据市场环境动态调整指标参数
总结
这是一个综合了动量交易和趋势跟踪特点的策略,通过多重技术指标的配合使用提高了交易的可靠性。虽然存在一些风险点,但通过建议的优化方向可以进一步提升策略的稳定性。策略的最大特点是将短期和中期技术指标结合,配合动态仓位管理,形成了一个完整的交易系统。通过合理的风险管理和参数优化,该策略有望在实际交易中取得稳定表现。 ||
Overview
This is a momentum trading strategy based on RSI and EMA indicators, combining technical analysis across multiple timeframes. The strategy executes trades based on RSI overbought/oversold signals with EMA trend confirmation and employs dynamic position sizing. The core concept lies in combining short-term RSI (2-period) with medium-term RSI (14-period) signals, while using three different period EMAs (50/100/200) for trend direction confirmation.
Strategy Principles
The strategy employs a multi-layer validation mechanism for trading decisions. Long conditions require RSI14 below 31 and RSI2 crossing above 10, along with EMA50, EMA100, and EMA200 in bearish alignment. Short conditions require RSI14 above 69 and RSI2 crossing below 90, with EMAs in bullish alignment. The strategy includes an RSI-based take-profit mechanism, automatically closing positions when RSI reaches extreme values and price movement favors the position. A notable feature is the dynamic position sizing system based on account equity, calculating appropriate position sizes for each trade.
Strategy Advantages
- Comprehensive signal confirmation mechanism reduces false signal risks through multiple technical indicator validation
- Dynamic position sizing system automatically adjusts trading volume based on account size
- Multiple period RSI combined with EMA trend confirmation improves trading accuracy
- Clear take-profit mechanism ensures timely profit capture
- Excellent visualization features help traders understand market conditions
- Layered technical indicator combination better captures market momentum changes
Strategy Risks
- High leverage (20x) may lead to significant account volatility
- May generate frequent false breakout signals in ranging markets
- Position multiplication mechanism could amplify losses during consecutive losing trades
- Lack of stop-loss mechanism might result in substantial losses in extreme market conditions
- EMA trend judgment may lag during rapid market reversals
- RSI indicators might generate misleading signals under certain market conditions
Strategy Optimization Directions
- Introduce dynamic stop-loss mechanism based on ATR or volatility
- Optimize position management system with maximum position limits for risk control
- Add volatility filters to adjust trading parameters in high volatility environments
- Consider implementing time filters to avoid unfavorable trading periods
- Incorporate additional market state indicators, such as volume indicators
- Develop adaptive parameter system to dynamically adjust indicator parameters based on market conditions
Summary
This strategy combines momentum trading with trend following characteristics, enhancing trading reliability through multiple technical indicators. While certain risks exist, the suggested optimization directions can further improve strategy stability. The strategy's main feature is the combination of short-term and medium-term technical indicators with dynamic position management, forming a complete trading system. Through proper risk management and parameter optimization, this strategy shows promise for stable performance in actual trading. [/trans]
Source (PineScript)
/*backtest
start: 2024-11-21 00:00:00
end: 2024-11-28 00:00:00
period: 15m
basePeriod: 15m
exchanges: [{"eid":"Futures_Binance","currency":"BTC_USDT"}]
*/

//@version=5
strategy("Custom RSI EMA Strategy", overlay=true, default_qty_type=strategy.fixed, default_qty_value=1)

// Definování vstupních podmínek
rsi_14 = ta.rsi(close, 14)
rsi_2 = ta.rsi(close, 2)
ema_50 = ta.ema(close, 50)
ema_100 = ta.ema(close, 100)
ema_200 = ta.ema(close, 200)

// Pákový efekt
leverage = 20

// Podmínky pro long pozici
longCondition = (rsi_14[1] < 31) and ta.crossover(rsi_2, 10) and (ema_50 < ema_100) and (ema_100 < ema_200)

// Podmínky pro short pozici
shortCondition = (rsi_14[1] > 69) and ta.crossunder(rsi_2, 90) and (ema_50 > ema_100) and (ema_100 > ema_200)

// Definování průměrné ceny pozice
var float long_avg_price = na
var float short_avg_price = na

// Sledujeme, zda se velikost pozice změnila
var float last_position_size = na

// Přerušení průměrné ceny pozice při změně pozice
if (last_position_size != strategy.position_size)
    long_avg_price := na
    short_avg_price := na

// Aktualizace průměrné ceny pozice
if (strategy.position_size > 0)
    long_avg_price := strategy.position_avg_price
    short_avg_price := na
else if (strategy.position_size < 0)
    short_avg_price := strategy.position_avg_price
    long_avg_price := na

// Uložení aktuální velikosti pozice pro příští bar
last_position_size := strategy.position_size

// Podmínky pro take profit
takeProfitLongCondition = (rsi_14 > 69) and (rsi_2 > 90) and (long_avg_price < close)
takeProfitShortCondition = (rsi_14 < 31) and (rsi_2 < 10) and (short_avg_price > close)

// Velikost pozice
new_position_size = strategy.position_size == 0 ? na : math.abs(strategy.position_size) * 2

// Úprava velikosti pozice s ohledem na pákový efekt
position_value = strategy.equity * leverage
trade_qty = position_value / close

// Vstup do long pozice s dvojnásobkem aktuální pozice nebo standardní velikostí při první pozici
if (longCondition)
    strategy.entry("Long", strategy.long, qty=new_position_size == na ? trade_qty : new_position_size)

// Vstup do short pozice s dvojnásobkem aktuální pozice nebo standardní velikostí při první pozici
if (shortCondition)
    strategy.entry("Short", strategy.short, qty=new_position_size == na ? trade_qty : new_position_size)

// Výstup z long pozice při splnění podmínek pro take profit
if (takeProfitLongCondition)
    strategy.close("Long")

// Výstup z short pozice při splnění podmínek pro take profit
if (takeProfitShortCondition)
    strategy.close("Short")

// Zvýraznění části grafu, kde platí podmínky pro long
highlightLongCondition = (ema_50 < ema_100) and (ema_100 < ema_200)
bgcolor(highlightLongCondition ? color.new(color.green, 90) : na)

// Zvýraznění části grafu, kde platí podmínky pro short
highlightShortCondition = (ema_50 > ema_100) and (ema_100 > ema_200)
bgcolor(highlightShortCondition ? color.new(color.red, 90) : na)

// Přidání bodů pozic do grafu
plotshape(series=longCondition, location=location.belowbar, color=color.green, style=shape.labelup, text="L")
plotshape(series=shortCondition, location=location.abovebar, color=color.red, style=shape.labeldown, text="S")

// Vykreslení průměrné ceny pozice pro long a short
plot(long_avg_price, title="Long Avg Price", color=color.blue, linewidth=2)
plot(short_avg_price, title="Short Avg Price", color=color.orange, linewidth=2)
Detail
https://www.fmz.com/strategy/473361
Last Modified
2024-11-29 15:23:44