
16 KiB
Name
多时间框架RSI与EMA交叉量化动量策略-Multi-Timeframe-RSI-EMA-Crossover-Momentum-Quantitative-Strategy
Author
ianzeng123
Strategy Description
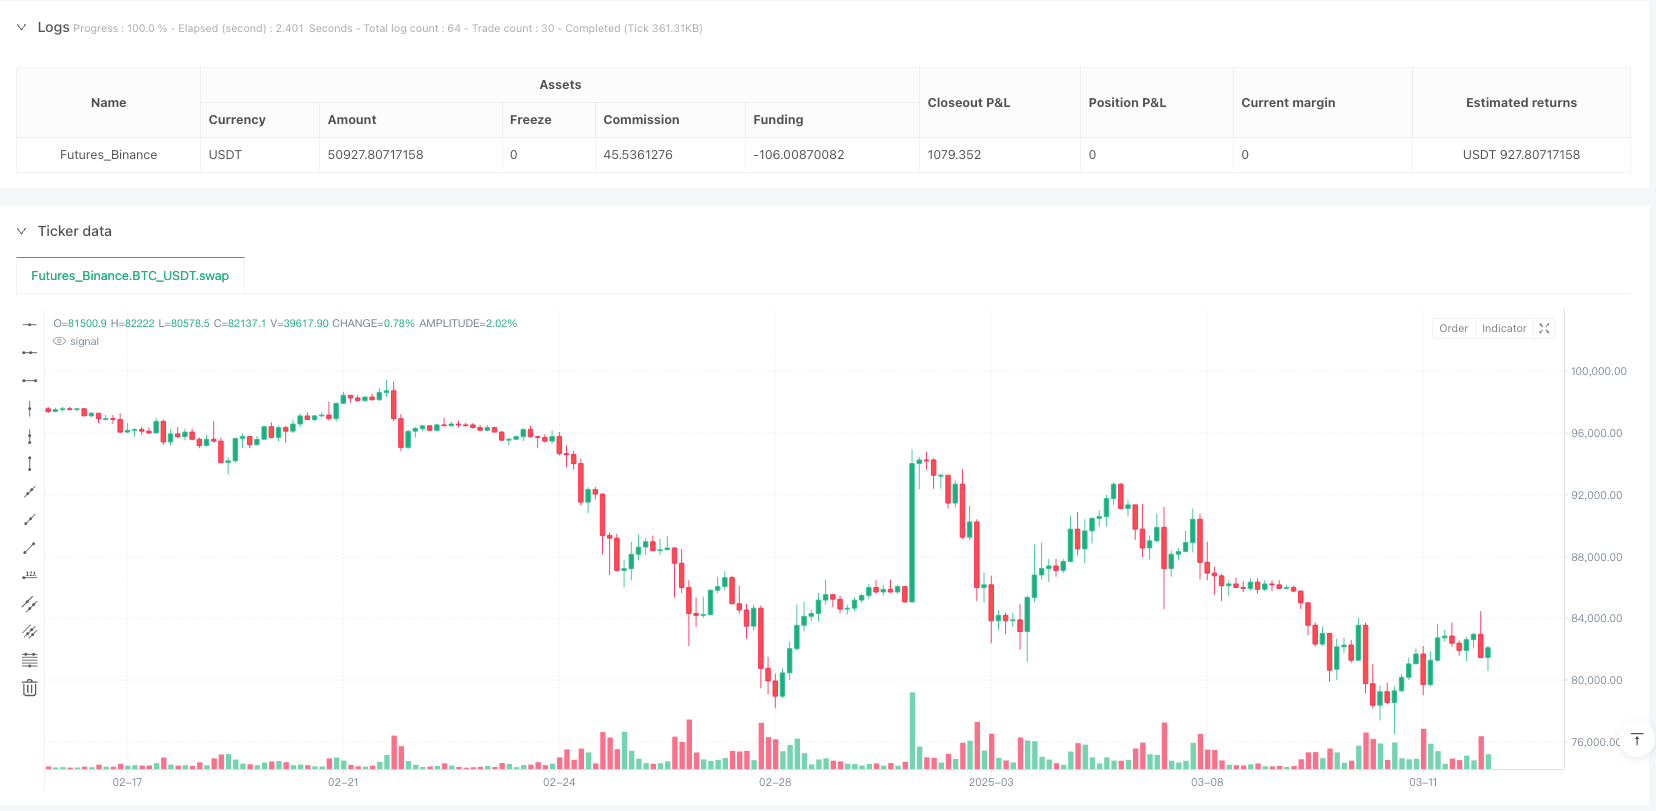
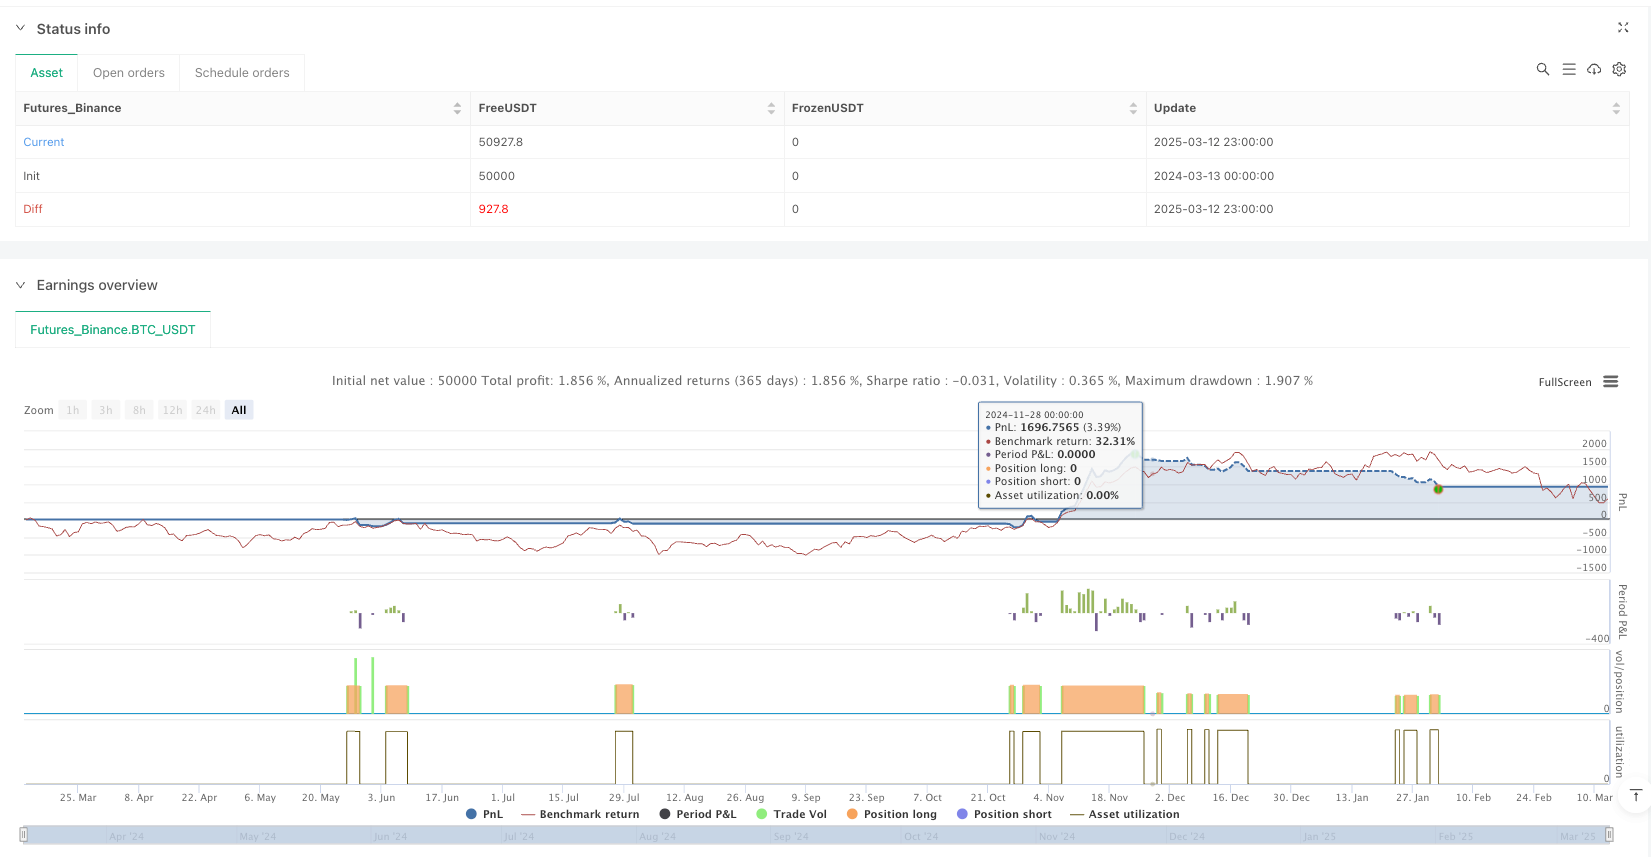
[trans]
策略概述
此量化交易策略巧妙结合了相对强弱指数(RSI)与指数移动平均线(EMA)的优势,并引入多时间框架分析作为过滤机制。该策略核心设计围绕日线和周线RSI指标的协同确认,通过EMA交叉捕捉趋势转变点,旨在识别具有持续性的动量交易机会。策略采用自适应的进出场逻辑,利用多重技术指标的交叉验证,有效提高了交易信号的可靠性。
策略原理
策略基于以下核心原理设计:
-
多时间框架RSI过滤:
- 日线RSI作为主要信号生成来源
- 周线RSI作为趋势确认过滤器,确保交易方向与更大周期趋势一致
- 买入条件要求周线RSI>55,日线RSI>55
- 卖出条件要求周线RSI<45,日线RSI<45
-
EMA交叉系统:
- 使用13周期和21周期的EMA交叉作为主要入场信号
- 34周期和55周期的EMA提供支撑/阻力位和出场参考
- 快速EMA(13周期)上穿慢速EMA(21周期)触发买入信号
- 快速EMA下穿慢速EMA触发卖出信号
-
信号确认机制:
- 只有当EMA交叉信号与两个时间框架的RSI方向一致时才执行交易
- 通过request.security函数实现不同时间框架的数据整合
- 多重条件筛选减少假信号和震荡行情下的频繁交易
-
精确的出场策略:
- 多头出场条件为EMA1下穿EMA3或价格跌破EMA4
- 空头出场条件为EMA1上穿EMA3或价格突破EMA4
- 平仓逻辑与开仓条件独立,更注重风险控制
策略优势
通过深入分析代码,可以总结出该策略具有以下显著优势:
-
多层次信号过滤系统:
- 整合短期和长期RSI,降低假突破风险
- 结合多条EMA形成动态支撑阻力区域,提高信号质量
- 多重确认机制显著减少"震荡市场"下的无效交易
-
适应性强的趋势识别:
- 能够在趋势初始阶段提前介入,而非趋势成熟后才进场
- 通过周线RSI的高级过滤,避免与主要趋势方向相反的交易
- EMA交叉系统对市场噪音具有天然过滤作用
-
完善的风险管理机制:
- 清晰的出场条件设计,避免情绪化持仓
- 在逆转信号出现时自动平仓,有效控制回撤
- 通过平仓后再开反向仓位的设计,增强资金效率
-
高度可定制性:
- 所有关键参数均通过input函数实现可调节
- 支持个性化调整RSI阈值和EMA长度,适应不同市场环境
- 可根据不同品种特性自定义信号敏感度
策略风险
尽管该策略设计合理,仍存在以下潜在风险和局限性:
-
参数敏感性:
- RSI和EMA参数的选择对策略表现影响显著
- 过于敏感的参数可能导致过度交易
- 解决方法:基于历史数据进行参数优化和回测,避免过度拟合
-
区间震荡市场表现不佳:
- 在没有明显趋势的横盘市场中可能产生频繁的假信号
- EMA交叉策略在震荡市场天然弱势
- 解决方法:增加波动率过滤器或趋势强度指标,在低趋势强度环境下自动降低持仓比例
-
滞后性问题:
- EMA和RSI均为滞后指标,可能在剧烈波动市场中反应不及时
- 信号确认过程中可能错过最佳入场点
- 解决方法:考虑引入前瞻性指标如成交量或价格形态识别
-
信号稀少:
- 多重条件筛选可能导致交易信号较少
- 在低波动率环境下可能长期无交易机会
- 解决方法:考虑增加辅助交易信号或适当放宽条件要求
策略优化方向
基于代码分析,以下是该策略可能的优化方向:
-
自适应参数系统:
- 实现RSI阈值和EMA周期的动态调整,基于市场波动率自动优化
- 加入ATR(平均真实波幅)指标,根据市场波动调整止损位置
- 引入市场状态分类,在趋势和震荡市场使用不同的参数设置
-
增强信号质量:
- 整合成交量确认机制,要求信号出现时伴随成交量增加
- 加入针对假突破的价格行为筛选,如要求收盘价站稳EMA
- 引入趋势强度指标如ADX,仅在强趋势环境下执行完整仓位交易
-
改进资金管理:
- 实现基于波动率的动态仓位管理,高波动环境下自动减仓
- 引入金字塔式加仓策略,在趋势确认后分批增加持仓
- 设计基于风险回报比的智能止损止盈系统
-
多市场适应性:
- 增加商品特性分析,针对不同类别品种自动调整策略参数
- 实现市场相关性分析,避免过度集中风险
- 增加日内和长周期信号协同机制,形成多级别交易系统
总结
多时间框架RSI与EMA交叉量化动量策略是一个设计精巧的量化交易系统,通过整合不同时间周期的RSI指标与多重EMA构建了一个立体的信号生成和过滤机制。该策略核心优势在于其多层次的确认系统,既可有效捕捉趋势转折点,又能避免在震荡市场中频繁交易。
策略的风险主要集中在参数敏感性和震荡市场表现上,但通过引入自适应参数系统和增强的市场状态识别机制,这些风险可以得到有效缓解。未来优化方向应围绕信号质量提升、动态参数调整和智能资金管理展开,以提高策略在不同市场环境下的鲁棒性和稳定性。
从整体来看,该策略逻辑清晰、设计合理,是一个具有实战价值的量化交易系统。通过精细调整和持续优化,可以发展成为一个适应性强、风险可控的长期交易方案。 ||
Strategy Overview
This quantitative trading strategy skillfully combines the strengths of the Relative Strength Index (RSI) and Exponential Moving Averages (EMA), while incorporating multi-timeframe analysis as a filtering mechanism. The core design revolves around the collaborative confirmation between daily and weekly RSI indicators, capturing trend inflection points through EMA crossovers, aimed at identifying sustainable momentum trading opportunities. The strategy employs adaptive entry and exit logic, utilizing cross-validation from multiple technical indicators to effectively enhance the reliability of trading signals.
Strategy Principles
The strategy is designed based on the following core principles:
-
Multi-Timeframe RSI Filtering:
- Daily RSI serves as the primary signal generation source
- Weekly RSI acts as a trend confirmation filter, ensuring trade direction aligns with the larger cycle trend
- Buy conditions require Weekly RSI > 55 and Daily RSI > 55
- Sell conditions require Weekly RSI < 45 and Daily RSI < 45
-
EMA Crossover System:
- Uses 13-period and 21-period EMA crossovers as the main entry signals
- 34-period and 55-period EMAs provide support/resistance levels and exit references
- Fast EMA (13-period) crossing above slow EMA (21-period) triggers buy signals
- Fast EMA crossing below slow EMA triggers sell signals
-
Signal Confirmation Mechanism:
- Trades are executed only when EMA crossover signals align with RSI direction in both timeframes
- Multi-timeframe data integration is achieved through the request.security function
- Multiple condition filtering reduces false signals and frequent trading in oscillating markets
-
Precise Exit Strategy:
- Long position exit conditions: EMA1 crosses below EMA3 or price breaks below EMA4
- Short position exit conditions: EMA1 crosses above EMA3 or price breaks above EMA4
- Position closing logic is independent of entry conditions, with greater emphasis on risk control
Strategy Advantages
Through in-depth code analysis, the following significant advantages of this strategy can be summarized:
-
Multi-Level Signal Filtering System:
- Integration of short-term and long-term RSI reduces false breakout risks
- Combination of multiple EMAs forms dynamic support and resistance zones, improving signal quality
- Multiple confirmation mechanisms significantly reduce ineffective trades in "oscillating markets"
-
Highly Adaptive Trend Identification:
- Capable of early entry in the initial phase of trends, rather than entering after trends mature
- Higher-level filtering through weekly RSI avoids trades against the main trend direction
- EMA crossover system naturally filters market noise
-
Comprehensive Risk Management Mechanism:
- Clear exit condition design prevents emotional position holding
- Automatic position closing when reversal signals appear, effectively controlling drawdowns
- Design of closing positions before opening reverse positions enhances capital efficiency
-
High Customizability:
- All key parameters are adjustable through the input function
- Supports personalized adjustment of RSI thresholds and EMA lengths to adapt to different market environments
- Signal sensitivity can be customized according to different instrument characteristics
Strategy Risks
Despite its reasonable design, the strategy still has the following potential risks and limitations:
-
Parameter Sensitivity:
- The choice of RSI and EMA parameters significantly impacts strategy performance
- Overly sensitive parameters may lead to excessive trading
- Solution: Parameter optimization and backtesting based on historical data, avoiding overfitting
-
Poor Performance in Range-Bound Markets:
- May generate frequent false signals in sideways markets without clear trends
- EMA crossover strategies are naturally weak in oscillating markets
- Solution: Add volatility filters or trend strength indicators, automatically reducing position sizes in low trend-strength environments
-
Lag Issues:
- Both EMA and RSI are lagging indicators, which may not respond timely in volatile markets
- The signal confirmation process may miss optimal entry points
- Solution: Consider introducing leading indicators such as volume or price pattern recognition
-
Signal Scarcity:
- Multiple condition filtering may result in fewer trading signals
- Long periods without trading opportunities in low-volatility environments
- Solution: Consider adding auxiliary trading signals or moderately relaxing condition requirements
Strategy Optimization Directions
Based on code analysis, the following are possible optimization directions for this strategy:
-
Adaptive Parameter System:
- Implement dynamic adjustment of RSI thresholds and EMA periods, automatically optimizing based on market volatility
- Add ATR (Average True Range) indicator to adjust stop-loss positions according to market volatility
- Introduce market state classification, using different parameter settings in trending and oscillating markets
-
Enhanced Signal Quality:
- Integrate volume confirmation mechanisms, requiring increased volume when signals appear
- Add price action filtering for false breakouts, such as requiring closing prices to firmly establish above EMA
- Introduce trend strength indicators like ADX, executing full position trades only in strong trend environments
-
Improved Capital Management:
- Implement volatility-based dynamic position management, automatically reducing positions in high-volatility environments
- Introduce pyramid-style position building strategy, incrementally increasing positions after trend confirmation
- Design intelligent stop-loss and take-profit systems based on risk-reward ratios
-
Multi-Market Adaptability:
- Add instrument characteristic analysis, automatically adjusting strategy parameters for different categories
- Implement market correlation analysis to avoid excessive concentration of risk
- Add intraday and long-cycle signal collaboration mechanisms, forming a multi-level trading system
Conclusion
The Multi-Timeframe RSI & EMA Crossover Momentum Quantitative Strategy is an elegantly designed quantitative trading system that builds a three-dimensional signal generation and filtering mechanism by integrating RSI indicators from different time periods with multiple EMAs. The core advantage of this strategy lies in its multi-layered confirmation system, which can effectively capture trend inflection points while avoiding frequent trading in oscillating markets.
The strategy's risks primarily center on parameter sensitivity and performance in oscillating markets, but these risks can be effectively mitigated through the introduction of adaptive parameter systems and enhanced market state recognition mechanisms. Future optimization directions should focus on signal quality enhancement, dynamic parameter adjustment, and intelligent capital management to improve the strategy's robustness and stability across different market environments.
From an overall perspective, this strategy has clear logic and reasonable design, making it a quantitative trading system with practical value. Through fine-tuning and continuous optimization, it can evolve into a highly adaptive, risk-controlled long-term trading solution.[/trans]
Source (PineScript)
/*backtest
start: 2024-03-13 00:00:00
end: 2025-03-13 00:00:00
period: 3h
basePeriod: 3h
exchanges: [{"eid":"Futures_Binance","currency":"BTC_USDT"}]
*/

//@version=6
strategy("RSI & EMA Crossover Strategy with Daily & Weekly RSI Filter", overlay=true, default_qty_type=strategy.percent_of_equity, default_qty_value=10)

// === INPUTS ===
rsiLength = input(14, "RSI Length")
rsiOverbought = input(70, "RSI Overbought")
rsiOversold = input(30, "RSI Oversold")
dailyRSIThresholdBuy = input(55, "Daily RSI Buy Threshold")
dailyRSIThresholdSell = input(45, "Daily RSI Sell Threshold")
weeklyRSIThresholdBuy = input(55, "Weekly RSI Buy Threshold")
weeklyRSIThresholdSell = input(45, "Weekly RSI Sell Threshold")

ema1Length = input(13, "EMA 1 Length")
ema2Length = input(21, "EMA 2 Length")
ema3Length = input(34, "EMA 3 Length")
ema4Length = input(55, "EMA 4 Length")

// === RSI CALCULATION ===
currentRSI = ta.rsi(close, rsiLength)
dailyRSI = request.security(syminfo.tickerid, "D", ta.rsi(close, rsiLength), lookahead=barmerge.lookahead_on)
weeklyRSI = request.security(syminfo.tickerid, "W", ta.rsi(close, rsiLength), lookahead=barmerge.lookahead_on)

// === EMA CALCULATIONS ===
ema1 = ta.ema(close, ema1Length)
ema2 = ta.ema(close, ema2Length)
ema3 = ta.ema(close, ema3Length)
ema4 = ta.ema(close, ema4Length)

// === BUY CONDITION ===
buySignal = ta.crossover(ema1, ema2) and dailyRSI > dailyRSIThresholdBuy and weeklyRSI > weeklyRSIThresholdBuy

// === SELL CONDITION ===
sellSignal = ta.crossunder(ema1, ema2) and dailyRSI < dailyRSIThresholdSell and weeklyRSI < weeklyRSIThresholdSell

// === EXIT CONDITIONS ===
exitLong = ta.crossunder(ema1, ema3) or close < ema4
exitShort = ta.crossover(ema1, ema3) or close > ema4

// === STRATEGY EXECUTION ===
if (buySignal)
    strategy.close("Short")  // Close short position before opening long
    strategy.entry("Long", strategy.long)
if (sellSignal)
    strategy.close("Long")  // Close long position before opening short
    strategy.entry("Short", strategy.short)

if (exitLong)
    strategy.close("Long")
if (exitShort)
    strategy.close("Short")

// === PLOTTING SIGNALS ===
plotshape(series=buySignal, location=location.belowbar, color=color.green, style=shape.labelup, title="Buy Signal")
plotshape(series=sellSignal, location=location.abovebar, color=color.red, style=shape.labeldown, title="Sell Signal")

// === ALERTS ===
alertcondition(buySignal, title="Buy Alert", message="Buy Signal Triggered")
alertcondition(sellSignal, title="Sell Alert", message="Sell Signal Triggered")
alertcondition(exitLong, title="Exit Long Alert", message="Exit Long Position")
alertcondition(exitShort, title="Exit Short Alert", message="Exit Short Position")
Detail
https://www.fmz.com/strategy/486570
Last Modified
2025-03-14 10:11:29