
19 KiB
Name
多时间框架适应性均值回归与交易量分析策略-Multi-Timeframe-Adaptive-Mean-Reversion-with-Volume-Analysis-Strategy
Author
ianzeng123
Strategy Description
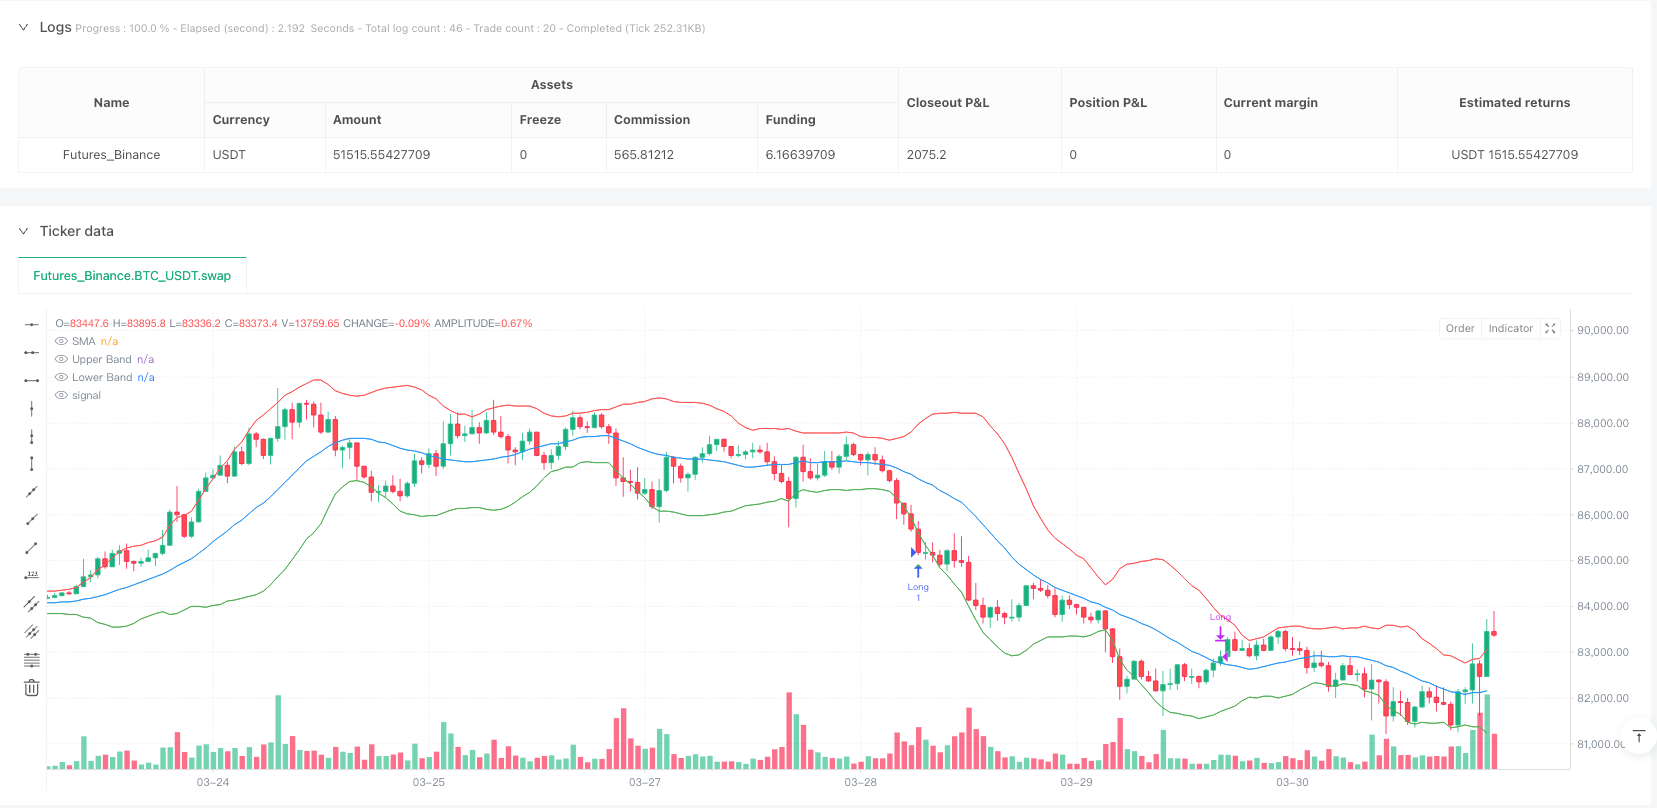
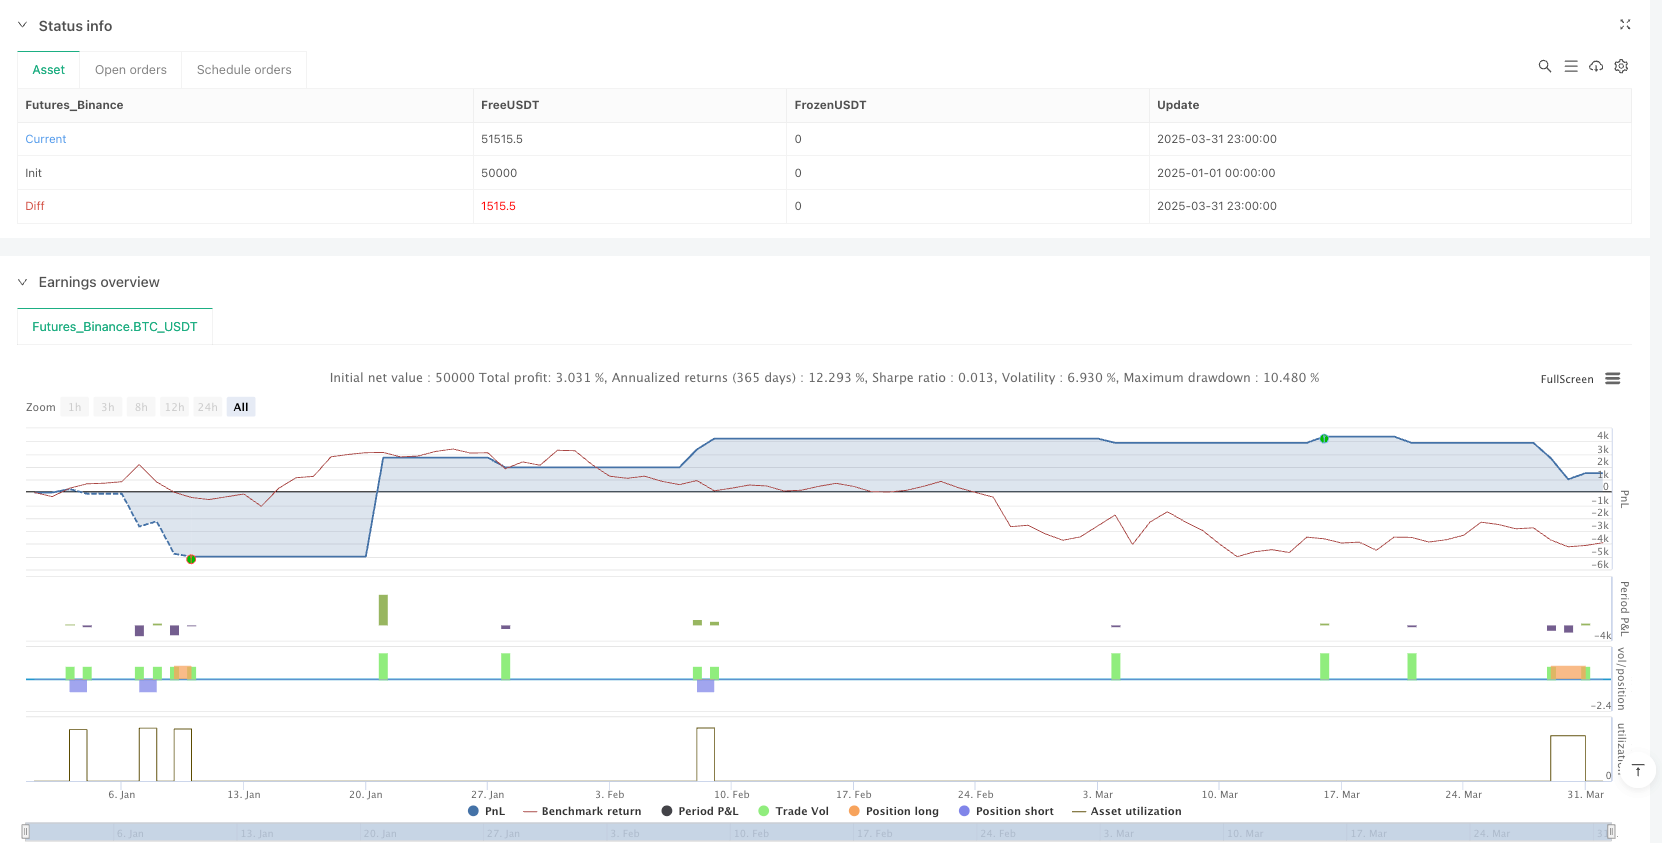
[trans]
概述
多时间框架适应性均值回归与交易量分析策略是一种结合了技术指标和交易量确认的高级量化交易方法。该策略建立在传统均值回归交易思想的基础上,但通过引入自适应参数设置、交易量确认、多时间框架分析和波动率过滤器等创新元素,显著提高了交易决策的准确性和稳健性。核心思路是识别市场过度扩张或收缩的区域,并在有足够交易量支持的情况下,捕捉价格回归均值的机会。
策略原理
该策略的运作原理基于以下几个关键组件的协同作用:
-
移动平均线与布林带:使用简单移动平均线(SMA)作为价格的中心参考点,并结合标准差计算上下布林带,用于识别价格偏离程度。
-
自适应RSI指标:根据市场波动性动态调整RSI超买超卖阈值。在高波动市场中,系统会自动调整超买超卖区间,使策略适应不同市场环境。
-
交易量确认机制:通过计算当前交易量与平均交易量的比率(vol_ratio),确保只在交易量显著高于平均水平时入场,这有助于确认价格反转的可能性和强度。
-
多时间框架分析:可选择性地引入更高时间框架的确认,确保交易方向与更大趋势保持一致,避免逆势交易。
-
波动率过滤器:使用归一化ATR指标来衡量当前市场波动性,避免在极端波动条件下交易,同时布林带宽度提供了当前波动性的可视化指示。
入场条件精确定义:只有当价格突破布林带、RSI处于超买/超卖区域、交易量高于阈值、符合高时间框架趋势方向(如果启用),且市场波动性在可接受范围内时,才会触发交易信号。
策略优势
深入分析该策略的代码实现,可以总结出以下显著优势:
-
自适应性强:策略能够根据市场波动性自动调整参数,使其在不同市场环境中保持有效。这种自适应机制降低了参数优化的需求,提高了策略的稳健性。
-
多重确认机制:结合价格、动量(RSI)、交易量和波动率多个维度的分析,大大减少了假信号,提高了交易质量。
-
风险管理完善:通过设置明确的止损条件和波动率过滤器,有效控制每笔交易的风险暴露。当价格突破移动平均线或RSI回到中性区域时,系统会自动平仓。
-
可视化功能丰富:策略提供清晰的买卖信号标记和信息面板,显示关键指标数据,便于交易者实时监控和分析市场状况。
-
高度可定制:提供多个可调整参数,使交易者能够根据不同的交易品种、时间框架和个人风险偏好进行优化调整。
-
整合多时间框架分析:通过考虑更高时间框架的趋势方向,避免与主要趋势对抗,提高了交易成功率。
策略风险
尽管该策略设计全面,但仍存在一些潜在风险和局限性:
-
均值回归假设风险:策略基于价格最终会回归均值的假设,但在强趋势市场中,价格可能会持续偏离均值较长时间,导致过早入场或止损频繁触发。
-
参数敏感性:尽管有自适应机制,但初始参数设置(如移动平均线周期、布林带乘数、RSI长度等)的选择仍会显著影响策略表现。不当的参数设置可能导致过度交易或错过重要机会。
-
交易量分析的局限性:在某些市场或特定时期,交易量可能不是价格运动的可靠指标。例如,在低流动性环境中,少量交易就可能导致交易量比率异常高。
-
波动率阈值固定问题:尽管策略使用归一化ATR作为波动率过滤器,但0.03的固定阈值可能不适用于所有市场环境。
-
多时间框架滞后性:使用更高时间框架确认可能引入滞后性,有时会错过最佳入场点。
针对这些风险,可以采取以下缓解措施:
- 在不同市场条件下测试和优化参数
- 结合其他技术指标或基本面分析
- 实施更复杂的动态风险管理系统
- 开发自适应的波动率阈值机制
策略优化方向
基于代码分析,该策略可以在以下几个方向进行优化和扩展:
-
动态波动率阈值:将固定的0.03 ATR阈值改为基于历史波动率分布的自适应阈值,使策略能更好地适应不同市场环境的波动特征。这样可以避免在高波动性环境中过度保守或在低波动性环境中过度激进。
-
改进止损机制:当前的止损设置相对简单(价格突破移动平均线或RSI达到特定水平)。可以引入基于ATR的动态止损或追踪止损,更有效地保护利润并管理风险。
-
交易量分析细化:可以引入交易量模式识别,如筛选出具有特定形态的交易量峰值,或分析买卖交易量的不平衡,提供更准确的反转信号确认。
-
市场状态分类:开发一个市场状态分类系统,将市场环境分为趋势、震荡、高波动等不同状态,并针对不同状态调整策略参数或甚至启用不同的交易逻辑。
-
机器学习整合:利用机器学习算法动态优化参数或预测最佳入场点,可以显著提高策略的适应性和性能。
-
加入基本面过滤器:在关键经济数据发布或重大事件前后暂停交易,避免因基本面冲击导致的异常市场行为带来的风险。
-
多品种相关性分析:引入相关资产的价格行为作为额外的确认信号,特别是对于具有高度相关性的市场。
这些优化不仅可以提高策略的稳健性和盈利能力,还能够使其适应更广泛的市场环境和交易品种。
总结
多时间框架适应性均值回归与交易量分析策略是一个设计精良的量化交易系统,它通过结合多种技术指标和分析维度,创建了一个全面而稳健的交易框架。策略的主要优势在于其自适应性和多重确认机制,这使其能够在不同的市场环境中保持有效。
尽管存在一些固有的风险和局限性,但通过提出的优化方向,这些问题可以得到有效缓解。该策略适合具有一定技术分析基础的交易者,特别是那些希望在震荡市场中捕捉短期价格回归机会的投资者。
最终,该策略的成功实施不仅依赖于代码本身的质量,还取决于交易者对市场的理解和参数的合理调整。通过持续的回测、优化和风险管理,这个策略可以成为一个强大的交易工具,帮助交易者在复杂多变的市场环境中取得稳定收益。 ||
Overview
The Multi-Timeframe Adaptive Mean Reversion with Volume Analysis Strategy is an advanced quantitative trading approach that combines technical indicators with volume confirmation. Building upon traditional mean reversion trading concepts, this strategy introduces innovative elements such as adaptive parameter settings, volume confirmation, multi-timeframe analysis, and volatility filters to significantly enhance the accuracy and robustness of trading decisions. The core idea is to identify areas of market overextension or contraction and capture mean reversion opportunities when supported by sufficient trading volume.
Strategy Principles
The strategy operates based on the synergistic action of several key components:
-
Moving Averages and Bollinger Bands: Utilizes Simple Moving Average (SMA) as a central reference point for price, combined with standard deviation to calculate upper and lower Bollinger Bands to identify price deviation levels.
-
Adaptive RSI Indicator: Dynamically adjusts RSI overbought and oversold thresholds based on market volatility. In highly volatile markets, the system automatically adjusts the overbought/oversold ranges, making the strategy adaptable to different market environments.
-
Volume Confirmation Mechanism: Calculates the ratio of current volume to average volume (vol_ratio), ensuring entries only when volume is significantly higher than average, which helps confirm the probability and strength of price reversals.
-
Multi-Timeframe Analysis: Optionally incorporates confirmation from higher timeframes, ensuring trade direction aligns with larger trends and avoiding counter-trend trading.
-
Volatility Filter: Uses normalized ATR to measure current market volatility, avoiding trading in extreme volatility conditions, while Bollinger Band width provides visual indication of current volatility.
Entry conditions are precisely defined: trading signals are triggered only when price breaks through Bollinger Bands, RSI is in overbought/oversold territory, volume is above the threshold, aligns with higher timeframe trend direction (if enabled), and market volatility is within an acceptable range.
Strategy Advantages
Deep analysis of the strategy's code implementation reveals the following significant advantages:
-
Strong Adaptability: The strategy automatically adjusts parameters based on market volatility, maintaining effectiveness across different market environments. This adaptive mechanism reduces the need for parameter optimization and improves strategy robustness.
-
Multiple Confirmation Mechanisms: Combining analysis across multiple dimensions including price, momentum (RSI), volume, and volatility greatly reduces false signals and improves trade quality.
-
Comprehensive Risk Management: Effectively controls risk exposure per trade through clear stop-loss conditions and volatility filters. The system automatically closes positions when price crosses the moving average or RSI returns to neutral territory.
-
Rich Visualization Features: Provides clear buy/sell signal markers and an information panel displaying key metric data, facilitating real-time monitoring and market condition analysis.
-
Highly Customizable: Offers multiple adjustable parameters, allowing traders to optimize according to different trading instruments, timeframes, and personal risk preferences.
-
Integrated Multi-Timeframe Analysis: Considers higher timeframe trend direction to avoid fighting against major trends, increasing the success rate of trades.
Strategy Risks
Despite its comprehensive design, the strategy still presents some potential risks and limitations:
-
Mean Reversion Assumption Risk: The strategy is based on the assumption that prices will eventually revert to their mean, but in strong trending markets, prices may continue to deviate from the mean for extended periods, leading to premature entries or frequent stop-loss triggers.
-
Parameter Sensitivity: Despite adaptive mechanisms, initial parameter settings (such as moving average period, Bollinger Band multiplier, RSI length) still significantly impact strategy performance. Inappropriate parameter settings may lead to overtrading or missing important opportunities.
-
Limitations of Volume Analysis: In certain markets or specific periods, volume may not be a reliable indicator of price movement. For example, in low liquidity environments, small trades can cause abnormally high volume ratios.
-
Fixed Volatility Threshold Issue: Although the strategy uses normalized ATR as a volatility filter, the fixed threshold of 0.03 may not be suitable for all market environments.
-
Multi-Timeframe Lag: Using higher timeframe confirmation may introduce lag, sometimes missing optimal entry points.
To mitigate these risks, the following measures can be taken:
- Test and optimize parameters under different market conditions
- Combine with other technical indicators or fundamental analysis
- Implement more sophisticated dynamic risk management systems
- Develop adaptive volatility threshold mechanisms
Strategy Optimization Directions
Based on code analysis, the strategy can be optimized and extended in the following directions:
-
Dynamic Volatility Threshold: Replace the fixed 0.03 ATR threshold with an adaptive threshold based on historical volatility distribution, allowing the strategy to better adapt to the volatility characteristics of different market environments. This prevents excessive conservatism in high-volatility environments or excessive aggressiveness in low-volatility environments.
-
Improved Stop-Loss Mechanism: The current stop-loss setup is relatively simple (price crossing the moving average or RSI reaching specific levels). Introducing ATR-based dynamic stop-losses or trailing stops could more effectively protect profits and manage risk.
-
Refined Volume Analysis: Incorporate volume pattern recognition, such as filtering for volume peaks with specific formations, or analyzing imbalances between buying and selling volume to provide more accurate reversal signal confirmation.
-
Market State Classification: Develop a market state classification system that categorizes market environments into trending, oscillating, high volatility, etc., and adjusts strategy parameters or even enables different trading logic for different states.
-
Machine Learning Integration: Utilize machine learning algorithms to dynamically optimize parameters or predict optimal entry points, significantly improving strategy adaptability and performance.
-
Addition of Fundamental Filters: Pause trading before and after key economic data releases or major events to avoid risks from abnormal market behavior caused by fundamental shocks.
-
Multi-Instrument Correlation Analysis: Introduce price behavior of related assets as additional confirmation signals, especially for highly correlated markets.
These optimizations can not only improve the strategy's robustness and profitability but also enable it to adapt to a wider range of market environments and trading instruments.
Conclusion
The Multi-Timeframe Adaptive Mean Reversion with Volume Analysis Strategy is a well-designed quantitative trading system that creates a comprehensive and robust trading framework by combining multiple technical indicators and analytical dimensions. The strategy's main advantages lie in its adaptability and multiple confirmation mechanisms, allowing it to remain effective across different market environments.
Despite some inherent risks and limitations, these issues can be effectively mitigated through the proposed optimization directions. This strategy is suitable for traders with a foundation in technical analysis, particularly those looking to capture short-term price reversion opportunities in oscillating markets.
Ultimately, successful implementation of this strategy depends not only on the quality of the code itself but also on the trader's understanding of the market and reasonable parameter adjustments. Through continuous backtesting, optimization, and risk management, this strategy can become a powerful trading tool, helping traders achieve stable returns in complex and changing market environments.[/trans]
Source (PineScript)
/*backtest
start: 2025-01-01 00:00:00
end: 2025-04-01 00:00:00
period: 1h
basePeriod: 1h
exchanges: [{"eid":"Futures_Binance","currency":"BTC_USDT"}]
*/

//@version=5
strategy("Mean Reversion with Volume Analysis", overlay=true)

// Parameters
length = input.int(20, "MA Period", minval=1)
bb_mult = input.float(2.0, "Bollinger Band Multiplier", minval=0.1, step=0.1)
rsi_length = input.int(14, "RSI Period", minval=1)
rsi_oversold = input.int(30, "RSI Oversold", minval=1, maxval=100)
rsi_overbought = input.int(70, "RSI Overbought", minval=1, maxval=100)
vol_threshold = input.float(1.5, "Volume Threshold", minval=0.1, step=0.1)
atr_period = input.int(14, "ATR Period", minval=1)
use_higher_tf = input.bool(true, "Use Higher Timeframe Confirmation")
higher_tf = input.timeframe("D", "Higher Timeframe")

// Moving Average and Bollinger Bands
sma = ta.sma(close, length)
stdev = ta.stdev(close, length)
upper_band = sma + bb_mult * stdev
lower_band = sma - bb_mult * stdev
bb_width = (upper_band - lower_band) / sma

// RSI
rsi = ta.rsi(close, rsi_length)

// Volume Analysis
vol_sma = ta.sma(volume, length)
vol_ratio = volume / vol_sma

// ATR for volatility filter and position sizing
atr = ta.atr(atr_period)
normalized_atr = atr / close

// Higher Timeframe Confirmation
higher_rsi = request.security(syminfo.tickerid, higher_tf, ta.rsi(close, rsi_length))
higher_sma = request.security(syminfo.tickerid, higher_tf, ta.sma(close, length))
higher_trend = close > higher_sma ? 1 : close < higher_sma ? -1 : 0

// Adaptive Parameters based on market volatility
dynamic_rsi_oversold = 30 + math.floor(10 * normalized_atr)
dynamic_rsi_overbought = 70 - math.floor(10 * normalized_atr)

// Entry Conditions
long_condition = close < lower_band and
                 rsi < (use_higher_tf ? math.min(rsi_oversold, dynamic_rsi_oversold) : rsi_oversold) and
                 vol_ratio > vol_threshold and
                 (use_higher_tf ? higher_trend >= 0 : true) and
                 normalized_atr < 0.03  // Volatility filter

short_condition = close > upper_band and
                  rsi > (use_higher_tf ? math.max(rsi_overbought, dynamic_rsi_overbought) : rsi_overbought) and
                  vol_ratio > vol_threshold and
                  (use_higher_tf ? higher_trend <= 0 : true) and
                  normalized_atr < 0.03  // Volatility filter

// Exit Conditions
exit_long = close > sma or rsi > 60 or close < lower_band * 0.95  // Stop loss
exit_short = close < sma or rsi < 40 or close > upper_band * 1.05  // Stop loss

// Strategy Execution
if (long_condition)
    strategy.entry("Long", strategy.long)

if (short_condition)
    strategy.entry("Short", strategy.short)

if (strategy.position_size > 0 and exit_long)
    strategy.close("Long")

if (strategy.position_size < 0 and exit_short)
    strategy.close("Short")

// Plotting
plot(sma, "SMA", color=color.blue)
plot(upper_band, "Upper Band", color=color.red)
plot(lower_band, "Lower Band", color=color.green)

// Signals for visualization
plotshape(long_condition, "Buy Signal", shape.triangleup, location.belowbar, color.green, size=size.small)
plotshape(short_condition, "Sell Signal", shape.triangledown, location.abovebar, color.red, size=size.small)

// Info panel
var table info = table.new(position.top_right, 3, 5, color.black, color.white, 1, color.gray, 1)
table.cell(info, 0, 0, "RSI", text_color=color.white)
table.cell(info, 1, 0, str.tostring(rsi, "#.##"), text_color=rsi < rsi_oversold ? color.green : rsi > rsi_overbought ? color.red : color.white)
table.cell(info, 0, 1, "BB Width", text_color=color.white)
table.cell(info, 1, 1, str.tostring(bb_width, "#.###"), text_color=color.white)
table.cell(info, 0, 2, "Vol Ratio", text_color=color.white)
table.cell(info, 1, 2, str.tostring(vol_ratio, "#.##"), text_color=vol_ratio > vol_threshold ? color.green : color.white)
table.cell(info, 0, 3, "ATR %", text_color=color.white)
table.cell(info, 1, 3, str.tostring(normalized_atr * 100, "#.##") + "%", text_color=color.white)
Detail
https://www.fmz.com/strategy/489160
Last Modified
2025-04-02 11:39:54