
18 KiB
Name
多时间框架趋势追踪与ATR波动率动态风险管理系统策略-Multi-Timeframe-Trend-Following-with-ATR-Volatility-Based-Dynamic-Risk-Management-System-Strategy
Author
ianzeng123
Strategy Description
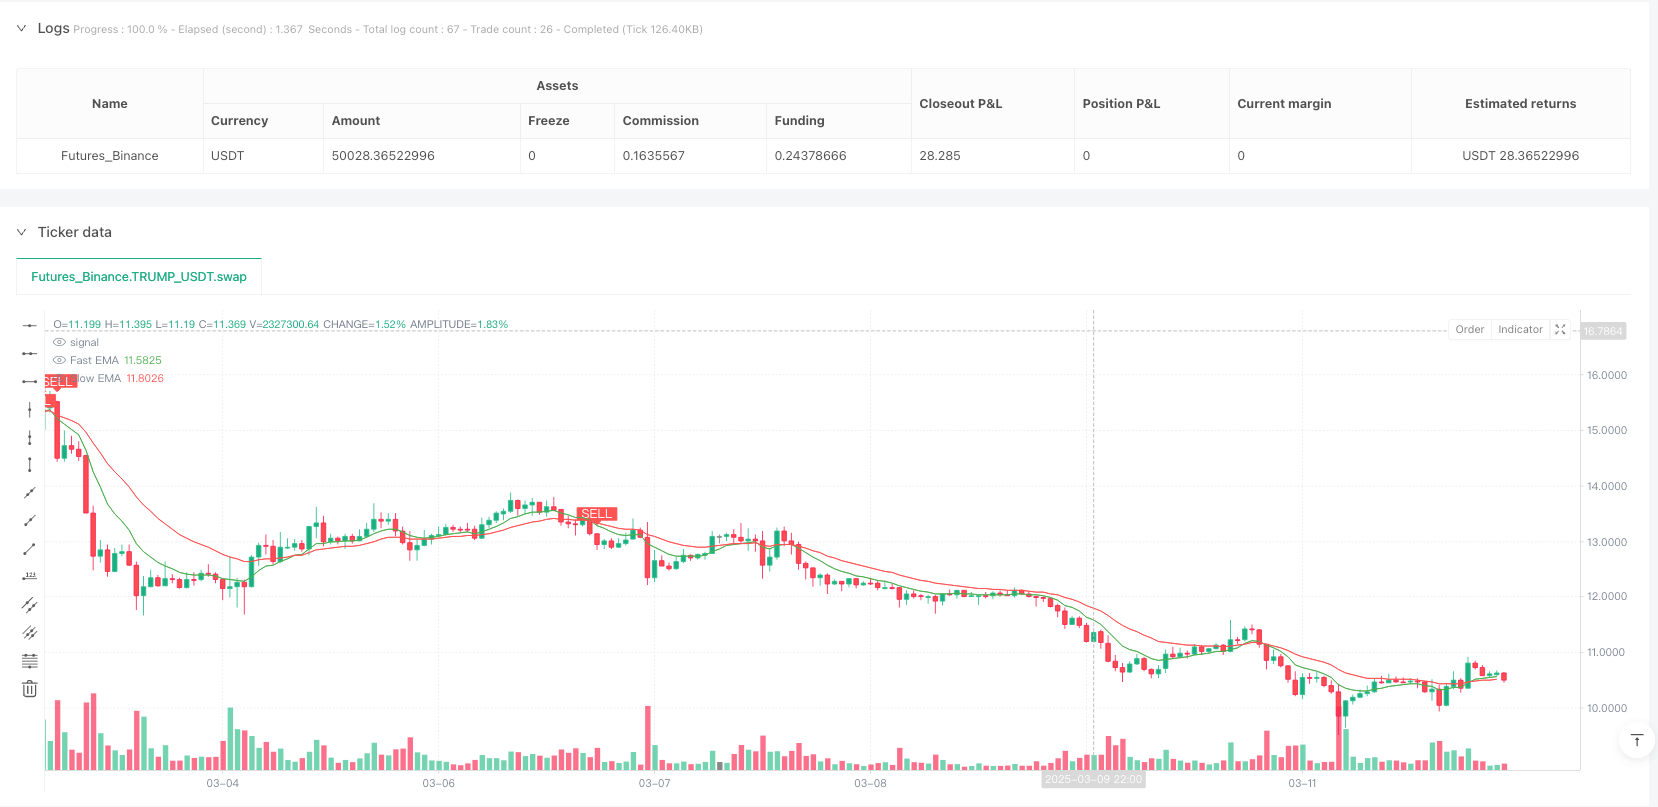
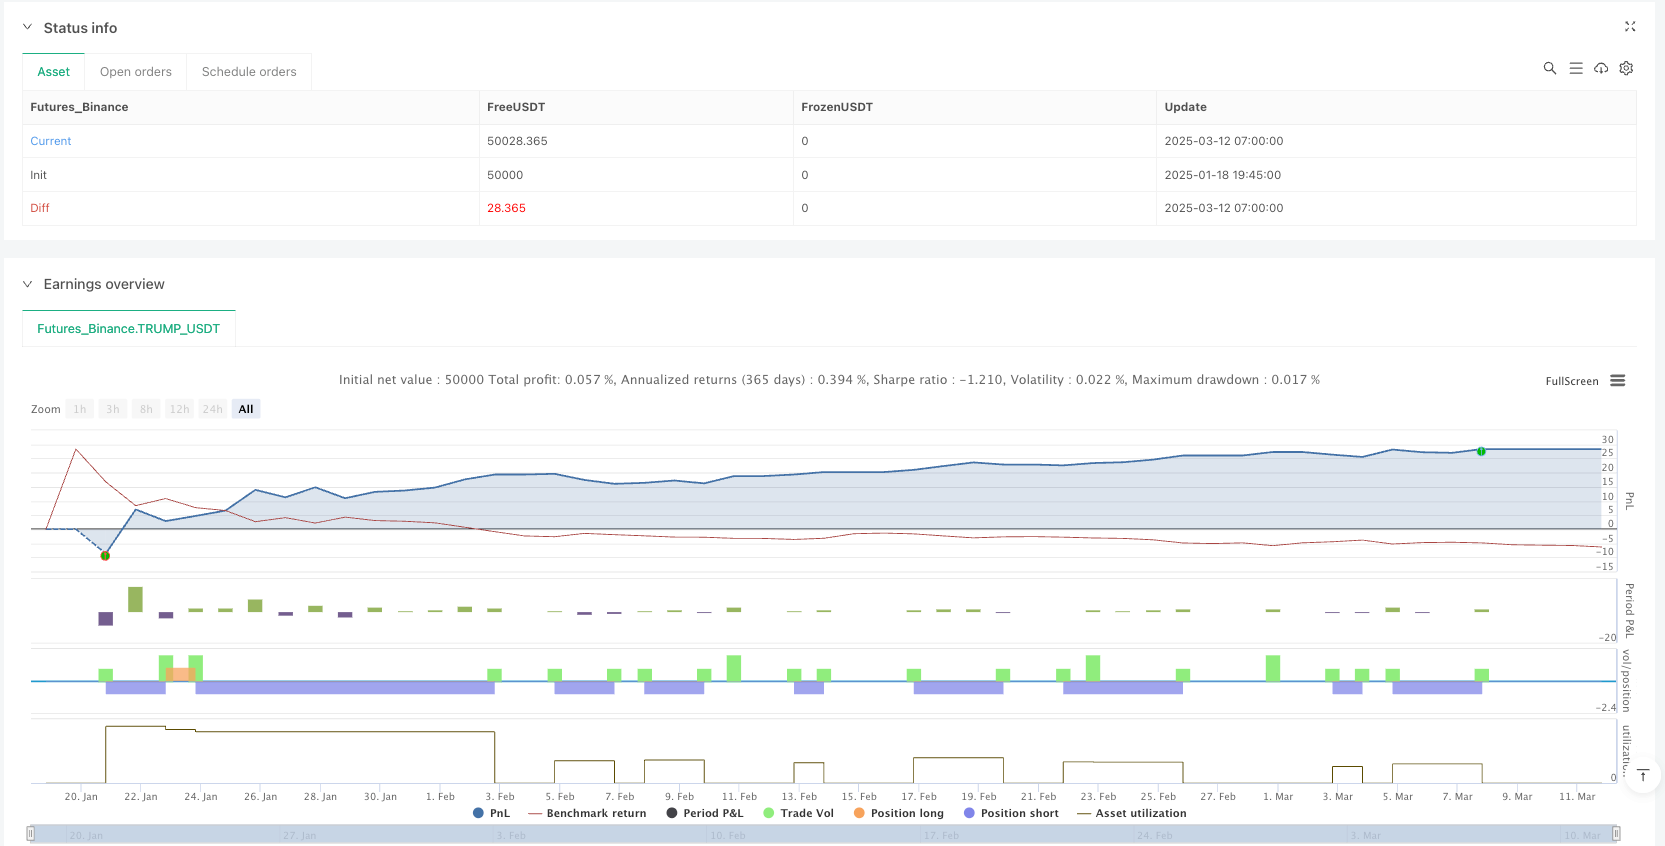
[trans]## 概述
该策略是一个结合了多重技术指标和多时间框架分析的综合交易系统,旨在捕捉市场趋势变化并同时管理风险。该策略基于快速与慢速指数移动平均线(EMA)的交叉作为主要入场信号,并使用相对强弱指数(RSI)和移动平均线收敛/发散指标(MACD)作为过滤条件,以确保只在强劲趋势形成时进行交易。同时,该策略巧妙地利用真实波动幅度均值(ATR)来动态设置止损和获利目标,使风险管理根据市场波动性自动调整。此外,该策略还纳入了更高时间框架的趋势确认,以避免逆势交易,提高交易成功率。
策略原理
该策略的核心原理是利用不同时间段的移动平均线交叉信号来识别潜在的趋势转变点,并通过额外的技术指标进行确认。具体来说:
-
使用9周期和21周期的EMA来识别短期趋势变化,当快速EMA上穿慢速EMA时产生做多信号,反之则产生做空信号。
-
利用RSI指标确保我们不会在过度超买或超卖的市场中入场,对于多头交易,RSI必须大于30;对于空头交易,RSI必须小于70。
-
应用MACD指标作为趋势强度的额外确认,要求MACD线在多头信号时大于信号线,空头信号时小于信号线。
-
纳入15分钟时间框架的趋势过滤器,通过检查价格是否位于50周期简单移动平均线(SMA)之上,确保只在更大时间框架趋势有利的情况下才进行多头交易。
-
使用ATR指标来动态设置止损和获利目标,止损设为当前价格正负2倍ATR值,而获利目标则基于用户定义的风险回报比(默认为3.0),确保风险管理适应当前市场波动性。
该策略的一个重要特点是使用strategy.exit()函数来正确管理止损和获利目标,确保每笔交易都有预定义的风险限制和利润目标。
策略优势
-
多指标确认系统:该策略结合了多个技术指标(EMA, RSI, MACD)进行交易确认,这大大降低了假信号的可能性,提高了入场点的质量。
-
多时间框架分析:通过整合15分钟时间框架的趋势方向作为过滤条件,该策略有效避免了逆势交易,遵循"顺势而为"的交易原则。
-
自适应风险管理:基于ATR的动态止损和获利目标设置使风险控制能够根据市场波动性自动调整,在低波动市场中设置更紧的止损,在高波动市场中给予价格更多的呼吸空间。
-
固定风险回报比:预设的风险回报比确保每笔交易的潜在回报至少是风险的几倍,这对于长期盈利至关重要。
-
清晰的视觉反馈:策略在图表上绘制了EMA线和交易信号标记,使交易者能够直观理解系统的决策过程。
-
警报功能:集成的警报条件允许交易者在策略发出信号时及时获得通知,便于实时交易执行。
-
参数可调性:通过允许用户调整各指标的周期和风险回报比,该策略提供了高度的灵活性,可以适应不同的交易风格和市场条件。
策略风险
-
假信号风险:尽管使用了多重指标确认,在高度波动或区间震荡的市场中,仍可能产生错误信号。解决方法是在明显的区间市场中暂停使用该策略,或增加额外的区间识别指标。
-
滑点风险:在低流动性或高波动市场中,实际执行价格可能与信号产生时的价格有较大差异。可以通过调整ATR乘数来增加止损距离,以适应更高的市场波动。
-
参数优化过度:过度优化特定历史数据的参数可能导致策略在未来表现不佳。建议通过不同市场和时间段的回测来验证参数的稳健性。
-
趋势反转风险:策略依赖于趋势的持续,可能无法及时识别重大趋势反转。可以考虑添加逆转指标或波动率突破指标来更快地识别趋势变化。
-
连续亏损风险:任何交易系统都可能经历连续亏损期,特别是在市场条件变化时。必须实施严格的资金管理,确保单笔交易风险不超过总资金的固定百分比。
-
过滤器过于严格:多重条件确认可能导致错过一些好的交易机会。可以考虑根据市场状态动态调整过滤条件的严格程度。
策略优化方向
-
动态调整EMA周期:当前策略使用固定的9和21周期EMA,可以考虑基于市场波动性或当前趋势强度动态调整这些参数,以更好地适应不同市场环境。
-
改进趋势过滤器:当前的15分钟时间框架趋势过滤器相对简单,可以考虑使用更复杂的趋势识别算法,如Supertrend指标或者多级时间框架确认系统。
-
优化资金管理:实现一个基于账户余额和ATR的动态头寸大小计算系统,确保每笔交易风险一致且适当。
-
添加市场状态识别:整合市场环境分析功能,自动识别趋势市场和区间市场,并根据不同市场状态调整策略参数或暂停交易。
-
实现部分获利机制:可以设计分段获利系统,允许在达到特定利润水平时锁定部分利润,同时给剩余头寸更多空间捕捉更大的走势。
-
定期重新评估止损位:考虑实现移动止损功能,随着交易向有利方向发展,逐步调整止损位置,保护已获利润。
-
整合基本面过滤器:对于特定资产类别,可以添加基本面指标或事件过滤器,避免在重大经济数据发布或其他高不确定性事件期间交易。
总结
多时间框架趋势追踪与ATR波动率动态风险管理系统策略是一个设计完善的量化交易系统,它通过整合多个技术指标、多时间框架分析和自适应风险管理功能,提供了一个全面的交易解决方案。该策略特别关注风险控制,使用ATR来动态设置止损和获利目标,确保风险管理能够适应当前市场条件。
该策略的优势在于其多层确认机制和严格的风险管理,但也存在参数优化过度和市场状态识别不足等潜在风险。通过实施建议的优化措施,如动态调整参数、改进趋势过滤器和实现更复杂的资金管理系统,该策略可以进一步增强其适应性和稳健性。
对于寻求系统化、规则驱动交易方法的交易者来说,这个策略提供了一个坚实的起点。它不仅包含明确的入场和出场规则,还强调风险管理的重要性,这是长期交易成功的关键因素。通过持续监控、评估和优化,该策略可以成为交易者工具箱中的有价值资产。 || ## Overview
This strategy is a comprehensive trading system that combines multiple technical indicators and multi-timeframe analysis, designed to capture market trend changes while managing risk. The strategy is based on the crossover of fast and slow Exponential Moving Averages (EMAs) as the primary entry signal, and uses the Relative Strength Index (RSI) and Moving Average Convergence/Divergence (MACD) as filtering conditions to ensure trades are only taken when strong trends are forming. Simultaneously, the strategy cleverly utilizes the Average True Range (ATR) to dynamically set stop-loss and take-profit targets, allowing risk management to automatically adjust based on market volatility. Additionally, the strategy incorporates higher timeframe trend confirmation to avoid counter-trend trading and improve trade success rates.
Strategy Principles
The core principle of this strategy is to use moving average crossover signals from different time periods to identify potential trend reversal points, with additional technical indicators for confirmation. Specifically:
-
Uses 9-period and 21-period EMAs to identify short-term trend changes, generating a long signal when the fast EMA crosses above the slow EMA, and vice versa for a short signal.
-
Utilizes the RSI indicator to ensure we don't enter markets that are excessively overbought or oversold, requiring RSI to be above 30 for long trades and below 70 for short trades.
-
Applies the MACD indicator as additional confirmation of trend strength, requiring the MACD line to be above the signal line for long signals and below for short signals.
-
Incorporates a 15-minute timeframe trend filter by checking if the price is above the 50-period Simple Moving Average (SMA), ensuring long trades are only taken when the larger timeframe trend is favorable.
-
Uses the ATR indicator to dynamically set stop-loss and take-profit targets, with stops set at 2 times the ATR value from the current price, and profit targets based on a user-defined risk-reward ratio (default 3.0), ensuring risk management adapts to current market volatility.
A key feature of this strategy is the use of the strategy.exit() function to properly manage stop-loss and take-profit targets, ensuring each trade has predefined risk limits and profit objectives.
Strategy Advantages
-
Multi-indicator Confirmation System: The strategy combines multiple technical indicators (EMA, RSI, MACD) for trade confirmation, greatly reducing the possibility of false signals and improving the quality of entry points.
-
Multi-timeframe Analysis: By integrating the 15-minute timeframe trend direction as a filter, the strategy effectively avoids counter-trend trading, following the principle of "trading with the trend."
-
Adaptive Risk Management: ATR-based dynamic stop-loss and take-profit target setting allows risk control to automatically adjust based on market volatility, setting tighter stops in low-volatility markets and giving prices more breathing room in high-volatility markets.
-
Fixed Risk-Reward Ratio: The preset risk-reward ratio ensures that the potential return for each trade is at least several times the risk, which is critical for long-term profitability.
-
Clear Visual Feedback: The strategy plots EMA lines and trade signal markers on the chart, allowing traders to visually understand the system's decision-making process.
-
Alert Functionality: Integrated alert conditions allow traders to receive timely notifications when the strategy signals, facilitating real-time trade execution.
-
Parameter Adjustability: By allowing users to adjust the periods of various indicators and the risk-reward ratio, the strategy offers a high degree of flexibility that can adapt to different trading styles and market conditions.
Strategy Risks
-
False Signal Risk: Despite using multiple indicator confirmations, false signals may still occur in highly volatile or range-bound markets. The solution is to pause the use of this strategy in obvious range-bound markets or add additional range identification indicators.
-
Slippage Risk: In low-liquidity or high-volatility markets, actual execution prices may differ significantly from the price when the signal is generated. This can be addressed by adjusting the ATR multiplier to increase stop distance to accommodate higher market volatility.
-
Parameter Over-optimization: Excessive optimization of parameters for specific historical data may lead to poor strategy performance in the future. It is recommended to validate parameter robustness through backtesting across different markets and time periods.
-
Trend Reversal Risk: The strategy relies on trend continuation and may not identify major trend reversals in a timely manner. Consider adding reversal indicators or volatility breakout indicators to identify trend changes more quickly.
-
Consecutive Loss Risk: Any trading system may experience periods of consecutive losses, especially when market conditions change. Strict money management must be implemented to ensure that single trade risk does not exceed a fixed percentage of total capital.
-
Overly Strict Filters: Multiple condition confirmations may cause missed good trading opportunities. Consider dynamically adjusting the strictness of filtering conditions based on market state.
Strategy Optimization Directions
-
Dynamic Adjustment of EMA Periods: The current strategy uses fixed 9 and 21 period EMAs; consider dynamically adjusting these parameters based on market volatility or current trend strength to better adapt to different market environments.
-
Improved Trend Filter: The current 15-minute timeframe trend filter is relatively simple; consider using more complex trend identification algorithms, such as the Supertrend indicator or multi-level timeframe confirmation systems.
-
Optimized Money Management: Implement a dynamic position size calculation system based on account balance and ATR, ensuring consistent and appropriate risk for each trade.
-
Add Market State Recognition: Integrate market environment analysis functionality to automatically identify trending and range-bound markets, and adjust strategy parameters or pause trading based on different market states.
-
Implement Partial Profit-Taking Mechanism: Design a staged profit-taking system allowing for securing partial profits when specific profit levels are reached, while giving remaining positions more room to capture larger moves.
-
Periodically Reassess Stop-Loss Positions: Consider implementing a trailing stop feature that gradually adjusts stop positions as trades move in favorable directions, protecting accrued profits.
-
Integrate Fundamental Filters: For specific asset classes, add fundamental indicators or event filters to avoid trading during major economic data releases or other high-uncertainty events.
Summary
The Multi-Timeframe Trend Following with ATR Volatility-Based Dynamic Risk Management System Strategy is a well-designed quantitative trading system that provides a comprehensive trading solution by integrating multiple technical indicators, multi-timeframe analysis, and adaptive risk management functionality. The strategy places particular emphasis on risk control, using ATR to dynamically set stop-loss and take-profit targets, ensuring risk management can adapt to current market conditions.
The strategy's strengths lie in its multi-layered confirmation mechanism and strict risk management, but it also faces potential risks such as parameter over-optimization and insufficient market state recognition. By implementing the suggested optimization measures, such as dynamically adjusting parameters, improving trend filters, and implementing more sophisticated money management systems, the strategy can further enhance its adaptability and robustness.
For traders seeking a systematic, rules-driven trading approach, this strategy provides a solid starting point. It not only contains clear entry and exit rules but also emphasizes the importance of risk management, a key factor for long-term trading success. Through continuous monitoring, evaluation, and optimization, this strategy can become a valuable asset in a trader's toolkit.[/trans]
Source (PineScript)
/*backtest
start: 2025-01-18 19:45:00
end: 2025-03-12 08:00:00
period: 1h
basePeriod: 1h
exchanges: [{"eid":"Futures_Binance","currency":"TRUMP_USDT"}]
*/

//@version=5
strategy("Samstrategy", overlay=true)

// Input parameters for the strategy
fastLength = input.int(9, title="Fast EMA Length")
slowLength = input.int(21, title="Slow EMA Length")
atrLength = input.int(14, title="ATR Length")
rsiLength = input.int(14, title="RSI Length")
macdFast = input.int(12, title="MACD Fast Length")
macdSlow = input.int(26, title="MACD Slow Length")
macdSignal = input.int(9, title="MACD Signal Length")
riskReward = input.float(3.0, title="Risk/Reward Ratio")

// Calculate indicators
fastEMA = ta.ema(close, fastLength)
slowEMA = ta.ema(close, slowLength)
atrValue = ta.atr(atrLength)
rsi = ta.rsi(close, rsiLength)
[macdLine, signalLine, _] = ta.macd(close, macdFast, macdSlow, macdSignal)

// Higher timeframe trend filter
higherTimeframeTrend = request.security(syminfo.tickerid, "15", close > ta.sma(close, 50))

// Define conditions for Buy and Sell signals
longCondition = ta.crossover(fastEMA, slowEMA) and close > fastEMA and rsi > 30 and macdLine > signalLine and higherTimeframeTrend
shortCondition = ta.crossunder(fastEMA, slowEMA) and close < fastEMA and rsi < 70 and macdLine < signalLine and not higherTimeframeTrend

// Define Stop Loss and Take Profit levels based on ATR
longStopLoss = close - atrValue * 2
longTakeProfit = close + atrValue * riskReward

shortStopLoss = close + atrValue * 2
shortTakeProfit = close - atrValue * riskReward

// Plotting the EMAs on the chart
plot(fastEMA, color=color.green, title="Fast EMA")
plot(slowEMA, color=color.red, title="Slow EMA")

// Plotting Buy and Sell signals
plotshape(longCondition, style=shape.labelup, text="BUY", textcolor=color.white, color=color.green, location=location.belowbar)
plotshape(shortCondition, style=shape.labeldown, text="SELL", textcolor=color.white, color=color.red, location=location.abovebar)

// Entry and exit conditions
if (longCondition)
    strategy.entry("Long", strategy.long)

if (shortCondition)
    strategy.entry("Short", strategy.short)

// Set exit conditions
if (strategy.position_size > 0) // Long position
    strategy.exit("Take Profit/Stop Loss", from_entry="Long", limit=longTakeProfit, stop=longStopLoss)

if (strategy.position_size < 0) // Short position
    strategy.exit("Take Profit/Stop Loss", from_entry="Short", limit=shortTakeProfit, stop=shortStopLoss)

// Alerts
alertcondition(longCondition, title="Long Signal", message="Enter Long Trade")
alertcondition(shortCondition, title="Short Signal", message="Enter Short Trade")
Detail
https://www.fmz.com/strategy/486562
Last Modified
2025-03-14 09:20:46