
18 KiB
Name
多时间框架融合型动量捕捉自动交易策略-Multi-Timeframe-Momentum-Confluence-Automated-Trading-Strategy
Author
ianzeng123
Strategy Description
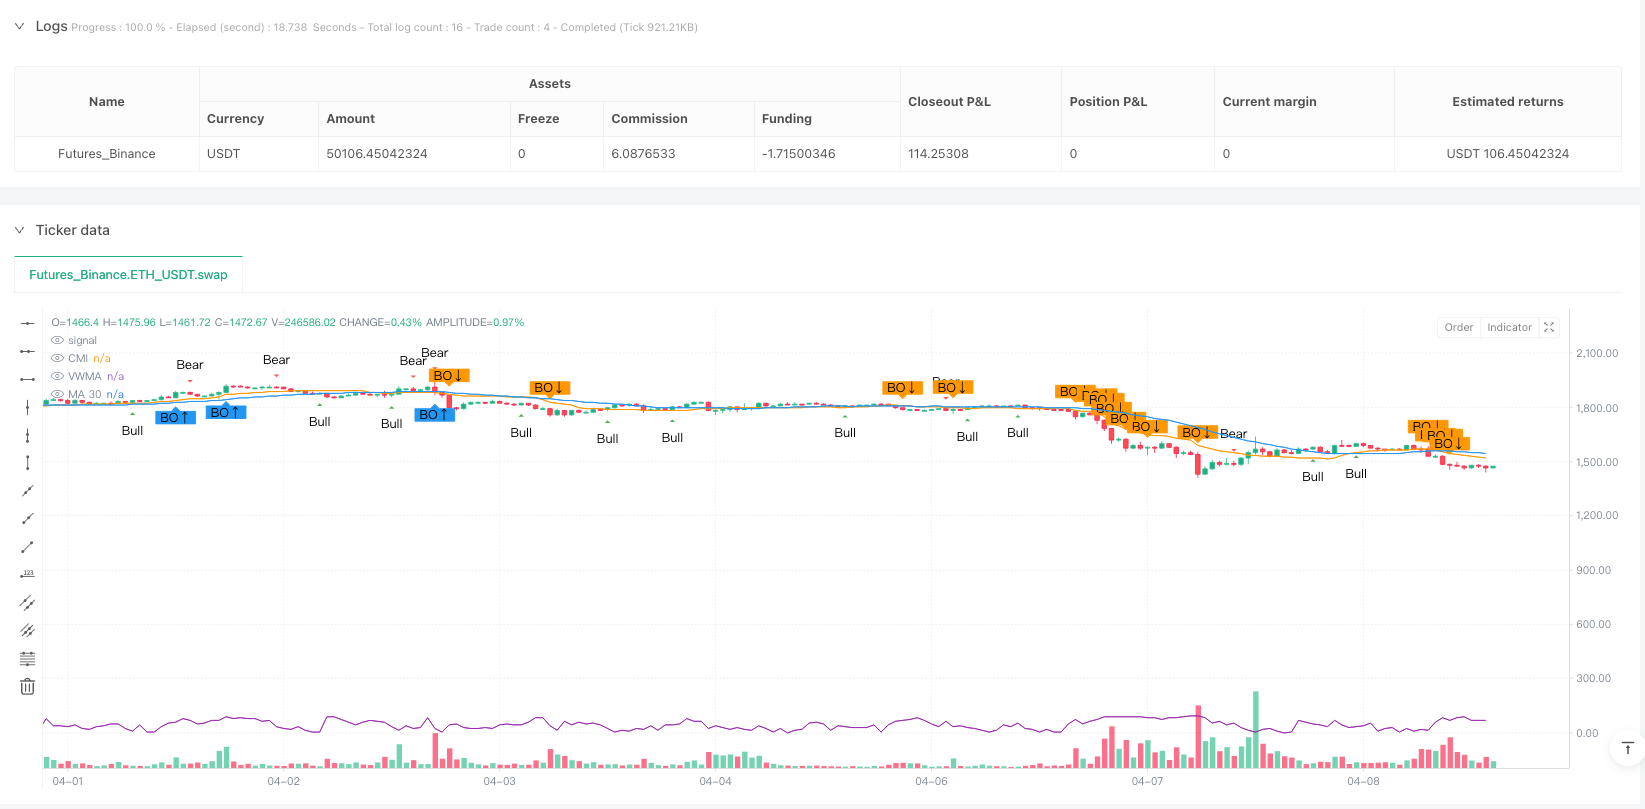
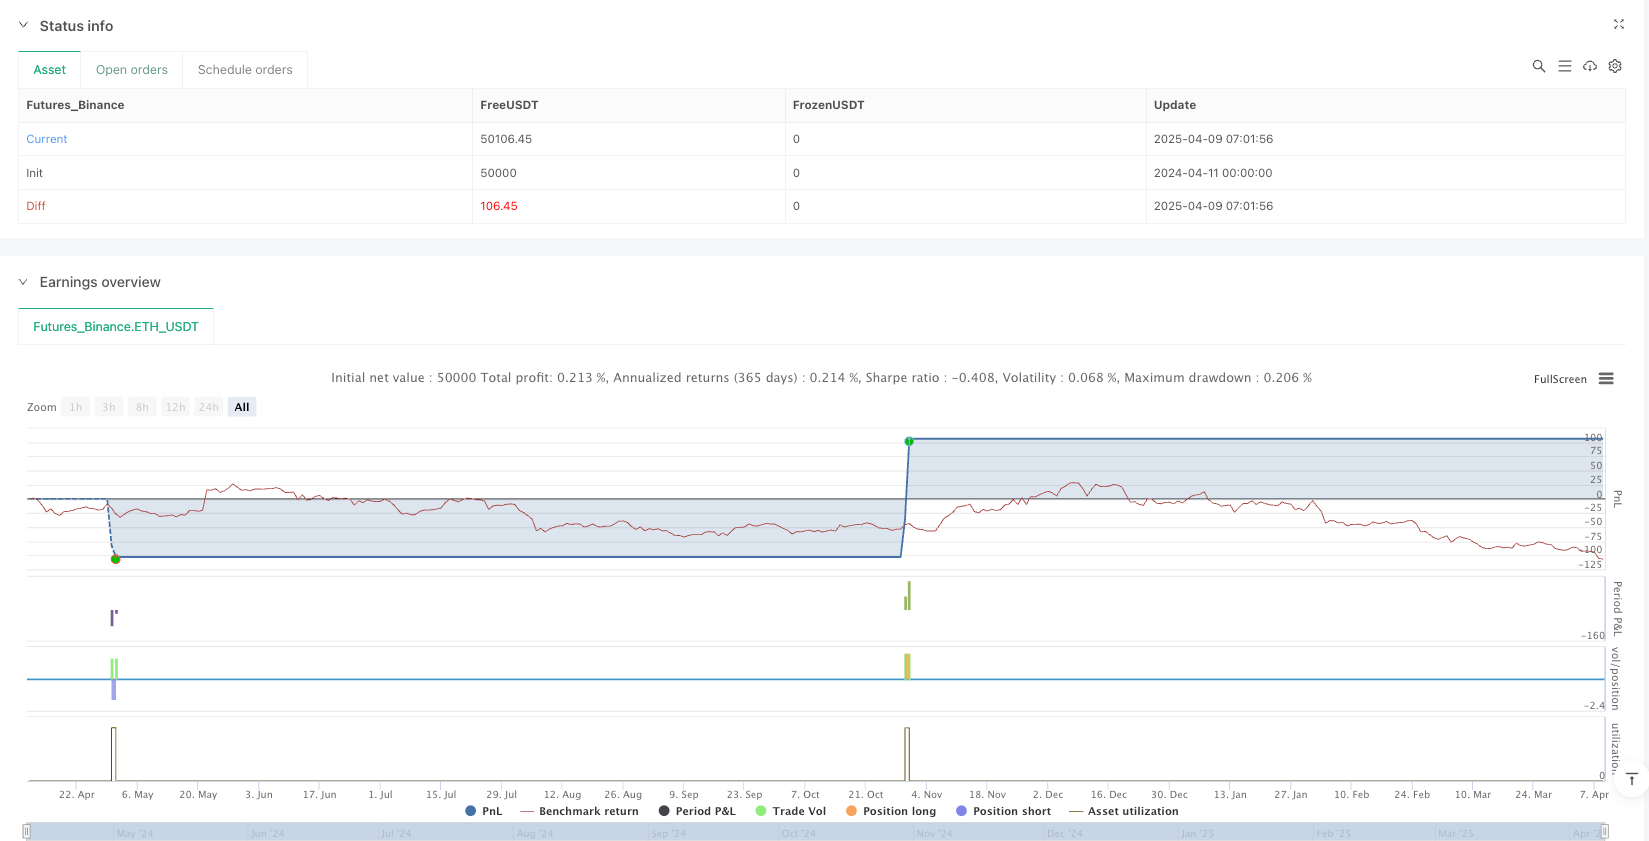
[trans]
概述
该策略是一个综合性的交易系统,利用多时间框架分析、技术指标融合和形态识别来寻找高概率交易机会。其核心理念是通过分析五个不同时间框架(1分钟、5分钟、15分钟、1小时和4小时)的趋势一致性,结合成交量突破、吞没形态和动量指标,以精确捕捉市场动向。该策略同时内置自动止盈止损机制,根据市场波动性动态调整风险管理参数。
策略原理
策略核心基于以下几个关键组件:
-
多时间框架趋势分析:策略首先通过自定义函数
getTrend()分析5个不同时间框架的趋势。在每个时间框架上,系统检查快速EMA是否高于慢速EMA、RSI值是否超过50以及价格是否高于快速EMA来确定做多信号;相反条件则确定做空信号。 -
趋势共识确认:只有当所有五个时间框架显示相同方向的趋势信号时,系统才会考虑入场。这种严格的趋势共识机制大大提高了信号的可靠性。
-
入场条件优化:除了趋势共识外,入场还需满足以下条件:
- 吞没形态(看涨或看跌)确认
- 成交量突破(高于20周期平均成交量的2倍)
- RSI确认(做多时>55,做空时<45)
- 狭义市场指数CMI>30(确保足够的市场动量)
- 价格相对于成交量加权移动平均线(VWMA)的位置确认
-
风险管理系统:策略采用动态止盈止损计算方法,基于最近价格波动(高低价差)设置止损水平,并使用倍数参数(默认为2.0)设置止盈目标。
-
支撑/阻力可视化:系统自动识别并显示重要的支撑和阻力位,通过视觉辅助帮助交易者理解当前市场结构。
策略优势
-
多维信号过滤:通过要求多个技术指标和时间框架的一致性,显著降低了虚假信号的可能性。这种多重确认机制使策略只在高概率设置下触发交易信号。
-
自适应风险管理:止损和止盈水平不是固定的,而是基于当前市场波动性动态计算的,这使策略能够在不同波动条件下保持适当的风险回报比。
-
完整的可视化系统:策略包含全面的视觉辅助工具,包括趋势仪表板、支撑/阻力框、交易信号标记和预测的止盈/止损线,为交易者提供直观的市场分析。
-
成交量确认:通过要求交易信号伴随显著的成交量增加,策略能够识别具有实际动力的市场移动,而不仅仅是价格的随机波动。
-
形态识别整合:吞没形态作为入场条件的一部分,增加了策略的准确性,因为这些蜡烛图形态通常代表市场情绪的显著转变。
策略风险
-
频繁再平衡需求:由于策略依赖于多个时间框架的一致性,交易信号可能相对罕见。在长时间没有交易机会的情况下,交易者可能被诱导降低标准,导致执行不理想的交易。
-
信号依赖性:策略严重依赖于技术指标和形态,在某些市场条件下,如突发新闻事件或极端波动期间,这些信号可能失效或提供误导性指示。
-
过度优化风险:策略使用多个参数和条件,这可能导致历史数据过度优化,而在真实市场条件下表现不佳。需要在足够长的时间框架和不同市场条件下进行彻底的回测。
-
计算复杂性:多时间框架分析和多重指标计算需要大量计算资源,这可能导致某些交易平台上的性能问题或延迟。
-
趋势转变检测延迟:由于策略需要多个时间框架的一致性,它可能在趋势转变的早期阶段错过机会,直到新趋势在所有时间框架上都已确立。
优化方向
-
自适应参数调整:引入机制使EMA长度、RSI阈值和CMI要求根据当前市场波动性或交易时段自动调整,以适应不同的市场状态。
-
时间框架权重系统:不是简单地要求所有时间框架一致,可以实施加权系统,其中较高时间框架的信号具有更大影响,这可能产生更及时的信号,同时保持高质量标准。
-
市场状态分类:添加算法来检测当前市场是处于趋势状态还是区间状态,并相应地调整策略参数。例如,在区间市场中可能需要更高的CMI阈值。
-
机器学习整合:使用机器学习算法优化入场和出场规则,基于历史数据识别最有效的信号组合,并随着新数据的积累不断改进。
-
增强多样化:添加其他无相关性的技术指标,如斐波纳契回撤水平、关键价格水平或市场情绪指标,以提供额外的确认维度。
总结
多时间框架融合型动量捕捉自动交易策略是一个全面的交易系统,通过严格的多重确认机制来识别高概率交易机会。通过结合趋势分析、成交量确认、形态识别和动态风险管理,该策略旨在提供高质量的交易信号,同时管理每笔交易的风险。
虽然该策略的严格条件可能导致交易信号相对较少,但这实际上是其主要优势之一,因为它优先考虑信号质量而非数量。通过建议的优化措施,特别是自适应参数和市场状态分类,策略可以进一步提高其性能和适应性。
对于追求系统化、纪律化交易方法的交易者,这种多层面分析和严格确认的方法提供了一个强大的框架,能够在不同市场环境中保持一致性,同时通过自动化规则减少情绪偏见的影响。 ||
Overview
This strategy is a comprehensive trading system that utilizes multi-timeframe analysis, technical indicator confluence, and pattern recognition to identify high-probability trading opportunities. Its core philosophy is to analyze trend alignment across five different timeframes (1-minute, 5-minute, 15-minute, 1-hour, and 4-hour), combined with volume breakouts, engulfing patterns, and momentum indicators to precisely capture market movements. The strategy also incorporates automatic take-profit and stop-loss mechanisms that dynamically adjust risk management parameters based on market volatility.
Strategy Principles
The strategy is built around several key components:
-
Multi-timeframe Trend Analysis: The strategy first analyzes trends across 5 different timeframes using a custom
getTrend()function. On each timeframe, it checks if the fast EMA is above the slow EMA, if RSI is above 50, and if price is above the fast EMA to determine a buy signal; opposite conditions determine a sell signal. -
Trend Confluence Confirmation: The system only considers entry when all five timeframes show trend signals in the same direction. This strict trend confluence mechanism significantly increases the reliability of signals.
-
Entry Condition Optimization: Beyond trend confluence, entries also require:
- Engulfing pattern (bullish or bearish) confirmation
- Volume spike (greater than 2x the 20-period average volume)
- RSI confirmation (>55 for longs, <45 for shorts)
- Choppiness Index (CMI) >30 (ensuring sufficient market momentum)
- Price position confirmation relative to Volume Weighted Moving Average (VWMA)
-
Risk Management System: The strategy employs dynamic stop-loss calculation based on recent price volatility (high-low range) and uses a multiplier parameter (default 2.0) to set take-profit targets.
-
Support/Resistance Visualization: The system automatically identifies and displays important support and resistance levels, providing visual assistance for understanding the current market structure.
Strategy Advantages
-
Multi-dimensional Signal Filtering: By requiring confluence across multiple technical indicators and timeframes, the strategy significantly reduces the possibility of false signals. This multi-confirmation mechanism ensures the strategy only triggers trade signals in high-probability setups.
-
Adaptive Risk Management: Stop-loss and take-profit levels are not fixed but dynamically calculated based on current market volatility, allowing the strategy to maintain appropriate risk-reward ratios in varying volatility conditions.
-
Comprehensive Visualization System: The strategy includes comprehensive visual aids including a trend dashboard, support/resistance boxes, trade signal markers, and projected take-profit/stop-loss lines, providing traders with intuitive market analysis.
-
Volume Confirmation: By requiring trade signals to be accompanied by significant volume increases, the strategy identifies market moves with actual momentum rather than just random price fluctuations.
-
Pattern Recognition Integration: Engulfing patterns as part of the entry conditions add accuracy to the strategy, as these candlestick formations often represent significant shifts in market sentiment.
Strategy Risks
-
Frequent Rebalancing Requirement: Due to the strategy's reliance on confluence across multiple timeframes, trade signals may be relatively rare. In cases of long periods without trading opportunities, traders might be tempted to lower standards, leading to suboptimal trade execution.
-
Signal Dependency: The strategy heavily relies on technical indicators and patterns which may fail or provide misleading indications in certain market conditions, such as during breaking news events or extreme volatility periods.
-
Over-optimization Risk: The strategy uses multiple parameters and conditions, which could lead to over-optimization on historical data and poor performance in real market conditions. Thorough backtesting across sufficient timeframes and varied market conditions is necessary.
-
Computational Complexity: Multi-timeframe analysis and multiple indicator calculations require significant computational resources, which might cause performance issues or delays on some trading platforms.
-
Trend Reversal Detection Lag: Due to the requirement for confluence across multiple timeframes, the strategy may miss opportunities in the early stages of trend reversals until the new trend is established across all timeframes.
Optimization Directions
-
Adaptive Parameter Adjustment: Introduce mechanisms to automatically adjust EMA lengths, RSI thresholds, and CMI requirements based on current market volatility or trading session to adapt to different market states.
-
Timeframe Weighting System: Instead of simply requiring all timeframes to align, implement a weighting system where higher timeframe signals have greater influence, which might produce more timely signals while maintaining quality standards.
-
Market State Classification: Add an algorithm to detect whether the current market is in a trending or ranging state and adjust strategy parameters accordingly. For example, higher CMI thresholds might be required in ranging markets.
-
Machine Learning Integration: Utilize machine learning algorithms to optimize entry and exit rules, identifying the most effective signal combinations based on historical data and continuously improving as new data accumulates.
-
Enhanced Diversification: Add other uncorrelated technical indicators such as Fibonacci retracement levels, key price levels, or market sentiment indicators to provide additional dimensions of confirmation.
Summary
The Multi-Timeframe Momentum Confluence Automated Trading Strategy is a comprehensive trading system that identifies high-probability trading opportunities through a strict multi-confirmation mechanism. By combining trend analysis, volume confirmation, pattern recognition, and dynamic risk management, the strategy aims to provide high-quality trade signals while managing risk on each trade.
While the strategy's strict conditions may result in relatively few trading signals, this is actually one of its main strengths as it prioritizes signal quality over quantity. With the suggested optimization measures, particularly adaptive parameters and market state classification, the strategy can further enhance its performance and adaptability.
For traders seeking a systematic, disciplined approach to trading, this multi-faceted analysis and strict confirmation methodology provides a robust framework that can maintain consistency across different market environments while reducing the impact of emotional bias through automated rules.[/trans]
Source (PineScript)
/*backtest
start: 2024-04-11 00:00:00
end: 2025-04-09 08:00:00
period: 1h
basePeriod: 1h
exchanges: [{"eid":"Futures_Binance","currency":"ETH_USDT"}]
*/

//@version=5
strategy("M.Shiham-XAUUSD Sniper Strategy", overlay=true, default_qty_type=strategy.percent_of_equity, default_qty_value=10, max_lines_count=500, max_boxes_count=500)

// === Input ===
fastLen = input.int(9, "Fast EMA")
slowLen = input.int(21, "Slow EMA")
rsiLen = input.int(14, "RSI Period")
tpMultiplier = input.float(2.0, "TP Multiplier")
slMultiplier = input.float(1.0, "SL Multiplier")

// === Function Trend Check ===
getTrend(tf) =>
    emaFast = request.security(syminfo.tickerid, tf, ta.ema(close, fastLen))
    emaSlow = request.security(syminfo.tickerid, tf, ta.ema(close, slowLen))
    rsi = request.security(syminfo.tickerid, tf, ta.rsi(close, rsiLen))
    price = request.security(syminfo.tickerid, tf, close)
    isBuy = emaFast > emaSlow and rsi > 50 and price > emaFast
    isSell = emaFast < emaSlow and rsi < 50 and price < emaFast
    isBuy ? 1 : isSell ? -1 : 0

// === Trend by Timeframe ===
trend1m = getTrend("1")
trend5m = getTrend("5")
trend15m = getTrend("15")
trend1h = getTrend("60")
trend4h = getTrend("240")

// === Alert Conditions ===
allBuy = trend1m == 1 and trend5m == 1 and trend15m == 1 and trend1h == 1 and trend4h == 1
allSell = trend1m == -1 and trend5m == -1 and trend15m == -1 and trend1h == -1 and trend4h == -1

alertcondition(allBuy, title="All TF Buy", message="? BUY SIGNAL! All timeframes agree: BUY XAUUSD")
alertcondition(allSell, title="All TF Sell", message="? SELL SIGNAL! All timeframes agree: SELL XAUUSD")

txt(val) => val == 1 ? "BUY" : val == -1 ? "SELL" : "-"
clr(val) => val == 1 ? color.green : val == -1 ? color.red : color.gray

// === Table Dashboard (Optional Toggle) ===
showTable = input.bool(true, "Show Trend Dashboard")
var table t = table.new(position.top_right, 2, 6, border_width=1)
if showTable and bar_index % 5 == 0
    table.cell(t, 0, 0, "Timeframe", text_color=color.white, bgcolor=color.black)
    table.cell(t, 1, 0, "Signal", text_color=color.white, bgcolor=color.black)

    table.cell(t, 0, 1, "1 MIN", text_color=color.white)
    table.cell(t, 1, 1, txt(trend1m), bgcolor=clr(trend1m), text_color=color.white)

    table.cell(t, 0, 2, "5 MIN", text_color=color.white)
    table.cell(t, 1, 2, txt(trend5m), bgcolor=clr(trend5m), text_color=color.white)

    table.cell(t, 0, 3, "15 MIN", text_color=color.white)
    table.cell(t, 1, 3, txt(trend15m), bgcolor=clr(trend15m), text_color=color.white)

    table.cell(t, 0, 4, "1 H", text_color=color.white)
    table.cell(t, 1, 4, txt(trend1h), bgcolor=clr(trend1h), text_color=color.white)

    table.cell(t, 0, 5, "4 H", text_color=color.white)
    table.cell(t, 1, 5, txt(trend4h), bgcolor=clr(trend4h), text_color=color.white)

// === Support/Resistance Box ===
pHigh = ta.pivothigh(high, 5, 5)
pLow = ta.pivotlow(low, 5, 5)

// === Volume Spike ===
avgVol = ta.sma(volume, 20)
volSpike = volume > avgVol * 2

// === Breakout + Alert ===
breakoutUp = high > ta.highest(high, 20)[1] and volSpike
alertcondition(breakoutUp, title="Breakout Up", message="? XAUUSD Breakout Up with Volume")
breakoutDown = low < ta.lowest(low, 20)[1] and volSpike
alertcondition(breakoutDown, title="Breakout Down", message="⚠️ XAUUSD Breakout Down with Volume")

// === Engulfing Pattern ===
bullishEngulf = open[1] > close[1] and close > open and open < close[1] and close > open[1]
bearishEngulf = open[1] < close[1] and close < open and open > close[1] and close < open[1]

// === Moving Averages, Momentum & RSI ===
rsi = ta.rsi(close, rsiLen)
cmiPeriod = 14
cmi = 100 * math.abs(close - close[cmiPeriod]) / (ta.highest(high, cmiPeriod) - ta.lowest(low, cmiPeriod))
vwma = ta.vwma(close, 20)

plot(cmi, title="CMI", color=color.purple, display=display.none)
plot(vwma, title="VWMA", color=color.orange, display=display.none)
ma30 = ta.sma(close, 30)
plot(ma30, title="MA 30", color=color.blue)

// === STRATEGY MODE: Auto Entry & TP/SL ===
longEntry = allBuy and bullishEngulf and volSpike and rsi > 55 and cmi > 30 and close > vwma
shortEntry = allSell and bearishEngulf and volSpike and rsi < 45 and cmi > 30 and close < vwma

if (longEntry)
    strategy.entry("Buy", strategy.long)
    entry = close
    sl = entry - (high - low) * slMultiplier
    tp = entry + (entry - sl) * tpMultiplier
    strategy.exit("TP Buy", from_entry="Buy", stop=sl, limit=tp)
if (shortEntry)
    strategy.entry("Sell", strategy.short)
    entry = close
    sl = entry + (high - low) * slMultiplier
    tp = entry - (sl - entry) * tpMultiplier
    strategy.exit("TP Sell", from_entry="Sell", stop=sl, limit=tp)

if longEntry
    entry = close
    sl = entry - (high - low) * slMultiplier
    tp = entry + (entry - sl) * tpMultiplier


if shortEntry
    entry = close
    sl = entry + (high - low) * slMultiplier
    tp = entry - (sl - entry) * tpMultiplier


// === Plot Signals ===
plotshape(bullishEngulf, title="Bullish Engulfing", location=location.belowbar, color=color.green, style=shape.triangleup, size=size.small, text="Bull")
plotshape(bearishEngulf, title="Bearish Engulfing", location=location.abovebar, color=color.red, style=shape.triangledown, size=size.small, text="Bear")
plotshape(breakoutUp, title="Breakout Up", location=location.belowbar, color=color.blue, style=shape.labelup, text="BO↑")
plotshape(breakoutDown, title="Breakout Down", location=location.abovebar, color=color.orange, style=shape.labeldown, text="BO↓")
Detail
https://www.fmz.com/strategy/490046
Last Modified
2025-04-11 09:48:15