
17 KiB
Name
多时间框架支撑阻力动量短线交易策略与波动率调整风险管理-Multi-Timeframe-Support-Resistance-Momentum-Scalping-Strategy-with-Volatility-Adjusted-Risk-Management
Author
ianzeng123
Strategy Description
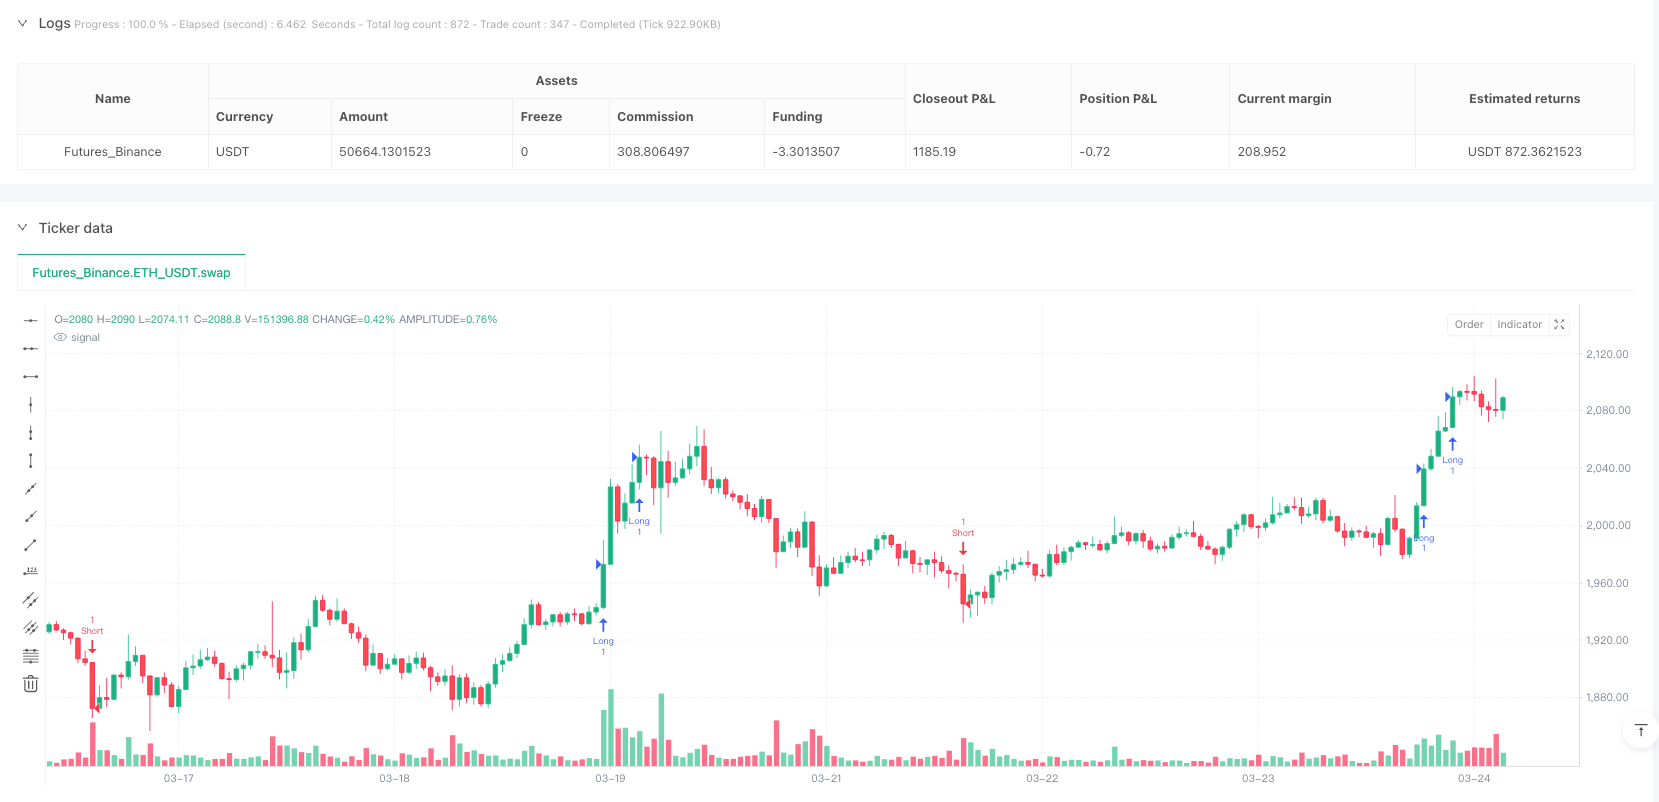
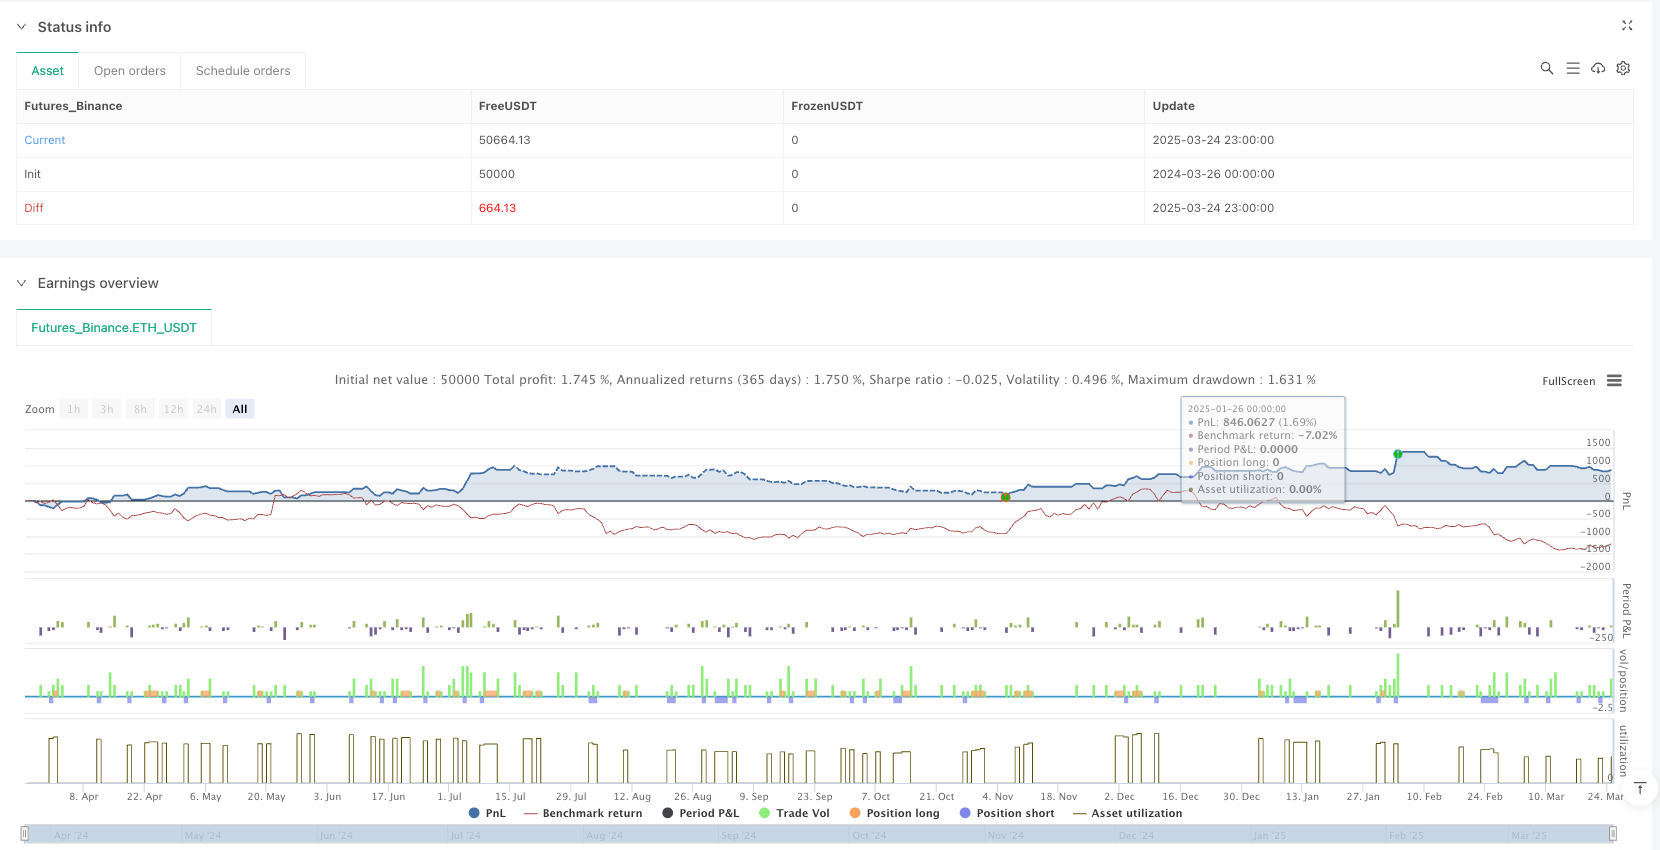
[trans]
概述
该策略是一种结合多时间框架、支撑阻力、动量指标和波动率的短线交易策略。它首先在较高时间框架(15分钟)上识别支撑和阻力水平,然后在1分钟图表上寻找突破或跌破信号。策略使用相对强弱指数(RSI)和平均真实范围(ATR)确认动量和波动性,并通过指数移动平均线(EMA)和交易量来确认趋势方向。该策略设计了动态的止损和获利水平,基于ATR调整,实现2:1的风险回报比。
策略原理
该策略的核心原理是利用多时间框架分析和价格动量的协同作用。具体实施方法如下:
-
支撑与阻力识别:策略使用15分钟时间框架计算15个周期内的最低点作为支撑位,最高点作为阻力位。这些关键价格水平提供了较高时间框架的市场结构视角。
-
突破确认:当1分钟图表上的价格收盘价突破上述支撑或阻力位时,策略识别为可能的交易信号。具体表现为价格跌破支撑位(跌破确认)或突破阻力位(突破确认)。
-
动量和波动率过滤:策略使用RSI指标确认价格动量,要求做空信号的RSI低于35,做多信号的RSI高于65。同时,要求当前ATR大于14周期ATR均值,以确保足够的市场波动性,并且价格必须突破支撑或阻力位一定幅度(0.2倍ATR)。
-
趋势和交易量确认:策略使用9周期和50周期EMA作为趋势指标,要求价格位于这两条EMA的上方(做多)或下方(做空)。另外,要求交易量大于20周期平均交易量,确保有足够的市场参与度。
-
风险管理:策略设置动态止损位,基于5个周期内的最高价/最低价加减0.2倍ATR。获利目标设置为入场价格加减2倍ATR,从而实现2:1的风险回报比。
策略优势
通过深入分析该策略代码,可以总结出以下几点优势:
-
多重确认机制:策略结合了价格突破、动量指标、趋势指标和交易量确认,大大减少了假突破信号的风险。
-
动态风险管理:基于ATR的动态止损和获利设置,使策略能够根据市场波动性自动调整风险参数,在不同波动环境中保持稳定的风险控制。
-
较高的风险回报比:通过设置2:1的风险回报比(获利目标是止损范围的10倍),即使胜率不高也可能实现长期盈利。
-
多时间框架协同:通过结合15分钟和1分钟时间框架,策略能够在保持短线灵活性的同时,获得更高时间框架的结构支持。
-
基于市场结构的交易:策略基于支撑和阻力这一经典的市场结构理论,这些价格水平往往是大型市场参与者的活跃区域,具有较高的成功概率。
策略风险
尽管该策略具有多重优势,但在实际应用中仍存在以下潜在风险:
-
频繁交易风险:作为1分钟图表上的短线交易策略,可能产生大量的交易信号,导致过度交易和较高的交易成本。
-
市场噪音影响:在低时间框架上,市场噪音较大,即使有多重过滤机制,仍可能触发不必要的交易。
-
快速市场风险:在重大新闻或极端市场条件下,价格可能迅速突破止损位,导致实际损失超过预期。
-
参数优化风险:策略使用了多个固定参数(如RSI的35/65阈值,ATR乘数等),这些参数可能在不同市场环境下需要重新优化。
-
趋势反转风险:尽管使用了EMA过滤,策略仍可能在趋势即将反转时发出信号,特别是在横盘整理市场中。
为减轻这些风险,建议:
- 限制每日交易次数,避免过度交易
- 在交易前先分析更高时间框架的整体趋势
- 考虑在重大经济数据公布期间暂停交易
- 定期对策略参数进行回测和优化
- 结合其他指标如趋势强度指标进行交易过滤
优化方向
经过深入分析,该策略可以在以下几个方向进行进一步优化:
-
自适应参数调整:当前策略使用的是固定的RSI阈值和ATR乘数。可以考虑基于市场波动性或趋势强度自动调整这些参数,例如在高波动环境中使用更严格的RSI阈值和更大的ATR乘数。
-
市场环境过滤:增加市场环境识别模块,区分趋势市场和横盘整理市场,并根据不同市场环境调整策略参数或暂停交易。例如,可以使用ADX(平均方向指数)来评估趋势强度。
-
时间过滤:某些市场时段流动性更低或波动性更不可预测,可以添加时间过滤器,避开这些时段的交易。
-
多品种相关性过滤:增加对相关市场或指数的参考,只有当相关市场方向一致时才进行交易,例如只有当整体股指趋势向上时才在个股上做多。
-
止盈止损优化:可以考虑实现分批止盈策略,如在达到1倍ATR时平掉部分仓位,在达到2倍ATR时平掉剩余仓位,以提高整体获利能力。
-
机器学习增强:可以使用机器学习算法优化参数选择,或者通过历史数据训练模型来预测哪些突破信号更可能成功。
以上优化方向的实施将有助于提高策略的稳定性和盈利能力,尤其是在不同市场环境下的适应性。
总结
多时间框架支撑阻力动量短线交易策略综合利用了技术分析中的多种经典方法,包括支撑阻力、趋势跟踪、动量确认和交易量分析。通过在较高时间框架识别关键价格水平,并在低时间框架上执行交易,该策略在保持灵活性的同时,能够获得更可靠的市场结构支持。
策略的动态风险管理机制和2:1的风险回报设置为其提供了良好的长期盈利潜力。然而,作为一种短线交易策略,用户需要关注交易成本控制和过度交易风险。通过适当的市场环境过滤和参数优化,可以进一步提高策略的稳定性和适应性。
对于追求短线交易机会的量化交易者,这一策略提供了一个结构化的框架,但建议在实盘交易前进行充分的历史回测和模拟交易,确保策略在不同市场环境下的表现符合预期。
||
Overview
This strategy is a scalping approach that combines multi-timeframe analysis, support and resistance levels, momentum indicators, and volatility measurements. It first identifies support and resistance levels on a higher timeframe (15-minute), then looks for breakout or breakdown signals on the 1-minute chart. The strategy uses Relative Strength Index (RSI) and Average True Range (ATR) to confirm momentum and volatility, while utilizing Exponential Moving Averages (EMA) and volume to confirm trend direction. The strategy implements dynamic stop-loss and take-profit levels adjusted based on ATR, achieving a 2:1 risk-reward ratio.
Strategy Principles
The core principle of this strategy lies in the synergy between multi-timeframe analysis and price momentum. The implementation method is as follows:
-
Support and Resistance Identification: The strategy uses the 15-minute timeframe to calculate the lowest point over 15 periods as support and the highest point as resistance. These key price levels provide a higher timeframe market structure perspective.
-
Breakout Confirmation: When the closing price on the 1-minute chart breaks through the aforementioned support or resistance levels, the strategy identifies a potential trading signal. This is specifically manifested as price breaking below support (breakdown confirmation) or breaking above resistance (breakout confirmation).
-
Momentum and Volatility Filtering: The strategy uses the RSI indicator to confirm price momentum, requiring RSI below 35 for short signals and above 65 for long signals. Additionally, it requires the current ATR to be greater than the 14-period ATR average to ensure sufficient market volatility, and the price must break through support or resistance by a certain margin (0.2 times ATR).
-
Trend and Volume Confirmation: The strategy uses 9-period and 50-period EMAs as trend indicators, requiring the price to be above both EMAs (for longs) or below both EMAs (for shorts). Furthermore, it requires volume to be greater than the 20-period average volume, ensuring sufficient market participation.
-
Risk Management: The strategy sets dynamic stop-loss levels based on the highest/lowest price over 5 periods plus/minus 0.2 times ATR. Take-profit targets are set at the entry price plus/minus 2 times ATR, thus achieving a 2:1 risk-reward ratio.
Strategy Advantages
Through in-depth analysis of the strategy code, we can summarize the following advantages:
-
Multiple Confirmation Mechanisms: The strategy combines price breakouts, momentum indicators, trend indicators, and volume confirmation, greatly reducing the risk of false breakout signals.
-
Dynamic Risk Management: ATR-based dynamic stop-loss and take-profit settings allow the strategy to automatically adjust risk parameters according to market volatility, maintaining stable risk control in different volatility environments.
-
Higher Risk-Reward Ratio: By setting a 2:1 risk-reward ratio (take-profit target is 10 times the stop-loss range), long-term profitability may be achieved even with a lower win rate.
-
Multi-Timeframe Synergy: By combining 15-minute and 1-minute timeframes, the strategy can maintain short-term flexibility while gaining structural support from higher timeframes.
-
Market Structure-Based Trading: The strategy is based on the classic market structure theory of support and resistance, which are often active zones for large market participants and have a higher probability of success.
Strategy Risks
Despite its multiple advantages, the strategy still has the following potential risks in practical application:
-
Frequent Trading Risk: As a scalping strategy on the 1-minute chart, it may generate a large number of trading signals, leading to overtrading and higher transaction costs.
-
Market Noise Impact: On lower timeframes, market noise is greater, and unnecessary trades may still be triggered even with multiple filtering mechanisms.
-
Fast Market Risk: During major news or extreme market conditions, prices may quickly break through stop-loss levels, resulting in actual losses exceeding expectations.
-
Parameter Optimization Risk: The strategy uses multiple fixed parameters (such as RSI 35/65 thresholds, ATR multipliers, etc.), which may need to be re-optimized in different market environments.
-
Trend Reversal Risk: Despite using EMA filtering, the strategy may still generate signals when a trend is about to reverse, especially in consolidating markets.
To mitigate these risks, it is recommended to:
- Limit the number of daily trades to avoid overtrading
- Analyze the overall trend in higher timeframes before trading
- Consider pausing trading during major economic data releases
- Regularly backtest and optimize strategy parameters
- Combine other indicators such as trend strength indicators for trade filtering
Optimization Directions
After in-depth analysis, the strategy can be further optimized in the following directions:
-
Adaptive Parameter Adjustment: The current strategy uses fixed RSI thresholds and ATR multipliers. Consider automatically adjusting these parameters based on market volatility or trend strength, for example, using stricter RSI thresholds and larger ATR multipliers in high-volatility environments.
-
Market Environment Filtering: Add a market environment recognition module to distinguish between trending and consolidating markets, and adjust strategy parameters or pause trading accordingly. For example, the Average Directional Index (ADX) can be used to evaluate trend strength.
-
Time Filtering: Some market sessions have lower liquidity or more unpredictable volatility. Adding time filters can help avoid trading during these periods.
-
Multi-Instrument Correlation Filtering: Add references to related markets or indices, only trading when the direction of related markets is consistent. For example, only going long on individual stocks when the overall stock index trend is upward.
-
Take-Profit and Stop-Loss Optimization: Consider implementing a partial profit-taking strategy, such as closing part of the position when reaching 1 times ATR and the remainder at 2 times ATR, to improve overall profitability.
-
Machine Learning Enhancement: Machine learning algorithms can be used to optimize parameter selection, or models can be trained on historical data to predict which breakout signals are more likely to succeed.
Implementing these optimization directions will help improve the strategy's stability and profitability, especially its adaptability in different market environments.
Summary
The Multi-Timeframe Support-Resistance Momentum Scalping Strategy combines various classic methods in technical analysis, including support and resistance, trend following, momentum confirmation, and volume analysis. By identifying key price levels on higher timeframes and executing trades on lower timeframes, the strategy maintains flexibility while gaining more reliable market structure support.
The strategy's dynamic risk management mechanism and 2:1 risk-reward setup provide good long-term profit potential. However, as a scalping strategy, users need to pay attention to controlling transaction costs and the risk of overtrading. Through appropriate market environment filtering and parameter optimization, the strategy's stability and adaptability can be further improved.
For quantitative traders pursuing short-term trading opportunities, this strategy provides a structured framework, but it is recommended to conduct thorough historical backtesting and paper trading before live trading to ensure the strategy performs as expected in different market environments. [/trans]
Source (PineScript)
/*backtest
start: 2024-03-26 00:00:00
end: 2025-03-25 00:00:00
period: 1h
basePeriod: 1h
exchanges: [{"eid":"Futures_Binance","currency":"ETH_USDT"}]
*/

//@version=5
strategy("Support & Resistance Scalping", overlay=true)

// Identify Higher Timeframe Support & Resistance Levels
htf = "15"
htfLow = request.security(syminfo.tickerid, htf, ta.lowest(low, 15))
htfHigh = request.security(syminfo.tickerid, htf, ta.highest(high, 15))

// Detect Breakdown & Breakout on 1-Minute Chart with Confirmation
breakdownConfirmed = ta.crossunder(close, htfLow) and close < htfLow
breakoutConfirmed = ta.crossover(close, htfHigh) and close > htfHigh

// Momentum Confirmation (RSI and ATR for Volatility)
rsiValue = ta.rsi(close, 14)
atr = ta.atr(14)
avgAtr = ta.sma(atr, 14)
strongDownMomentum = rsiValue < 35 and close < htfLow - atr * 0.2 and atr > avgAtr
strongUpMomentum = rsiValue > 65 and close > htfHigh + atr * 0.2 and atr > avgAtr

// Trend Confirmation using EMA
emaFast = ta.ema(close, 9)
emaSlow = ta.ema(close, 50) // Added 50 EMA for stronger trend confirmation
volumeAvg = ta.sma(volume, 20) // Average volume for confirmation
highVolume = volume > volumeAvg // Require higher volume on breakdown

shortCondition = breakdownConfirmed and strongDownMomentum and close < emaFast and close < emaSlow and highVolume
longCondition = breakoutConfirmed and strongUpMomentum and close > emaFast and close > emaSlow and highVolume

// Dynamic Stop-Loss & Take-Profit Adjustments (Improved R:R 2:1)
shortSL = ta.highest(high, 5) + atr * 0.2 // Reduced SL multiplier to limit risk
shortTP = close - atr * 2.0 // Increased TP for better reward
longSL = ta.lowest(low, 5) - atr * 0.2 // Reduced SL multiplier to limit risk
longTP = close + atr * 2.0 // Increased TP for better reward

// Execute Trades with Entry and Exit Markers
if (shortCondition)
    strategy.entry("Short", strategy.short)
    label.new(bar_index, close, "▼", color=color.red, textcolor=color.white, size=size.small)
    strategy.exit("Take Profit Short", from_entry="Short", limit=shortTP, stop=shortSL)
    label.new(bar_index, shortTP, "▲", color=color.green, textcolor=color.white, size=size.small)

if (longCondition)
    strategy.entry("Long", strategy.long)
    label.new(bar_index, close, "▲", color=color.green, textcolor=color.white, size=size.small)
    strategy.exit("Take Profit Long", from_entry="Long", limit=longTP, stop=longSL)
    label.new(bar_index, longTP, "▼", color=color.red, textcolor=color.white, size=size.small)
Detail
https://www.fmz.com/strategy/488285
Last Modified
2025-03-26 15:49:34