
18 KiB
Name
多时间框架抛物线SAR动态趋势跟踪量化策略-Multi-Timeframe-Parabolic-SAR-Dynamic-Trend-Following-Quantitative-Strategy
Author
ianzeng123
Strategy Description
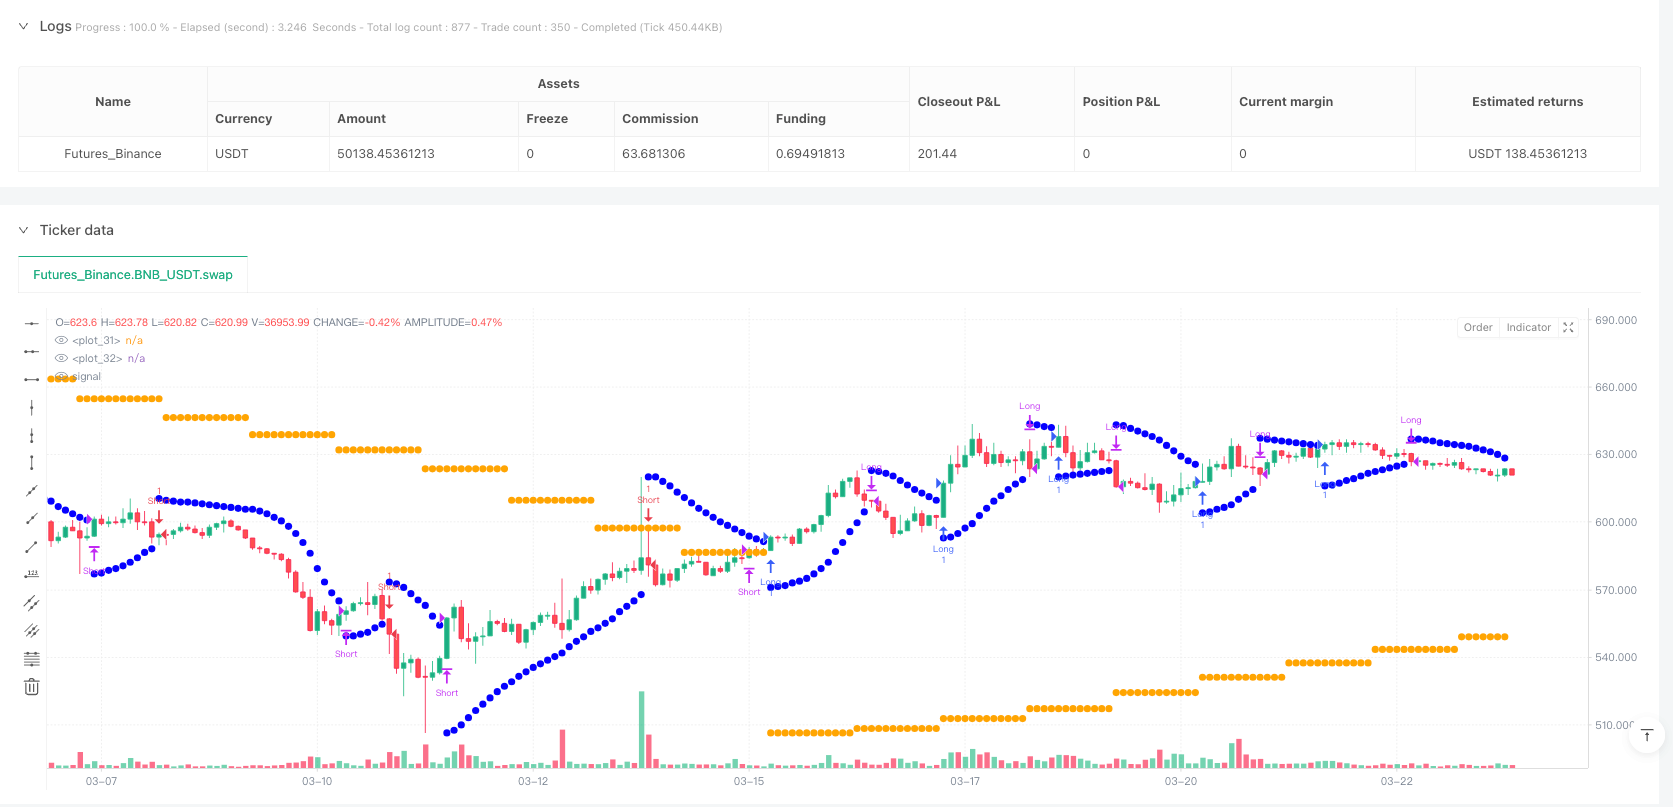
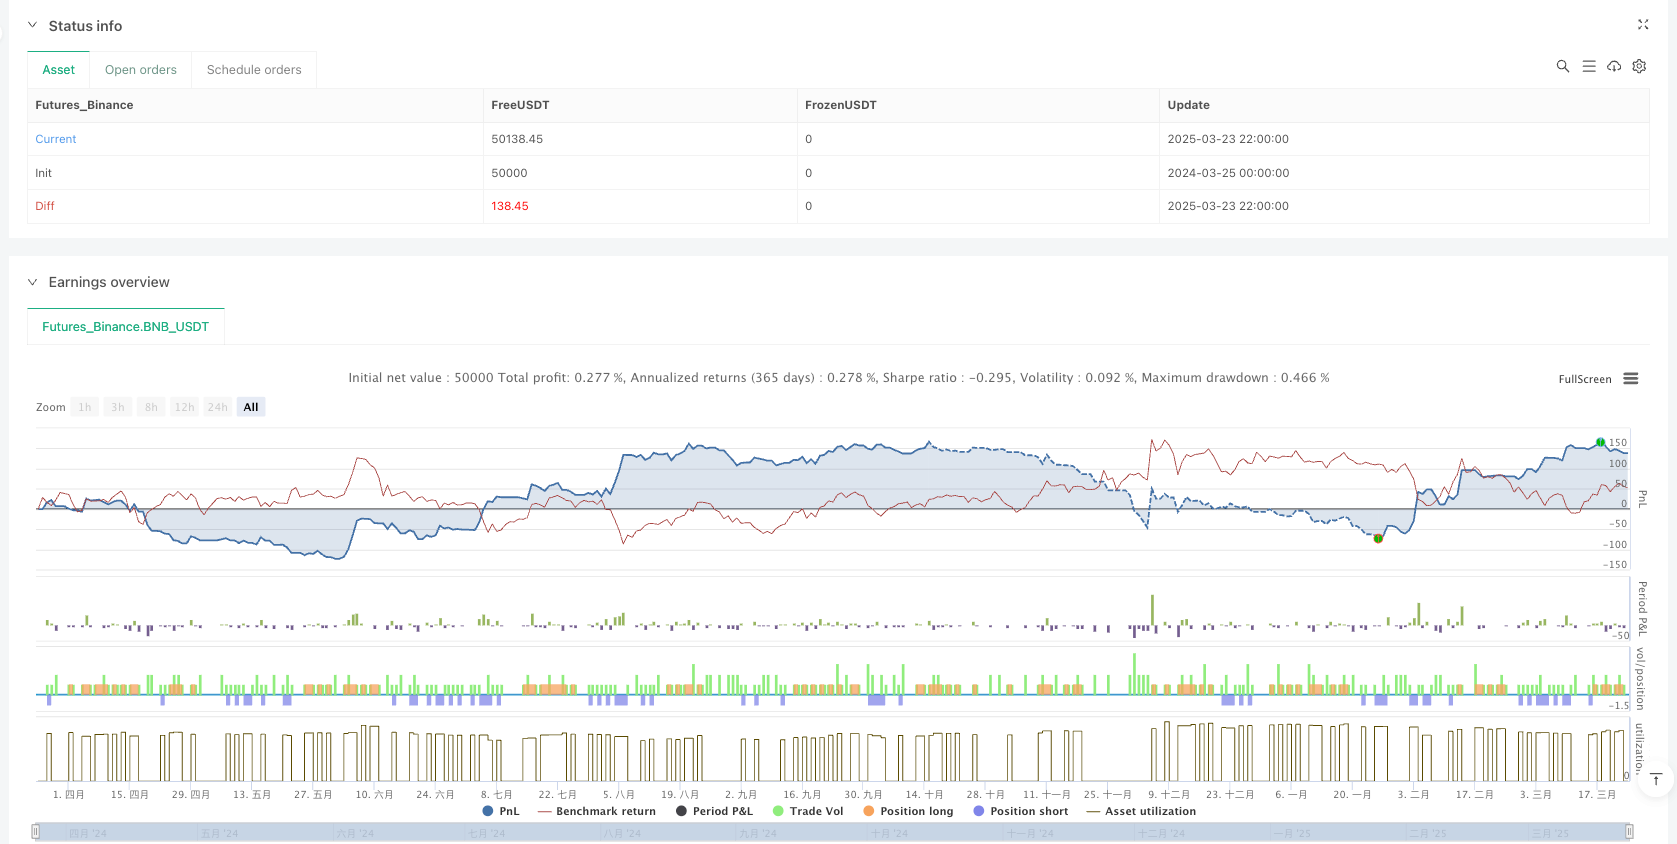
[trans]
概述
多时间框架抛物线SAR动态趋势跟踪量化策略是一种结合多个时间周期抛物线SAR指标的高级量化交易系统。该策略创新性地结合了当前图表时间框架和用户自定义的更高时间框架的PSAR指标,实现了更精准的趋势识别、入场/出场信号和动态止损管理。通过多时间框架分析,该策略有效过滤市场噪音,提高交易准确性,并捕捉更显著的市场走势。
策略原理
该策略的核心原理基于抛物线SAR(Stop and Reverse)指标在多个时间框架上的应用与协同效应。策略计算逻辑包括:
-
双时间框架分析: 同时计算当前图表时间框架和更高时间框架(如1小时图表上的日线PSAR)的抛物线SAR,确保交易方向与主导趋势一致。
-
趋势方向判定: 通过PSAR点的位置判断趋势方向,当价格高于PSAR点时为上升趋势(PSAR点在价格下方),反之为下降趋势(PSAR点在价格上方)。
-
灵活入场条件: 策略提供三种入场策略选择:
- 双重确认模式: 要求当前时间框架和更高时间框架的PSAR信号一致,且当前时间框架PSAR刚刚翻转方向
- 仅当前时间框架模式: 仅基于当前时间框架PSAR信号交易
- 仅更高时间框架模式: 仅基于更高时间框架PSAR信号交易
-
动态跟踪止损: 使用当前时间框架的PSAR作为动态止损,随着价格移动自动调整止损位置,保护利润并限制损失。
-
无重绘设计: 策略使用
lookahead=barmerge.lookahead_off参数确保更高时间框架数据访问不会发生数据泄漏,防止重绘问题。
代码中的关键实现包括PSAR计算(ta.sar)、多时间框架数据请求(request.security)、趋势方向判定(基于价格与PSAR关系)以及入场和出场条件的逻辑组合,构成了一个完整的策略交易系统。
策略优势
深入分析该策略的代码实现,可以总结出以下显著优势:
-
趋势识别能力增强: 通过多时间框架分析,提高了趋势识别的准确性。当短期和长期PSAR指标一致时,交易信号的可靠性显著提升。
-
减少假信号: 更高时间框架的PSAR作为过滤器,有效减少了低时间框架的假信号和震荡市场中的频繁交易。
-
高度可定制性: 策略允许用户调整PSAR参数(起始值、增量、最大值)、选择更高时间框架、配置显示选项和颜色,实现精细化定制。
-
动态风险管理: 采用基于PSAR的动态跟踪止损,随市场波动自动调整止损位置,既保护已获利润又控制最大风险。
-
视觉清晰: 不同颜色区分当前和更高时间框架的PSAR点,提供直观的视觉信号,便于快速决策。
-
适应性强: 适用于各种交易风格(摇摆交易、日内交易、趋势跟踪)和各种市场(股票、外汇、加密货币等)。
-
逻辑简洁: 策略逻辑清晰,实现方式简洁有效,无复杂计算,运行效率高。
策略风险
尽管该策略具有多重优势,但也存在以下潜在风险和局限性:
-
滞后性问题: PSAR本质上是一种滞后指标,可能在趋势转折点附近错过最佳入场或出场时机。解决方法是结合其他前瞻性指标辅助判断。
-
震荡市场表现不佳: 在横盘整理或高波动区间市场中,PSAR容易产生频繁的假信号,导致过度交易和连续亏损。解决方法是增加市场类型判断,在震荡市场暂停交易。
-
参数敏感性: 策略性能对PSAR参数(起始值、增量、最大值)高度敏感,不同的市场和时间框架可能需要不同的参数配置。解决方法是进行充分的历史回测和参数优化。
-
止损跳空风险: 在波动剧烈的市场中,价格可能跳空突破PSAR止损位,导致实际止损价格远低于预期。解决方法是考虑添加硬性止损限制。
-
对趋势变化反应迟缓: 当趋势突然反转时,动态止损可能无法及时触发,导致更大的回撤。解决方法是考虑添加额外的市场情绪或波动指标进行辅助判断。
-
多时间框架一致性挑战: 在市场转折点,不同时间框架可能出现不一致的信号,增加决策复杂性。解决方法是建立明确的优先级规则或加权机制。
策略优化方向
基于代码分析,该策略存在以下优化空间:
-
市场类型自适应: 增加市场类型识别功能(趋势vs震荡),在不同市场环境下自动调整PSAR参数或交易逻辑。这可以显著提高在横盘市场中的表现。
-
波动率调整机制: 集成ATR(Average True Range)指标,根据市场波动率动态调整PSAR参数。高波动期间增大参数以减少假信号,低波动期间减小参数以提高灵敏度。
-
交易量确认: 增加交易量分析维度,要求信号出现时伴随交易量增加,进一步过滤低质量信号。
-
多指标综合决策: 引入额外的趋势确认指标(如移动平均线系统或ADX),建立多指标得分系统,提高入场信号的可靠性。
-
部分仓位管理: 实现基于信号强度的部分仓位管理,而不是简单的全仓进出。例如,当多个时间框架信号一致时使用更大仓位,不一致时使用较小仓位。
-
时间过滤器: 添加交易时段过滤,避开低流动性或高波动性时段,提高整体胜率。
-
止盈机制完善: 当前策略仅依赖PSAR翻转作为出场条件,可以考虑添加基于价格结构的止盈机制,在大幅盈利情况下锁定部分利润。
-
资金管理优化: 集成更复杂的资金管理算法,如凯利准则或固定比例风险模型,根据历史表现动态调整仓位大小。
总结
多时间框架抛物线SAR动态趋势跟踪量化策略是一种结合了PSAR指标多时间框架分析优势的高级量化交易系统。通过同时监控当前和更高时间框架的PSAR信号,该策略有效提升了趋势识别能力,减少了假信号,并实现了动态风险管理。
策略核心优势在于其灵活的入场模式选择、直观的视觉信号和高度可定制性,使其适应各种交易风格和市场环境。然而,作为基于PSAR的系统,它也继承了PSAR指标的固有局限性,如滞后性和在震荡市场中的表现不佳等问题。
通过引入市场类型识别、波动率调整、交易量确认等优化措施,该策略有很大的提升空间。最终,该策略为趋势跟踪交易者提供了一个坚实的量化交易框架,特别适合中长期趋势捕捉和风险控制。 ||
Overview
The Multi-Timeframe Parabolic SAR Dynamic Trend Following Quantitative Strategy is an advanced quantitative trading system that combines the Parabolic SAR indicator across multiple timeframes. This strategy innovatively integrates the PSAR indicator from both the current chart timeframe and a user-defined higher timeframe to achieve more precise trend identification, entry/exit signals, and dynamic stop-loss management. Through multi-timeframe analysis, this strategy effectively filters market noise, improves trading accuracy, and captures more significant market movements.
Strategy Principles
The core principle of this strategy is based on the application and synergistic effect of the Parabolic SAR (Stop and Reverse) indicator across multiple timeframes. The strategy calculation logic includes:
-
Dual Timeframe Analysis: Simultaneously calculates the Parabolic SAR on both the current chart timeframe and a higher timeframe (such as Daily PSAR on a 1-hour chart), ensuring that trade direction aligns with the dominant trend.
-
Trend Direction Determination: Determines trend direction based on the position of PSAR dots - uptrend when price is above PSAR dots (PSAR dots below price), and downtrend when price is below PSAR dots (PSAR dots above price).
-
Flexible Entry Conditions: The strategy offers three entry strategy options:
- Confirmation Mode: Requires agreement between current timeframe and higher timeframe PSAR signals, and the current timeframe PSAR must have just flipped direction
- Current Timeframe Only Mode: Trades based solely on current timeframe PSAR signals
- Higher Timeframe Only Mode: Trades based solely on higher timeframe PSAR signals
-
Dynamic Trailing Stop: Uses the current timeframe's PSAR as a dynamic trailing stop, automatically adjusting the stop-loss position as price moves, protecting profits and limiting losses.
-
No Repainting Design: The strategy uses the
lookahead=barmerge.lookahead_offparameter to ensure that higher timeframe data access does not experience data leakage, preventing repainting issues.
Key implementations in the code include PSAR calculation (ta.sar), multi-timeframe data requests (request.security), trend direction determination (based on price and PSAR relationship), and the logical combination of entry and exit conditions, forming a complete strategy trading system.
Strategy Advantages
Analyzing the code implementation of this strategy reveals the following significant advantages:
-
Enhanced Trend Identification: Through multi-timeframe analysis, the accuracy of trend identification is improved. When short-term and long-term PSAR indicators agree, the reliability of trading signals significantly increases.
-
Reduced False Signals: The higher timeframe PSAR acts as a filter, effectively reducing false signals from lower timeframes and frequent trading in oscillating markets.
-
High Customizability: The strategy allows users to adjust PSAR parameters (start value, increment, maximum), select higher timeframes, configure display options and colors, enabling fine-tuned customization.
-
Dynamic Risk Management: Employs PSAR-based dynamic trailing stops that automatically adjust stop-loss positions with market fluctuations, both protecting profits and controlling maximum risk.
-
Visual Clarity: Different colors distinguish between current and higher timeframe PSAR dots, providing intuitive visual signals for quick decision-making.
-
Strong Adaptability: Suitable for various trading styles (swing trading, day trading, trend following) and various markets (stocks, forex, cryptocurrencies, etc.).
-
Logical Simplicity: The strategy logic is clear, implementation is concise and effective, without complex calculations, resulting in high operational efficiency.
Strategy Risks
Despite its multiple advantages, this strategy also has the following potential risks and limitations:
-
Lag Issues: PSAR is inherently a lagging indicator and may miss optimal entry or exit opportunities near trend turning points. Solution: Combine with other forward-looking indicators for supplementary judgment.
-
Poor Performance in Oscillating Markets: In sideways consolidation or highly volatile range-bound markets, PSAR can generate frequent false signals, leading to overtrading and consecutive losses. Solution: Add market type identification to pause trading during oscillating markets.
-
Parameter Sensitivity: Strategy performance is highly sensitive to PSAR parameters (start value, increment, maximum), and different markets and timeframes may require different parameter configurations. Solution: Conduct thorough historical backtesting and parameter optimization.
-
Gap Risk for Stop-Loss: In highly volatile markets, prices may gap through the PSAR stop-loss level, resulting in actual stop-loss prices far lower than expected. Solution: Consider adding hard stop-loss limits.
-
Slow Reaction to Trend Changes: When trends suddenly reverse, dynamic stops may not trigger in time, leading to larger drawdowns. Solution: Consider adding additional market sentiment or volatility indicators for supplementary judgment.
-
Multi-Timeframe Consistency Challenges: At market turning points, different timeframes may show inconsistent signals, increasing decision-making complexity. Solution: Establish clear priority rules or weighting mechanisms.
Strategy Optimization Directions
Based on code analysis, the strategy has the following optimization potential:
-
Market Type Adaptation: Add market type identification functionality (trend vs. oscillation) to automatically adjust PSAR parameters or trading logic in different market environments. This can significantly improve performance in sideways markets.
-
Volatility Adjustment Mechanism: Integrate the ATR (Average True Range) indicator to dynamically adjust PSAR parameters based on market volatility. Increase parameters during high volatility periods to reduce false signals and decrease parameters during low volatility periods to improve sensitivity.
-
Volume Confirmation: Add volume analysis dimension, requiring signals to be accompanied by increased trading volume to further filter low-quality signals.
-
Multi-Indicator Comprehensive Decision-Making: Introduce additional trend confirmation indicators (such as moving average systems or ADX) to establish a multi-indicator scoring system, improving the reliability of entry signals.
-
Partial Position Management: Implement partial position management based on signal strength, rather than simple all-in/all-out. For example, use larger positions when multiple timeframe signals agree and smaller positions when they don't.
-
Time Filter: Add trading session filtering to avoid low liquidity or high volatility sessions, improving overall win rate.
-
Profit-Taking Mechanism Improvement: The current strategy relies only on PSAR reversal as exit conditions. Consider adding price structure-based profit-taking mechanisms to lock in partial profits in cases of significant gains.
-
Capital Management Optimization: Integrate more complex money management algorithms, such as the Kelly criterion or fixed proportion risk model, to dynamically adjust position size based on historical performance.
Summary
The Multi-Timeframe Parabolic SAR Dynamic Trend Following Quantitative Strategy is an advanced quantitative trading system that combines the advantages of PSAR indicator analysis across multiple timeframes. By simultaneously monitoring PSAR signals from current and higher timeframes, this strategy effectively enhances trend identification capabilities, reduces false signals, and implements dynamic risk management.
The core advantages of the strategy lie in its flexible entry mode selection, intuitive visual signals, and high customizability, making it adaptable to various trading styles and market environments. However, as a PSAR-based system, it also inherits the inherent limitations of the PSAR indicator, such as lag issues and poor performance in oscillating markets.
Through the introduction of market type identification, volatility adjustment, volume confirmation, and other optimization measures, this strategy has significant room for improvement. Ultimately, this strategy provides trend-following traders with a solid quantitative trading framework, particularly suitable for medium to long-term trend capture and risk control.[/trans]
Source (PineScript)
/*backtest
start: 2024-03-25 00:00:00
end: 2025-03-24 00:00:00
period: 2h
basePeriod: 2h
exchanges: [{"eid":"Futures_Binance","currency":"BNB_USDT"}]
*/

//@version=5
strategy("Multi-Timeframe Parabolic SAR Strategy ver 1.0", overlay=true, shorttitle="MTF PSAR Strategy ver 1.0")

// --- Input Settings ---

// PSAR Settings
start = input.float(0.02, title="Start", minval=0.001)
increment = input.float(0.02, title="Increment", minval=0.001)
maximum = input.float(0.2, title="Maximum", maxval=1)

// Multi-Timeframe Settings
higherTimeframe = input.timeframe("D", title="Higher Timeframe PSAR")
showCurrentTF = input.bool(true, title="Show Current Timeframe PSAR")
showHigherTF = input.bool(true, title="Show Higher Timeframe PSAR")

// Color Settings
currentTFColor = input.color(color.blue, title="Current TF PSAR Color")
higherTFColor = input.color(color.orange, title="Higher TF PSAR Color")


// --- PSAR Calculations ---

// Current Timeframe PSAR
currentPSAR = ta.sar(start, increment, maximum)

// Higher Timeframe PSAR
higherPSAR = request.security(syminfo.tickerid, higherTimeframe, ta.sar(start, increment, maximum), lookahead=barmerge.lookahead_off)


// --- Plotting ---
plot(showCurrentTF ? currentPSAR : na, style=plot.style_circles, color=currentTFColor, linewidth=2)
plot(showHigherTF ? higherPSAR : na, style=plot.style_circles, color=higherTFColor, linewidth=2)


// --- Strategy Logic ---

// Determine Trend Direction based on PSAR
currentTrend = close > currentPSAR ? 1 : -1
higherTrend = close > higherPSAR ? 1 : -1  //compare to close of current timeframe

// Entry Conditions
longCondition = showCurrentTF and showHigherTF and currentTrend == 1 and higherTrend == 1 and currentTrend[1] == -1  //Both bullish and Current flipped
shortCondition = showCurrentTF and showHigherTF and currentTrend == -1 and higherTrend == -1 and currentTrend[1] == 1 //Both bearish and Current flipped

longConditionSingleTF = showCurrentTF and not showHigherTF and currentTrend == 1 and currentTrend[1] == -1  // Current TF bullish, HTF disabled
shortConditionSingleTF = showCurrentTF and not showHigherTF and currentTrend == -1 and currentTrend[1] == 1  // Current TF bearish, HTF disabled

longConditionHTFOnly =  not showCurrentTF and showHigherTF and higherTrend == 1 and higherTrend[1] == -1
shortConditionHTFOnly = not showCurrentTF and showHigherTF and higherTrend == -1 and higherTrend[1] == 1

// Exit Conditions (Trailing Stop using Current Timeframe PSAR)
longExitCondition = showCurrentTF ? currentTrend == -1 : false
shortExitCondition = showCurrentTF ? currentTrend == 1 : false

longExitConditionHTF = showHigherTF ? higherTrend == -1 : false
shortExitConditionHTF = showHigherTF ? higherTrend == 1: false
// --- Strategy Orders ---

if (longCondition or longConditionSingleTF or longConditionHTFOnly)
    strategy.entry("Long", strategy.long)

if (shortCondition or shortConditionSingleTF or shortConditionHTFOnly)
    strategy.entry("Short", strategy.short)

if (longExitCondition or longExitConditionHTF)
    strategy.close("Long", comment="PSAR Exit") // Close long position when PSAR flips

if (shortExitCondition or shortExitConditionHTF)
    strategy.close("Short", comment="PSAR Exit") // Close short position when PSAR flips
Detail
https://www.fmz.com/strategy/488134
Last Modified
2025-03-25 13:22:41