
8.3 KiB
Name
多时间框架成交量与趋势聚合交易策略-Multi-Timeframe-Volume-and-Trend-Confluence-Trading-Strategy
Author
ianzeng123
Strategy Description
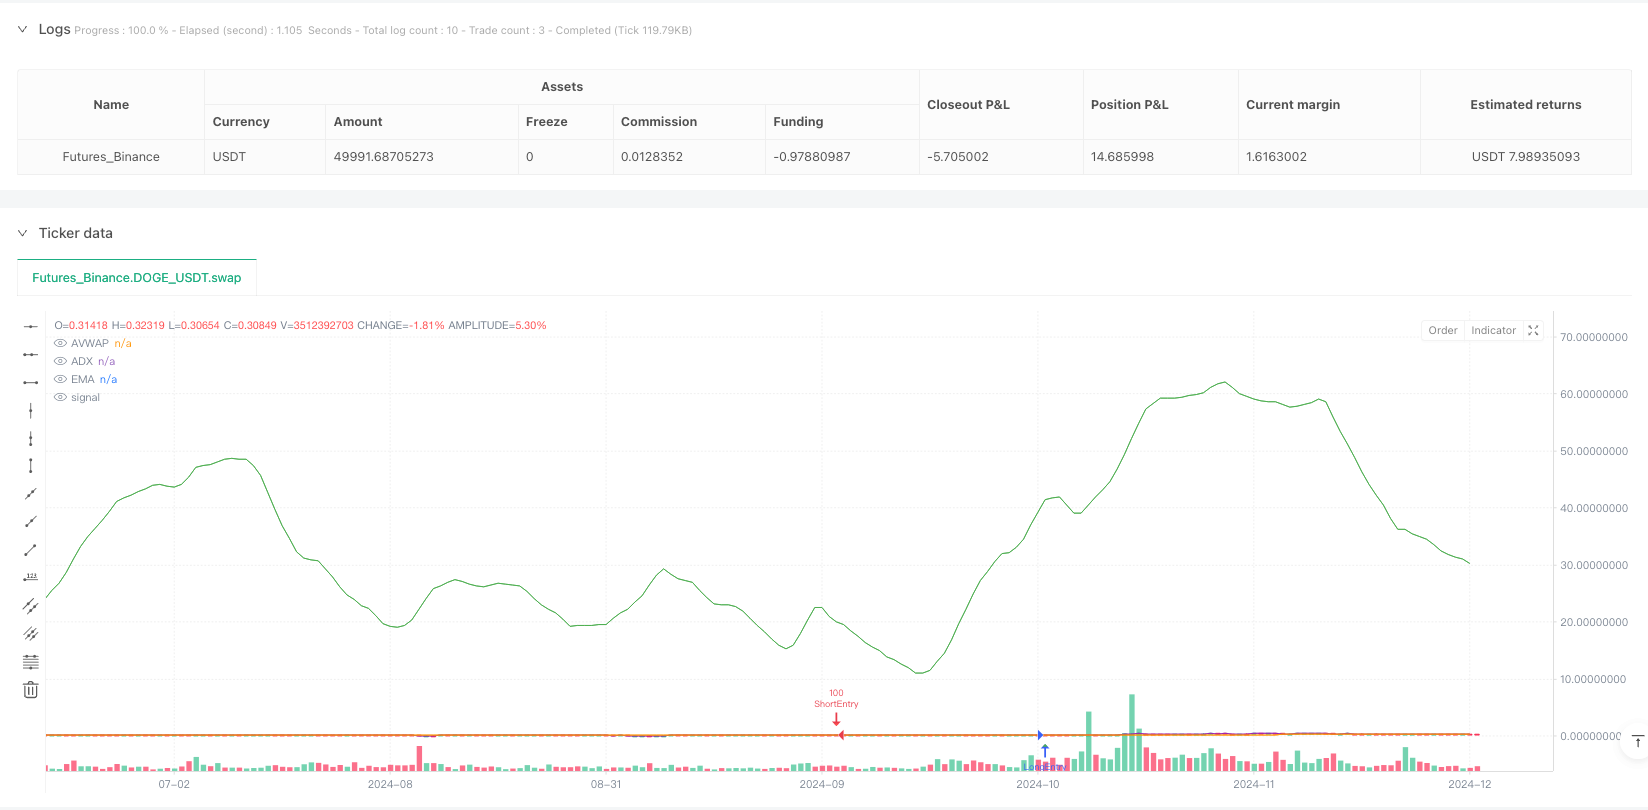
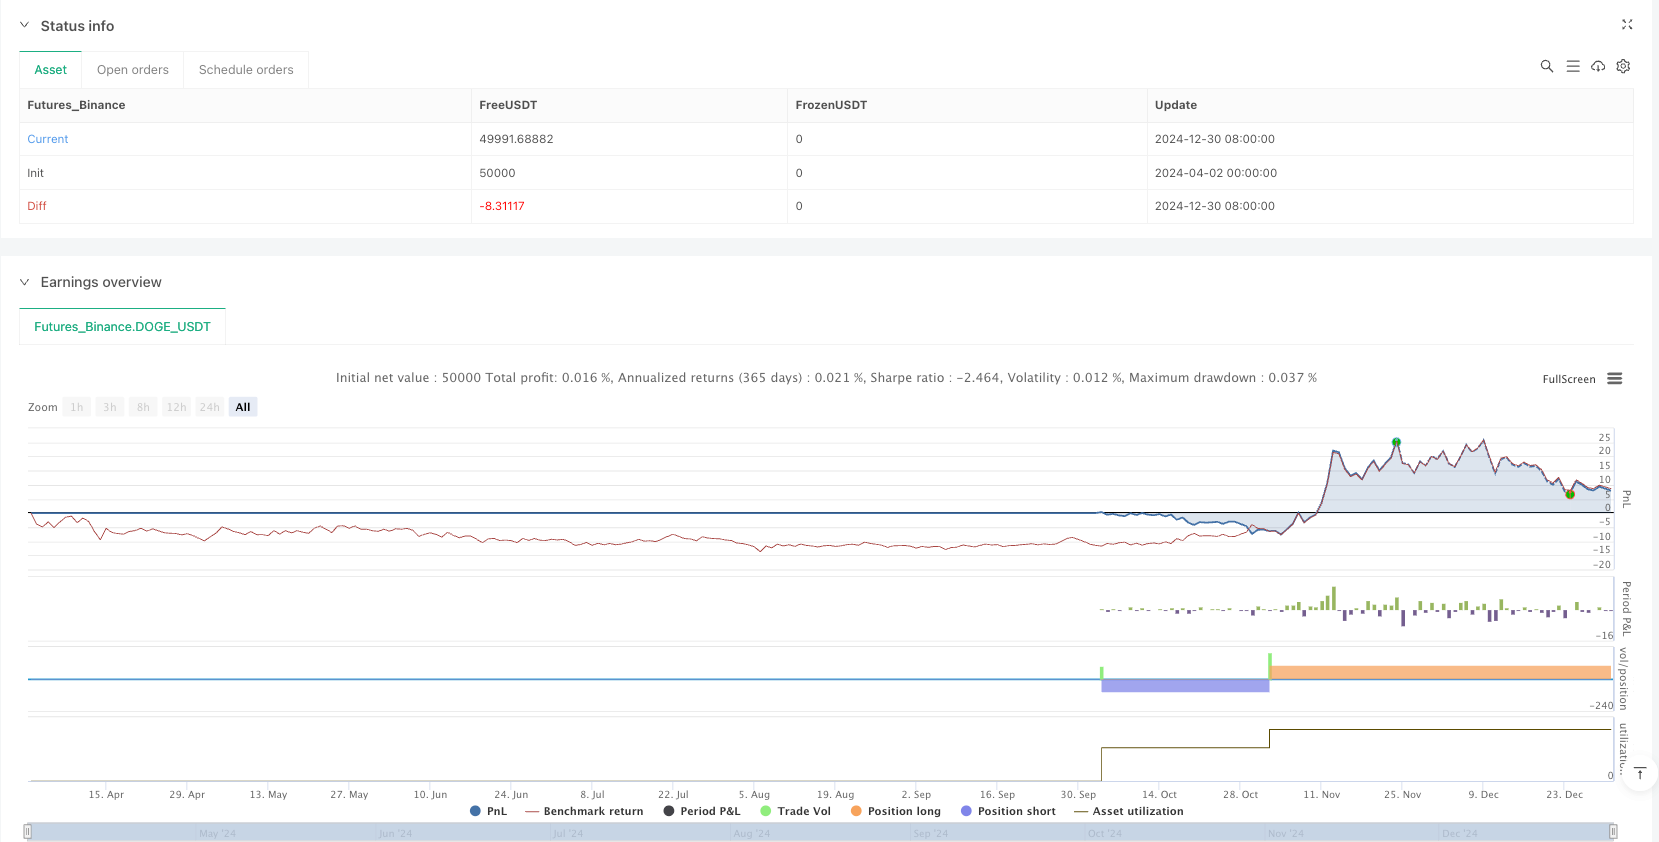
[trans]
概述
这是一种复杂的多指标交易策略,结合了成交量加权平均价格(AVWAP)、固定范围成交量分布(FRVP)、指数移动平均线(EMA)、相对强弱指数(RSI)、平均方向指数(ADX)和移动平均收敛散度(MACD)等多个技术分析工具,旨在通过指标聚合来识别高概率交易机会。
策略原理
策略通过多重条件来确定入场信号:
- 价格与AVWAP的交叉
- 价格相对EMA的位置
- RSI的强度判断
- MACD趋势动量
- ADX趋势强度确认
- 成交量过滤器
策略专注于亚洲、伦敦和纽约交易时段,这些时段通常流动性较好,交易信号更可靠。入场逻辑包括长仓和空仓两种模式,并设置了梯度止盈和止损机制。
策略优势
- 多指标组合,提高信号准确性
- 动态成交量过滤,避免低流动性交易
- 灵活的止盈止损策略
- 基于不同交易时段的策略优化
- 动态风险管理机制
- 可视化信号辅助决策
策略风险
- 多指标组合可能导致信号复杂性增加
- 回测数据可能存在过拟合风险
- 不同市场条件下性能可能不稳定
- 交易成本和滑点可能影响实际收益
策略优化方向
- 引入机器学习算法动态调整参数
- 增加更多交易时段适应性
- 优化止盈止损策略
- 引入更多过滤条件
- 开发跨品种通用性策略模型
总结
这是一个高度定制且多维度的交易策略,通过整合多个技术指标和交易时段特征,试图提高交易信号的质量和准确性。策略展示了量化交易中指标聚合和动态风险管理的复杂性。
||
Overview
This is a complex multi-indicator trading strategy that combines Volume Weighted Average Price (AVWAP), Fixed Range Volume Profile (FRVP), Exponential Moving Average (EMA), Relative Strength Index (RSI), Average Directional Index (ADX), and Moving Average Convergence Divergence (MACD) to identify high-probability trading opportunities through indicator confluence.
Strategy Principle
The strategy determines entry signals through multiple conditions:
- Price crossing with AVWAP
- Price position relative to EMA
- RSI strength assessment
- MACD trend momentum
- ADX trend strength confirmation
- Volume filter
The strategy focuses on Asian, London, and New York trading sessions, which typically have better liquidity and more reliable trading signals. Entry logic includes both long and short modes, with a gradient take-profit and stop-loss mechanism.
Strategy Advantages
- Multi-indicator combination improving signal accuracy
- Dynamic volume filtering to avoid low-liquidity trades
- Flexible take-profit and stop-loss strategy
- Optimization based on different trading sessions
- Dynamic risk management mechanism
- Visualization signals to assist decision-making
Strategy Risks
- Increased signal complexity due to multiple indicators
- Potential overfitting in backtesting data
- Potential performance instability under different market conditions
- Trading costs and slippage may affect actual returns
Strategy Optimization Directions
- Introduce machine learning algorithms for dynamic parameter adjustment
- Increase trading session adaptability
- Optimize take-profit and stop-loss strategies
- Add more filtering conditions
- Develop a universal strategy model across different instruments
Summary
This is a highly customized and multi-dimensional trading strategy that attempts to improve trading signal quality and accuracy by integrating multiple technical indicators and trading session characteristics. The strategy demonstrates the complexity of indicator confluence and dynamic risk management in quantitative trading. [/trans]
Source (PineScript)
/*backtest
start: 2024-04-02 00:00:00
end: 2024-12-31 00:00:00
period: 1d
basePeriod: 1d
exchanges: [{"eid":"Futures_Binance","currency":"DOGE_USDT"}]
*/

//@version=6
strategy("FRVP + AVWAP by Grok", overlay=true, initial_capital=10000, default_qty_type=strategy.percent_of_equity, default_qty_value=100)

// User Inputs
frvpLength = input.int(20, title="FRVP Length", minval=1)
emaLength = input.int(75, title="EMA Length", minval=1) // Adjusted for stronger trend confirmation
rsiLength = input.int(14, title="RSI Length", minval=1)
adxThreshold = input.int(20, title="ADX Strength Threshold", minval=0, maxval=100)
volumeMultiplier = input.float(1.0, title="Volume Multiplier", minval=0.1)

// Stop Loss & Take Profit for XAUUSD
stopLossPips = 25 // 25 pips SL for Asian, London, NY Sessions
takeProfit1Pips = 35 // TP1 at 35 pips
takeProfit2Pips = 80 // Final TP at 80 pips

// Stop-Loss & Take-Profit Multipliers (XAUUSD: 1 pip = 0.1 points on most platforms)
stopMultiplier = float(stopLossPips) * 0.1
tp1Multiplier = float(takeProfit1Pips) * 0.1
tp2Multiplier = float(takeProfit2Pips) * 0.1

// Indicators
avwap = ta.vwap(close)  // Volume Weighted Average Price (VWAP)
ema = ta.ema(close, emaLength)     // Exponential Moving Average
rsi = ta.rsi(close, rsiLength)     // Relative Strength Index
macdLine = ta.ema(close, 12) - ta.ema(close, 26)  // MACD Line
signalLine = ta.ema(macdLine, 9)   // MACD Signal Line
atr = ta.atr(14)                   // Average True Range

// Average Directional Index (ADX)
adxSmoothing = 14
[diplus, diminus, adx] = ta.dmi(14, adxSmoothing)  // Corrected syntax for ta.dmi()

// Volume Profile (FRVP - Fixed Range Volume Profile Midpoint)
highestHigh = ta.highest(high, frvpLength)
lowestLow = ta.lowest(low, frvpLength)
frvpMid = (highestHigh + lowestLow) / 2  // Midpoint of the range

// Detect Trading Sessions
currentHour = hour(time, "UTC")  // Renamed to avoid shadowing built-in 'hour'
isAsianSession = currentHour >= 0 and currentHour < 8
isLondonSession = currentHour >= 8 and currentHour < 16
isNYSession = currentHour >= 16 and currentHour < 23

// Entry Conditions
longCondition = ta.crossover(close, avwap) and close > ema and rsi > 30 and macdLine > signalLine and adx > adxThreshold
shortCondition = ta.crossunder(close, avwap) and close < ema and rsi < 70 and macdLine < signalLine and adx > adxThreshold

// Volume Filter
avgVolume = ta.sma(volume, 20)     // 20-period Simple Moving Average of volume
volumeFilter = volume > avgVolume * volumeMultiplier  // Trade only when volume exceeds its moving average

// Trade Execution with SL/TP for Sessions
if (longCondition and volumeFilter and (isAsianSession or isLondonSession or isNYSession))
    strategy.entry("LongEntry", strategy.long, qty=100)
    strategy.exit("LongTP1", from_entry="LongEntry", limit=close + tp1Multiplier)
    strategy.exit("LongExit", from_entry="LongEntry", stop=close - stopMultiplier, limit=close + tp2Multiplier)

if (shortCondition and volumeFilter and (isAsianSession or isLondonSession or isNYSession))
    strategy.entry("ShortEntry", strategy.short, qty=100)
    strategy.exit("ShortTP1", from_entry="ShortEntry", limit=close - tp1Multiplier)
    strategy.exit("ShortExit", from_entry="ShortEntry", stop=close + stopMultiplier, limit=close - tp2Multiplier)

// Plotting for Debugging and Visualization
plot(avwap, "AVWAP", color=color.purple, style=plot.style_line, offset=0)
plot(ema, "EMA", color=color.orange, style=plot.style_line, offset=0)
// plot(rsi, "RSI", color=color.yellow, style=plot.style_histogram, offset=0)  // Better in a separate pane
// plot(macdLine, "MACD Line", color=color.blue, style=plot.style_histogram, offset=0)  // Better in a separate pane
// plot(signalLine, "Signal Line", color=color.red, style=plot.style_histogram, offset=0)  // Better in a separate pane
plot(adx, "ADX", color=color.green, style=plot.style_line, offset=0)

// Optional: Plot entry/exit signals for visualization
plotshape(longCondition and volumeFilter ? close : na, title="Long Signal", location=location.belowbar, color=color.green, style=shape.triangleup, size=size.tiny)
plotshape(shortCondition and volumeFilter ? close : na, title="Short Signal", location=location.abovebar, color=color.red, style=shape.triangledown, size=size.tiny)
Detail
https://www.fmz.com/strategy/489195
Last Modified
2025-04-02 16:15:52