
23 KiB
Name
多时间框动态ATR交叉策略利用灵活参数优化趋势跟踪与风险管理-Dynamic-Multi-Timeframe-ATR-Crossover-Strategy-Optimizing-Trend-Following-and-Risk-Management-with-Flexible-Parameters
Author
ianzeng123
Strategy Description
[trans]
概述
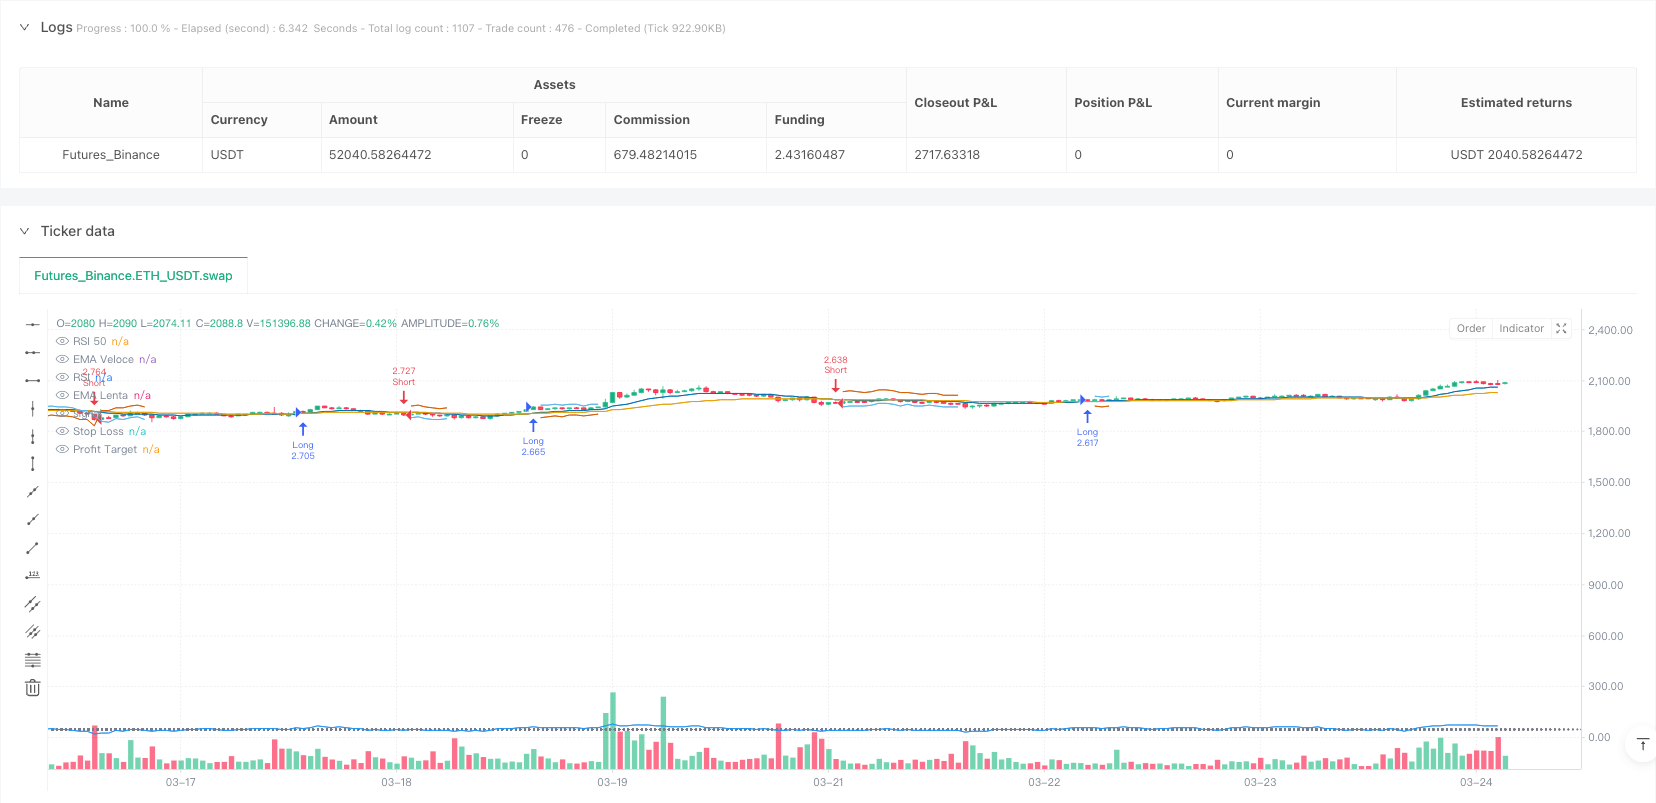
多时间框动态ATR交叉策略是一种灵活的交易系统,它能够根据不同的时间框架自动调整关键参数。该策略结合了指数移动平均线(EMA)交叉信号和相对强弱指标(RSI)确认,同时利用真实波动幅度均值(ATR)进行动态风险管理。无论您是在日线图、周线图还是各种分钟图表(如5分钟、30分钟、60分钟或4小时图)上交易,该策略都能智能地调整参数以适应不同市场环境,有效过滤虚假信号,提高交易成功率。
策略原理
该策略的核心原理是基于多个技术指标的协同作用和动态参数调整机制:
-
多时间框参数自适应:策略根据当前时间框架(日线、周线、30分钟、60分钟、4小时或5分钟)自动选择最优的指标参数。例如,在日线图上使用较长周期的EMA和标准RSI参数,而在30分钟图表上则将"天"转换为相应的"柱数",并略微减少周期值以提高反应速度。
-
信号生成逻辑:
- 多头入场:当快速EMA上穿慢速EMA且RSI高于50时生成。
- 空头入场:当快速EMA下穿慢速EMA且RSI低于50时生成。 这种双重确认机制有效减少了虚假信号。
-
风险管理框架:
- 基于ATR的止损位:多头仓位的止损设置在"当前价格 - (ATR × 止损乘数)";空头仓位则设置在"当前价格 + (ATR × 止损乘数)"。
- 基于ATR的止盈位:类似地,利用ATR乘以利润乘数确定止盈水平。
- 动态尾随止损:可选功能,根据ATR动态调整止损位,随着价格向有利方向移动而跟进,锁定部分利润。
-
资金配置:每笔交易使用总资金的10%,这种基于百分比的仓位管理允许策略随账户规模扩展。
策略优势
-
多时间框灵活性:策略能够无缝适应不同的时间框架,保持一致的交易逻辑同时调整参数以匹配特定时间框架的市场特征。这使得交易者可以在不同时间尺度上应用相同的策略,提高了策略的实用性。
-
可靠的信号过滤:通过要求EMA交叉和RSI确认的双重验证机制,策略显著减少了错误信号。虽然这可能导致入场略有延迟,但大幅提高了信号质量和可靠性。
-
动态风险管理:使用ATR进行止损和止盈设置,使策略能够适应市场波动性的变化。在波动较大的市场中自动扩大止损范围,而在平静市场中则收紧止损,这种方式比固定点数止损更为智能。
-
视觉友好显示:策略采用色盲友好的调色板(Okabe-Ito调色板),使不同视觉能力的交易者都能轻松识别图表上的各种指标和信号。
-
参数可定制性:所有关键参数都可以通过输入面板调整,允许交易者根据不同资产或市场条件微调策略表现。
策略风险
-
趋势变化滞后反应:由于策略依赖EMA交叉和RSI确认,在快速反转的市场中可能会出现滞后,导致入场点不够理想或止损被触发的风险。解决方法是针对高波动性市场可以考虑使用更短的EMA周期或降低RSI门槛。
-
假突破风险:尽管策略使用双重确认机制,但在区间震荡市场中仍可能产生假突破信号。可以通过添加额外的过滤条件(如成交量确认或波动率指标)来减轻这一风险。
-
参数优化陷阱:过度优化特定时间框架的参数可能导致过拟合,在未来市场环境中表现不佳。应定期重新评估参数,并在不同的市场条件下进行回测以确保稳健性。
-
资金分配固定:当前策略对每笔交易固定分配10%的资金,这可能不适合所有市场条件或风险偏好。考虑实施动态的资金管理系统,根据市场波动性或交易信号强度调整仓位大小。
策略优化方向
-
自适应参数优化:目前策略根据预设值为不同时间框架选择参数。可以进一步发展为根据市场状态(如波动性、趋势强度)动态调整参数,例如在高波动性市场中使用更长的EMA周期以减少噪音。
-
多指标融合:可以考虑整合其他互补指标,如成交量指标或趋势强度指标(如ADX),以增强信号质量。特别是,将成交量作为确认因素可以大幅减少假突破的可能性。
-
智能资金管理:将现有的固定百分比资金分配升级为基于波动性和信号强度的动态系统。例如,当RSI和EMA交叉提供强烈信号时增加仓位,反之则减少,从而优化风险回报比。
-
时间过滤器:引入基于交易时段和市场活跃度的时间过滤器。一些市场在特定时间段内更具方向性或更容易产生假信号,通过避开这些时段可以提高整体策略性能。
-
机器学习增强:将机器学习方法应用于参数优化和信号过滤,可以帮助策略更好地适应不断变化的市场条件,识别非线性模式,并动态调整到最佳参数配置。
总结
多时间框动态ATR交叉策略是一个精心设计的交易系统,通过灵活的参数调整、可靠的信号验证和强健的风险管理来平衡交易机会和风险控制。其独特之处在于能够无缝适应从分钟到周线的各种时间框架,保持一致的交易逻辑同时优化特定时间范围的参数。
虽然策略可能在快速反转市场中表现出一定的滞后性,但其专注于确认真实趋势的方法有助于减少错误交易,这对长期交易成功至关重要。通过进一步整合自适应参数、多指标融合和智能资金管理,该策略有潜力在各种市场环境中提供更加稳健的表现。
对于寻求全面且适应性强的技术交易系统的交易者而言,这款策略提供了坚实的框架,既可以直接应用,也可以作为更复杂系统的基础。最重要的是,其设计理念强调了交易系统应该如何智能地适应不同的市场环境,而不是试图用固定参数应对所有情况,这是成功交易的关键原则。
||
Overview
The Dynamic Multi-Timeframe ATR Crossover Strategy is a versatile trading system that automatically adjusts key parameters based on different timeframes. This strategy combines Exponential Moving Average (EMA) crossover signals and Relative Strength Index (RSI) confirmation, while utilizing Average True Range (ATR) for dynamic risk management. Whether you're trading on daily charts, weekly charts, or various minute charts (such as 5-minute, 30-minute, 60-minute, or 4-hour charts), the strategy intelligently adjusts parameters to adapt to different market environments, effectively filtering false signals and improving trading success rates.
Strategy Principles
The core principles of this strategy are based on the synergistic effect of multiple technical indicators and dynamic parameter adjustment mechanisms:
-
Multi-Timeframe Parameter Adaptation: The strategy automatically selects optimal indicator parameters based on the current timeframe (daily, weekly, 30-minute, 60-minute, 4-hour, or 5-minute). For example, it uses longer EMA periods and standard RSI parameters on daily charts, while on 30-minute charts, it converts "days" into corresponding "bars" and slightly reduces period values to improve responsiveness.
-
Signal Generation Logic:
- Long Entry: Generated when the fast EMA crosses above the slow EMA and the RSI is above 50.
- Short Entry: Generated when the fast EMA crosses below the slow EMA and the RSI is below 50. This dual confirmation mechanism effectively reduces false signals.
-
Risk Management Framework:
- ATR-based Stop Loss: For long positions, the stop loss is set at "Current Price - (ATR × Stop Loss Multiplier)"; for short positions, it's set at "Current Price + (ATR × Stop Loss Multiplier)".
- ATR-based Take Profit: Similarly, take profit levels are determined using ATR multiplied by a profit multiplier.
- Dynamic Trailing Stop: An optional feature that dynamically adjusts the stop loss position based on ATR, following price movements in the favorable direction to lock in partial profits.
-
Capital Allocation: Each trade uses 10% of total funds, allowing the strategy to scale with account size through percentage-based position management.
Strategy Advantages
-
Multi-Timeframe Flexibility: The strategy seamlessly adapts to different timeframes, maintaining consistent trading logic while adjusting parameters to match the market characteristics of specific timeframes. This allows traders to apply the same strategy across different time scales, enhancing its practicality.
-
Reliable Signal Filtering: Through the dual verification mechanism requiring both EMA crossovers and RSI confirmation, the strategy significantly reduces false signals. While this may lead to slightly delayed entries, it greatly improves signal quality and reliability.
-
Dynamic Risk Management: Using ATR for stop loss and take profit settings enables the strategy to adapt to changes in market volatility. It automatically widens stop loss ranges in more volatile markets and tightens them in calmer markets, making it more intelligent than fixed-point stop losses.
-
Visually Friendly Display: The strategy employs a colorblind-friendly palette (Okabe-Ito palette), making it easy for traders with different visual abilities to identify various indicators and signals on the chart.
-
Parameter Customizability: All key parameters can be adjusted through the input panel, allowing traders to fine-tune strategy performance for different assets or market conditions.
Strategy Risks
-
Delayed Reaction to Trend Changes: Since the strategy relies on EMA crossovers and RSI confirmation, it may exhibit lag in rapidly reversing markets, leading to less than ideal entry points or stop losses being triggered. The solution is to consider using shorter EMA periods or lowering RSI thresholds for high-volatility markets.
-
False Breakout Risk: Despite using a dual confirmation mechanism, the strategy may still generate false breakout signals in range-bound, oscillating markets. This risk can be mitigated by adding additional filtering conditions (such as volume confirmation or volatility indicators).
-
Parameter Optimization Trap: Over-optimizing parameters for specific timeframes may lead to overfitting, resulting in poor performance in future market environments. Parameters should be regularly reassessed and backtested under different market conditions to ensure robustness.
-
Fixed Capital Allocation: The current strategy allocates a fixed 10% of funds to each trade, which may not be suitable for all market conditions or risk preferences. Consider implementing a dynamic fund management system that adjusts position size based on market volatility or signal strength.
Strategy Optimization Directions
-
Adaptive Parameter Optimization: Currently, the strategy selects parameters for different timeframes based on preset values. It could be further developed to dynamically adjust parameters based on market states (such as volatility, trend strength), for example, using longer EMA periods in high-volatility markets to reduce noise.
-
Multi-Indicator Fusion: Consider integrating other complementary indicators, such as volume indicators or trend strength indicators (like ADX), to enhance signal quality. In particular, using volume as a confirmation factor can significantly reduce the possibility of false breakouts.
-
Intelligent Fund Management: Upgrade the existing fixed percentage fund allocation to a dynamic system based on volatility and signal strength. For example, increase position size when RSI and EMA crossovers provide strong signals, and decrease it otherwise, optimizing the risk-reward ratio.
-
Time Filters: Introduce time filters based on trading sessions and market activity. Some markets are more directional or more prone to false signals during specific time periods; avoiding these periods can improve overall strategy performance.
-
Machine Learning Enhancement: Apply machine learning methods to parameter optimization and signal filtering, helping the strategy better adapt to changing market conditions, identify non-linear patterns, and dynamically adjust to optimal parameter configurations.
Summary
The Dynamic Multi-Timeframe ATR Crossover Strategy is a carefully designed trading system that balances trading opportunities and risk control through flexible parameter adjustment, reliable signal validation, and robust risk management. Its uniqueness lies in its ability to seamlessly adapt to various timeframes from minutes to weeks, maintaining consistent trading logic while optimizing parameters for specific time ranges.
Although the strategy may exhibit some lag in rapidly reversing markets, its focus on confirming genuine trends helps reduce erroneous trades, which is crucial for long-term trading success. By further integrating adaptive parameters, multi-indicator fusion, and intelligent fund management, the strategy has the potential to provide more robust performance across various market environments.
For traders seeking a comprehensive and adaptable technical trading system, this strategy provides a solid framework that can be applied directly or used as a foundation for more complex systems. Most importantly, its design philosophy emphasizes how trading systems should intelligently adapt to different market environments rather than trying to approach all situations with fixed parameters, which is a key principle for successful trading.
[/trans]
Source (PineScript)
/*backtest
start: 2024-03-26 00:00:00
end: 2025-03-25 00:00:00
period: 1h
basePeriod: 1h
exchanges: [{"eid":"Futures_Binance","currency":"ETH_USDT"}]
*/

//@version=6
strategy("FlexATR", overlay=true, initial_capital=100000, currency=currency.USD,
     default_qty_type=strategy.percent_of_equity, default_qty_value=10, calc_on_every_tick=true)


// =====================
// Determinazione del timeframe
// ---------------------
// "resString" contiene il valore del timeframe (es. "D", "1D", "30", "60", "240", "5", "W", "1W", ecc.)
// "res_minutes" è il numero di minuti per barra; gestiamo anche i casi per D, W e M.
resString = timeframe.period
var float res_minutes = na
if resString == "D" or resString == "1D"
    res_minutes := 1440.0
else if resString == "W" or resString == "1W"
    res_minutes := 10080.0
else if resString == "M" or resString == "1M"
    res_minutes := 43200.0
else
    res_minutes := nz(str.tonumber(resString), 1)  // ad es. "30", "60", "240", "5", ecc.

// Se il grafico è intraday (minuti/barra < 1440)
intraday = res_minutes < 1440.0
// Calcolo del numero di barre in un giorno (utile per convertire "giorni" in barre)
barsPerDay = intraday ? (1440.0 / res_minutes) : 1.0

// =====================
// INPUT PARAMETRI MODIFICABILI VIA FORM PER OGNI TIMEFRAME
// =====================

// [Daily Parameters]
fastDays_Daily = input.float(8.0,  title="EMA Veloce (giorni)",  group="Daily Parameters")
slowDays_Daily = input.float(21.0, title="EMA Lenta (giorni)",  group="Daily Parameters")
rsiDays_Daily  = input.float(14.0, title="RSI (giorni)",         group="Daily Parameters")
atrDays_Daily  = input.float(14.0, title="ATR Period (giorni)",  group="Daily Parameters")

// [Weekly Parameters]
fastDays_Weekly = input.float(40.0,  title="EMA Veloce (giorni)",  group="Weekly Parameters")
slowDays_Weekly = input.float(105.0, title="EMA Lenta (giorni)",  group="Weekly Parameters")
rsiDays_Weekly  = input.float(14.0,  title="RSI (giorni)",         group="Weekly Parameters")
atrDays_Weekly  = input.float(14.0,  title="ATR Period (giorni)",  group="Weekly Parameters")

// [30m Parameters] – MODIFICATI per maggiore reattività:
// EMA veloce ridotta da 0.4 a 0.35; EMA lenta da 1.0 a 0.9; RSI e ATR da 0.5 a 0.45.
fastDays_30m = input.float(0.35, title="EMA Veloce (giorni)", group="30m Parameters")
slowDays_30m = input.float(0.9,  title="EMA Lenta (giorni)",  group="30m Parameters")
rsiDays_30m  = input.float(0.45, title="RSI (giorni)",         group="30m Parameters")
atrDays_30m  = input.float(0.45, title="ATR Period (giorni)",  group="30m Parameters")

// [60m Parameters]
fastDays_60m = input.float(0.6, title="EMA Veloce (giorni)", group="60m Parameters")
slowDays_60m = input.float(1.6, title="EMA Lenta (giorni)",  group="60m Parameters")
rsiDays_60m  = input.float(0.6, title="RSI (giorni)",         group="60m Parameters")
atrDays_60m  = input.float(0.6, title="ATR Period (giorni)",  group="60m Parameters")

// [4h Parameters]
fastDays_4h = input.float(1.3, title="EMA Veloce (giorni)", group="4h Parameters")
slowDays_4h = input.float(3.5, title="EMA Lenta (giorni)",  group="4h Parameters")
rsiDays_4h  = input.float(1.3, title="RSI (giorni)",         group="4h Parameters")
atrDays_4h  = input.float(1.3, title="ATR Period (giorni)",  group="4h Parameters")

// [5m Parameters]
fastDays_5m = input.float(0.15, title="EMA Veloce (giorni)", group="5m Parameters")
slowDays_5m = input.float(0.45, title="EMA Lenta (giorni)",  group="5m Parameters")
rsiDays_5m  = input.float(0.15, title="RSI (giorni)",         group="5m Parameters")
atrDays_5m  = input.float(0.15, title="ATR Period (giorni)",  group="5m Parameters")

// =====================
// SELEZIONE DEI PARAMETRI IN BASE AL TIMEFRAME CORRENTE
// Se il timeframe corrente non corrisponde a nessuna categoria, uso i parametri Daily.
fastDays = (resString=="D" or resString=="1D")      ? fastDays_Daily  :
           (resString=="W" or resString=="1W")      ? fastDays_Weekly :
           (resString=="30")                        ? fastDays_30m    :
           (resString=="60")                        ? fastDays_60m    :
           (resString=="240")                       ? fastDays_4h     :
           (resString=="5")                         ? fastDays_5m     : fastDays_Daily

slowDays = (resString=="D" or resString=="1D")      ? slowDays_Daily  :
           (resString=="W" or resString=="1W")      ? slowDays_Weekly :
           (resString=="30")                        ? slowDays_30m    :
           (resString=="60")                        ? slowDays_60m    :
           (resString=="240")                       ? slowDays_4h     :
           (resString=="5")                         ? slowDays_5m     : slowDays_Daily

rsiDays  = (resString=="D" or resString=="1D")      ? rsiDays_Daily   :
           (resString=="W" or resString=="1W")      ? rsiDays_Weekly  :
           (resString=="30")                        ? rsiDays_30m     :
           (resString=="60")                        ? rsiDays_60m     :
           (resString=="240")                       ? rsiDays_4h      :
           (resString=="5")                         ? rsiDays_5m      : rsiDays_Daily

atrDays  = (resString=="D" or resString=="1D")      ? atrDays_Daily   :
           (resString=="W" or resString=="1W")      ? atrDays_Weekly  :
           (resString=="30")                        ? atrDays_30m     :
           (resString=="60")                        ? atrDays_60m     :
           (resString=="240")                       ? atrDays_4h      :
           (resString=="5")                         ? atrDays_5m      : atrDays_Daily

// =====================
// Conversione dei periodi (espresso in "giorni") in numero di barre
fastPeriod = intraday ? math.round(fastDays * barsPerDay) : math.round(fastDays)
slowPeriod = intraday ? math.round(slowDays * barsPerDay) : math.round(slowDays)
rsiPeriod  = intraday ? math.round(rsiDays * barsPerDay)  : math.round(rsiDays)
atrPeriod  = intraday ? math.round(atrDays * barsPerDay)  : math.round(atrDays)

// =====================
// Definizione dei colori "color-blind friendly" (palette Okabe-Ito)
// EMA Veloce: Blu (RGB 0,114,178)
// EMA Lenta: Arancione (RGB 230,159,0)
// Stop Loss: Vermilion (RGB 213,94,0)
// Profit Target: Azzurro (RGB 86,180,233)
emaFastColor = color.rgb(0,114,178)
emaSlowColor = color.rgb(230,159,0)
stopColor    = color.rgb(213,94,0)
targetColor  = color.rgb(86,180,233)

// =====================
// Calcolo degli indicatori
emaFast  = ta.ema(close, fastPeriod)
emaSlow  = ta.ema(close, slowPeriod)
rsiValue = ta.rsi(close, rsiPeriod)
atrValue = ta.atr(atrPeriod)

// =====================
// Input per la gestione del rischio (modificabili via form)
atrStopMult   = input.float(3.0, title="Moltiplicatore ATR per Stop Loss", step=0.1)
atrProfitMult = input.float(1.5, title="Moltiplicatore ATR per Profit Target", step=0.1)

// NUOVO: Abilitazione del Trailing Stop Dinamico
enableTrailingStop = input.bool(true, title="Abilita Trailing Stop Dinamico")
atrTrailMult       = input.float(1.0, title="Moltiplicatore ATR per Trailing Stop", step=0.1)

// =====================
// Condizioni di ingresso
// Long: quando l'EMA veloce incrocia al rialzo quella lenta e l'RSI è > 50
longCondition = ta.crossover(emaFast, emaSlow) and (rsiValue > 50)
// Short: quando l'EMA veloce incrocia al ribasso quella lenta e l'RSI è < 50
shortCondition = ta.crossunder(emaFast, emaSlow) and (rsiValue < 50)

// Calcolo dei livelli fissi di stop loss e profit target basati sull'ATR
longStop   = close - atrValue * atrStopMult
longTarget = close + atrValue * atrProfitMult
shortStop  = close + atrValue * atrStopMult
shortTarget= close - atrValue * atrProfitMult

// =====================
// Plot degli indicatori
plot(emaFast, title="EMA Veloce", color=emaFastColor)
plot(emaSlow, title="EMA Lenta", color=emaSlowColor)
hline(50, title="RSI 50", color=color.gray, linestyle=hline.style_dotted)
plot(rsiValue, title="RSI", color=color.blue, display=display.none)

// =====================
// Logica degli ingressi e gestione delle posizioni (attiva solo se time >= startDate)

if (longCondition)
    strategy.entry("Long", strategy.long)
if (shortCondition)
    strategy.entry("Short", strategy.short)

// Per le uscite, se il trailing stop dinamico è abilitato, lo usiamo; altrimenti l'uscita fissa
if (strategy.position_size > 0)
    if (enableTrailingStop)
        strategy.exit("Exit Long", from_entry="Long", trail_offset=atrValue * atrTrailMult, limit=longTarget)
    else
        strategy.exit("Exit Long", from_entry="Long", stop=longStop, limit=longTarget)

if (strategy.position_size < 0)
    if (enableTrailingStop)
        strategy.exit("Exit Short", from_entry="Short", trail_offset=atrValue * atrTrailMult, limit=shortTarget)
    else
        strategy.exit("Exit Short", from_entry="Short", stop=shortStop, limit=shortTarget)

// =====================
// Plot dei livelli di Stop Loss e Profit Target quando in posizione
plot(strategy.position_size > 0 ? longStop   : na, title="Stop Loss",   style=plot.style_linebr, color=stopColor)
plot(strategy.position_size > 0 ? longTarget : na, title="Profit Target", style=plot.style_linebr, color=targetColor)
plot(strategy.position_size < 0 ? shortStop  : na, title="Stop Loss",   style=plot.style_linebr, color=stopColor)
plot(strategy.position_size < 0 ? shortTarget: na, title="Profit Target", style=plot.style_linebr, color=targetColor)
Detail
https://www.fmz.com/strategy/488292
Last Modified
2025-03-26 16:40:51