
12 KiB
Name
多时间尺度SMA趋势跟踪与动态止损策略-Multi-Timeframe-SMA-Trend-Following-Strategy-with-Dynamic-Stop-Loss
Author
ChaoZhang
Strategy Description
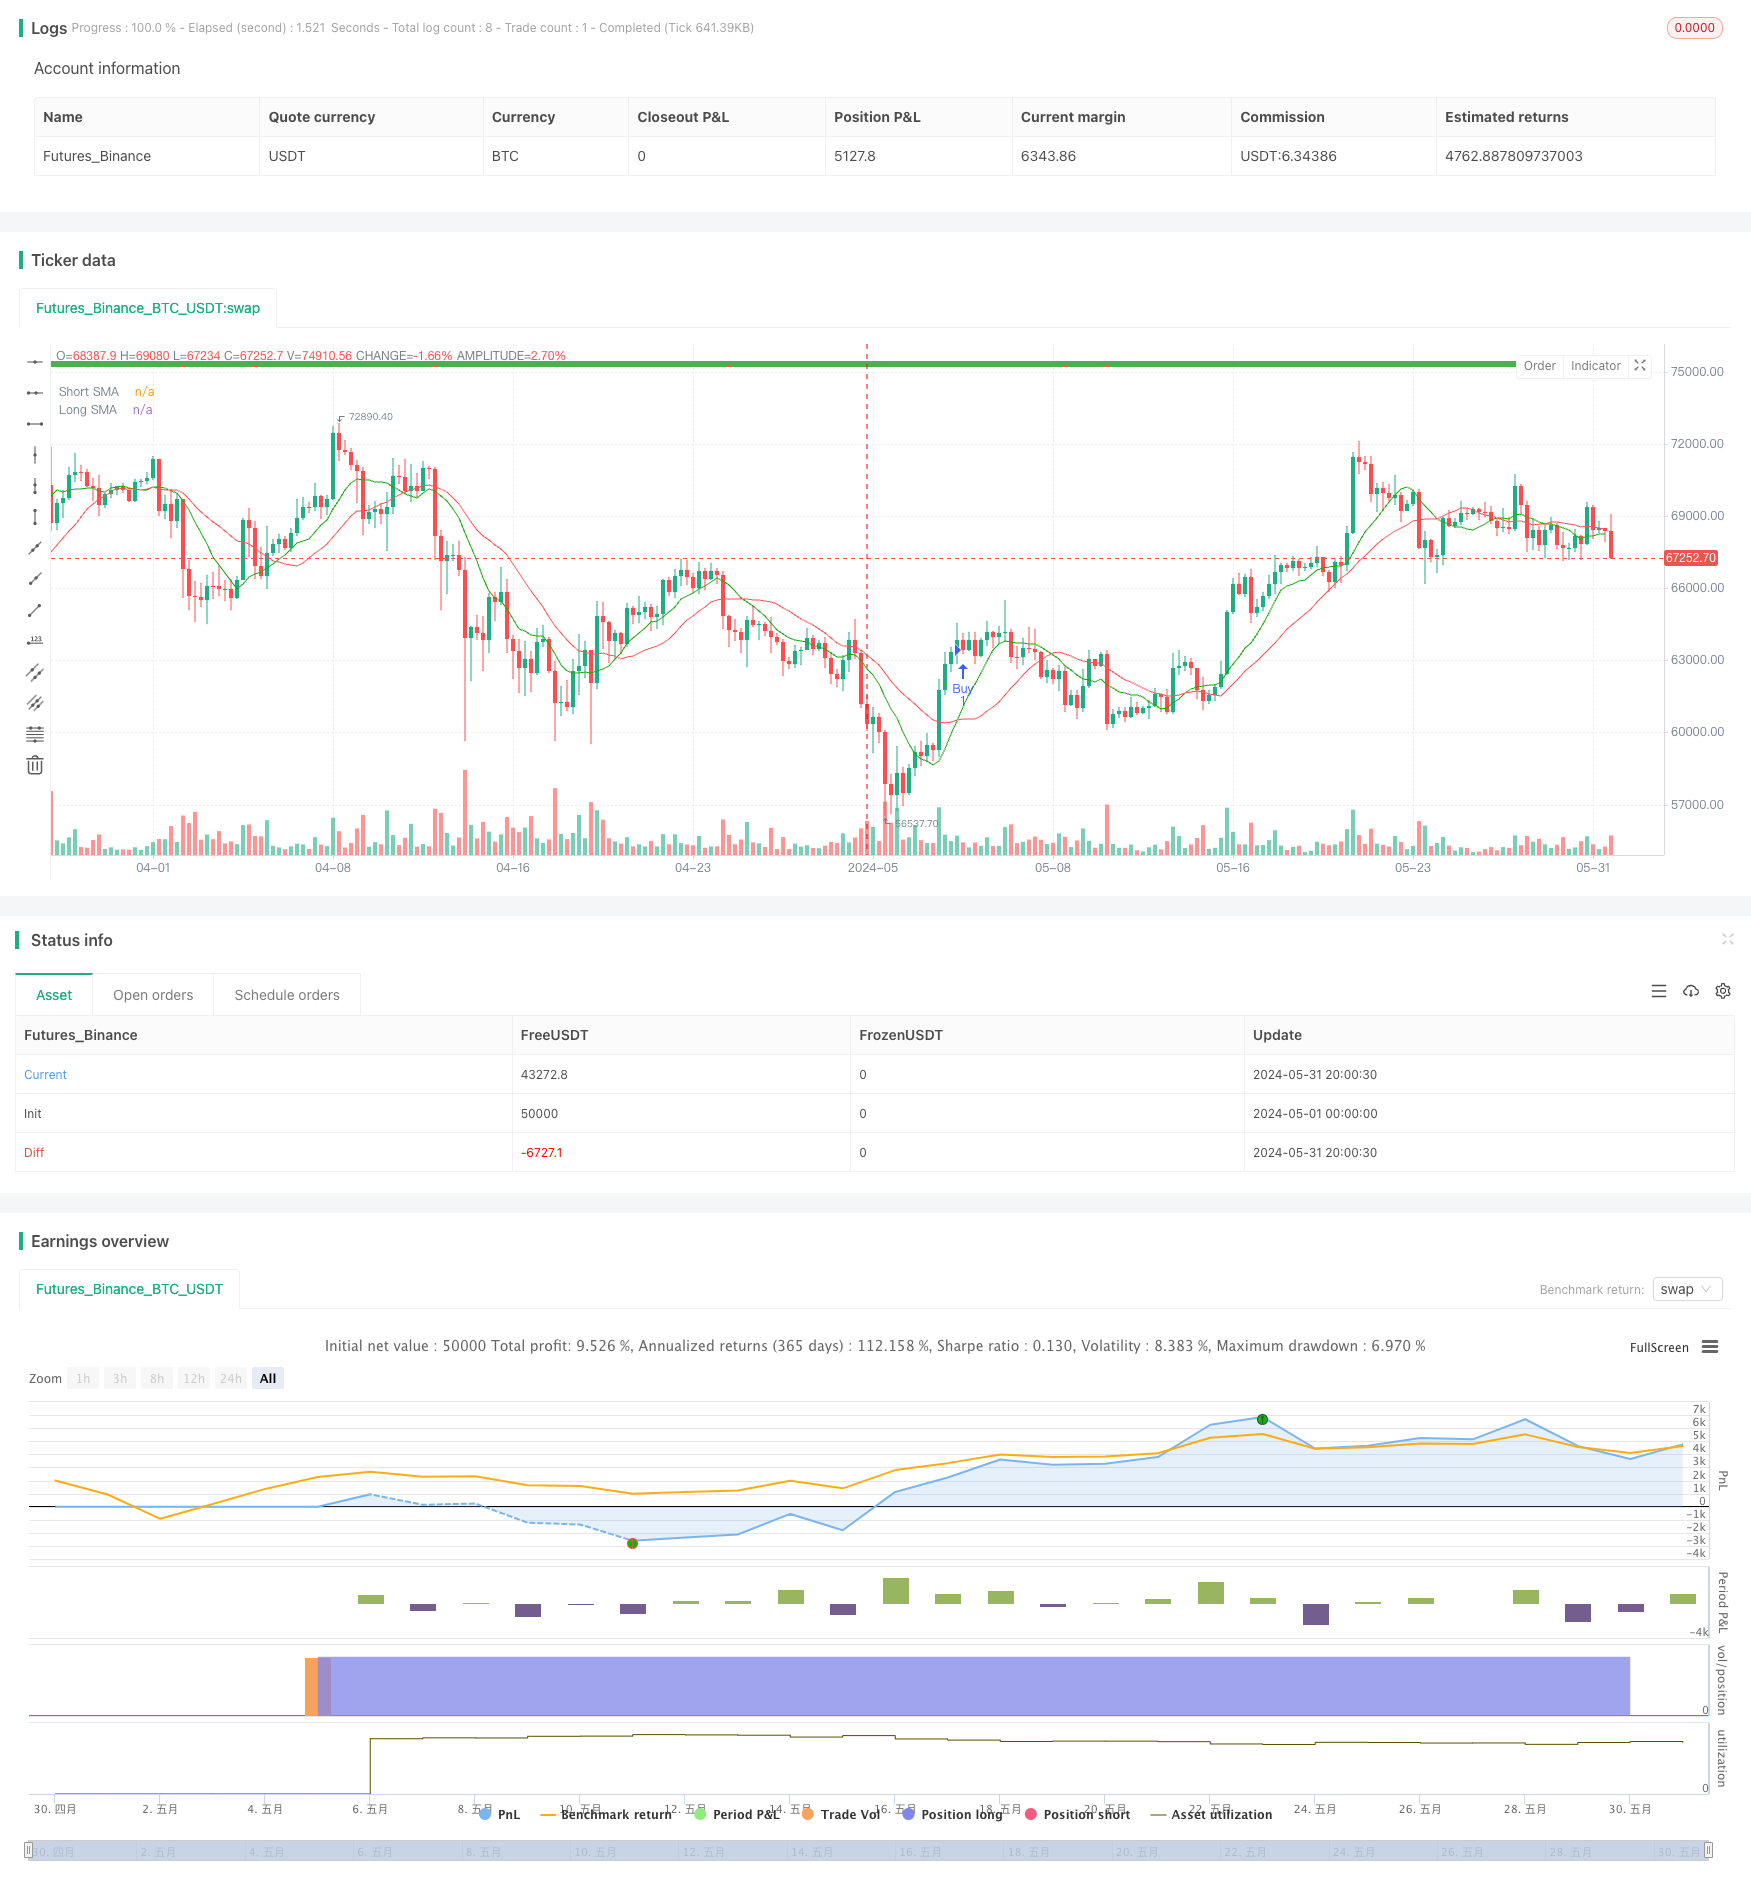
[trans]
概述
该策略基于不同时间尺度的简单移动平均线(SMA)来捕捉市场趋势。通过比较短期和长期SMA的相对位置,生成买入和卖出信号。同时,该策略采用趋势确认条件来过滤伪信号,提高交易准确性。此外,该策略还设置了止盈和止损功能,实现风险管理。
策略原理
- 计算短期和长期SMA,用于判断市场趋势方向。
- 当短期SMA上穿长期SMA时,生成买入信号;当短期SMA下穿长期SMA时,生成卖出信号。
- 利用趋势确认条件过滤伪信号,只有当主要趋势为多头时才执行买入,只有当主要趋势为空头时才执行卖出。
- 设置止盈和止损功能,控制交易风险。当价格达到预设的止盈或止损水平时,平仓离场。
- 根据趋势确认条件动态调整持仓。当主要趋势发生变化时,及时平仓,防止趋势反转带来的损失。
策略优势
- 趋势跟踪:该策略基于不同时间尺度的SMA,能够有效捕捉市场主要趋势,适应不同市场状态。
- 趋势确认:通过引入趋势确认条件,过滤伪信号,提高交易信号的可靠性,减少无效交易。
- 风险管理:内置止盈和止损功能,帮助控制交易风险,保护投资者资金安全。
- 动态调整:根据趋势确认条件动态调整持仓,及时应对市场变化,减少趋势反转带来的损失。
策略风险
- 参数优化风险:该策略的表现依赖于SMA周期、止盈止损水平等参数的选择。不恰当的参数设置可能导致策略效果不佳。
- 震荡市风险:在震荡市场环境下,频繁的交易信号可能导致过度交易,增加交易成本和风险。
- 突发事件风险:面对突发重大事件,市场可能出现剧烈波动,该策略可能无法及时应对,导致较大损失。
策略优化方向
- 引入更多技术指标:结合其他技术指标,如MACD、RSI等,提高趋势判断的准确性和稳健性。
- 优化参数选择:通过历史数据回测和参数优化,寻找最佳的SMA周期、止盈止损水平等参数组合,提升策略表现。
- 改进风险管理:引入更高级的风险管理技术,如动态止损、仓位管理等,进一步控制风险敞口。
- 适应不同市场状态:根据市场波动性和趋势强度,动态调整策略参数,使策略能够适应不同的市场状态。
总结
该多时间尺度SMA趋势跟踪与动态止损策略利用不同时间尺度的SMA捕捉市场趋势,通过趋势确认条件过滤伪信号,同时设置止盈止损和动态持仓调整功能,实现了趋势跟踪和风险管理的目标。尽管该策略具有一定优势,但仍面临参数优化、震荡市和突发事件等风险。未来可通过引入更多技术指标、优化参数选择、改进风险管理和适应不同市场状态等方面进行优化,以提升策略的稳健性和盈利能力。
||
Overview
This strategy utilizes Simple Moving Averages (SMAs) on multiple timeframes to capture market trends. By comparing the relative positions of short-term and long-term SMAs, it generates buy and sell signals. The strategy also employs trend confirmation conditions to filter out false signals and improve trading accuracy. Additionally, it incorporates take profit and stop loss features for risk management.
Strategy Principles
- Calculate short-term and long-term SMAs to determine the direction of the market trend.
- Generate a buy signal when the short-term SMA crosses above the long-term SMA, and a sell signal when the short-term SMA crosses below the long-term SMA.
- Use trend confirmation conditions to filter out false signals. Only execute buys when the main trend is bullish, and only execute sells when the main trend is bearish.
- Implement take profit and stop loss features to control trading risk. Close positions when the price reaches the predefined take profit or stop loss levels.
- Dynamically adjust positions based on trend confirmation conditions. Promptly close positions when the main trend changes to avoid losses from trend reversals.
Strategy Advantages
- Trend Following: By utilizing SMAs on different timeframes, the strategy effectively captures the main market trends and adapts to various market conditions.
- Trend Confirmation: The introduction of trend confirmation conditions filters out false signals, improving the reliability of trading signals and reducing invalid trades.
- Risk Management: The built-in take profit and stop loss features help control trading risk and protect investors' capital.
- Dynamic Adjustment: Positions are dynamically adjusted based on trend confirmation conditions, allowing the strategy to respond to market changes in a timely manner and mitigate losses from trend reversals.
Strategy Risks
- Parameter Optimization Risk: The performance of the strategy depends on the selection of parameters such as SMA periods and take profit/stop loss levels. Inappropriate parameter settings may lead to suboptimal strategy performance.
- Choppy Market Risk: In choppy market conditions, frequent trading signals may result in overtrading, increasing trading costs and risks.
- Unexpected Event Risk: In the face of unexpected major events, the market may experience severe volatility, and the strategy may not be able to respond promptly, leading to significant losses.
Strategy Optimization Directions
- Incorporate Additional Technical Indicators: Combine other technical indicators, such as MACD and RSI, to improve the accuracy and robustness of trend identification.
- Optimize Parameter Selection: Through historical data backtesting and parameter optimization, find the optimal combination of SMA periods, take profit/stop loss levels, and other parameters to enhance strategy performance.
- Improve Risk Management: Introduce more advanced risk management techniques, such as dynamic stop loss and position sizing, to further control risk exposure.
- Adapt to Different Market Conditions: Dynamically adjust strategy parameters based on market volatility and trend strength, enabling the strategy to adapt to different market conditions.
Conclusion
This multi-timeframe SMA trend following strategy with dynamic stop loss utilizes SMAs on different timeframes to capture market trends, filters out false signals using trend confirmation conditions, and incorporates take profit/stop loss and dynamic position adjustment features to achieve trend following and risk management objectives. Although the strategy has certain advantages, it still faces risks such as parameter optimization, choppy markets, and unexpected events. Future optimizations can focus on incorporating additional technical indicators, optimizing parameter selection, improving risk management, and adapting to different market conditions to enhance the robustness and profitability of the strategy. [/trans]
Source (PineScript)
/*backtest
start: 2024-05-01 00:00:00
end: 2024-05-31 23:59:59
period: 6h
basePeriod: 15m
exchanges: [{"eid":"Futures_Binance","currency":"BTC_USDT"}]
*/

//@version=5
strategy("market slayer v3", overlay=true)

// Input parameters
showConfirmationTrend = input(title='Show Trend', defval=true)
confirmationTrendTimeframe = input.timeframe(title='Main Trend', defval='240')
confirmationTrendValue = input(title='Main Trend Value', defval=2)
showConfirmationBars = input(title='Show Confirmation Bars', defval=true)
topCbarValue = input(title='Top Confirmation Value', defval=60)
short_length = input.int(10, minval=1, title="Short SMA Length")
long_length = input.int(20, minval=1, title="Long SMA Length")
takeProfitEnabled = input(title="Take Profit Enabled", defval=false)
takeProfitValue = input.float(title="Take Profit (points)", defval=20, minval=1)
stopLossEnabled = input(title="Stop Loss Enabled", defval=false)
stopLossValue = input.float(title="Stop Loss (points)", defval=50, minval=1)

// Calculate SMAs
short_sma = ta.sma(close, short_length)
long_sma = ta.sma(close, long_length)

// Generate buy and sell signals based on SMAs
buy_signal = ta.crossover(short_sma, long_sma)
sell_signal = ta.crossunder(short_sma, long_sma)

// Plot SMAs
plot(short_sma, color=color.rgb(24, 170, 11), title="Short SMA")
plot(long_sma, color=color.red, title="Long SMA")

// Confirmation Bars
f_confirmationBarBullish(cbValue) =>
    cBarClose = close
    slowConfirmationBarSmaHigh = ta.sma(high, cbValue)
    slowConfirmationBarSmaLow = ta.sma(low, cbValue)
    slowConfirmationBarHlv = int(na)
    slowConfirmationBarHlv := cBarClose > slowConfirmationBarSmaHigh ? 1 : cBarClose < slowConfirmationBarSmaLow ? -1 : slowConfirmationBarHlv[1]
    slowConfirmationBarSslDown = slowConfirmationBarHlv < 0 ? slowConfirmationBarSmaHigh : slowConfirmationBarSmaLow
    slowConfirmationBarSslUp = slowConfirmationBarHlv < 0 ? slowConfirmationBarSmaLow : slowConfirmationBarSmaHigh
    slowConfirmationBarSslUp > slowConfirmationBarSslDown

fastConfirmationBarBullish = f_confirmationBarBullish(topCbarValue)
fastConfirmationBarBearish = not fastConfirmationBarBullish
fastConfirmationBarClr = fastConfirmationBarBullish ? color.green : color.red

fastConfirmationChangeBullish = fastConfirmationBarBullish and fastConfirmationBarBearish[1]
fastConfirmationChangeBearish = fastConfirmationBarBearish and fastConfirmationBarBullish[1]

confirmationTrendBullish = request.security(syminfo.tickerid, confirmationTrendTimeframe, f_confirmationBarBullish(confirmationTrendValue), lookahead=barmerge.lookahead_on)
confirmationTrendBearish = not confirmationTrendBullish
confirmationTrendClr = confirmationTrendBullish ? color.green : color.red

// Plot trend labels
plotshape(showConfirmationTrend, style=shape.square, location=location.top, color=confirmationTrendClr, title='Trend Confirmation Bars')
plotshape(showConfirmationBars and (fastConfirmationChangeBullish or fastConfirmationChangeBearish), style=shape.triangleup, location=location.top, color=fastConfirmationChangeBullish ? color.green : color.red, title='Fast Confirmation Bars')
plotshape(showConfirmationBars and buy_signal and confirmationTrendBullish, style=shape.triangleup, location=location.top, color=color.green, title='Buy Signal')
plotshape(showConfirmationBars and sell_signal and confirmationTrendBearish, style=shape.triangledown, location=location.top, color=color.red, title='Sell Signal')

// Generate trade signals
buy_condition = buy_signal and confirmationTrendBullish and not (strategy.opentrades > 0)
sell_condition = sell_signal and confirmationTrendBearish and not (strategy.opentrades > 0)

strategy.entry("Buy", strategy.long, when=buy_condition, comment ="BUY CALLS")
strategy.entry("Sell", strategy.short, when=sell_condition, comment ="BUY PUTS")

// Take Profit
if (takeProfitEnabled)
    strategy.exit("Take Profit Buy", from_entry="Buy", profit=takeProfitValue)
    strategy.exit("Take Profit Sell", from_entry="Sell", profit=takeProfitValue)

// Stop Loss
if (stopLossEnabled)
    strategy.exit("Stop Loss Buy", from_entry="Buy", loss=stopLossValue)
    strategy.exit("Stop Loss Sell", from_entry="Sell", loss=stopLossValue)

// Close trades based on trend confirmation bars
if strategy.opentrades > 0
    if strategy.position_size > 0
        if not confirmationTrendBullish
            strategy.close("Buy", comment ="CLOSE CALLS")
    else
        if not confirmationTrendBearish
            strategy.close("Sell", comment ="CLOSE PUTS")

// Define alert conditions as booleans
buy_open_alert = buy_condition
sell_open_alert = sell_condition
buy_closed_alert = strategy.opentrades < 0
sell_closed_alert = strategy.opentrades > 0

// Alerts
alertcondition(buy_open_alert, title='Buy calls', message='Buy calls Opened')
alertcondition(sell_open_alert, title='buy puts', message='buy Puts Opened')
alertcondition(buy_closed_alert, title='exit calls', message='exit calls ')
alertcondition(sell_closed_alert, title='exit puts', message='exit puts Closed')
Detail
https://www.fmz.com/strategy/453233
Last Modified
2024-06-03 10:57:05