
9.2 KiB
Name
多时间尺度动量趋势追踪与风险管理量化交易策略-Multi-Timeframe-Momentum-Trend-Tracking-and-Risk-Management-Quantitative-Trading-Strategy
Author
ianzeng123
Strategy Description
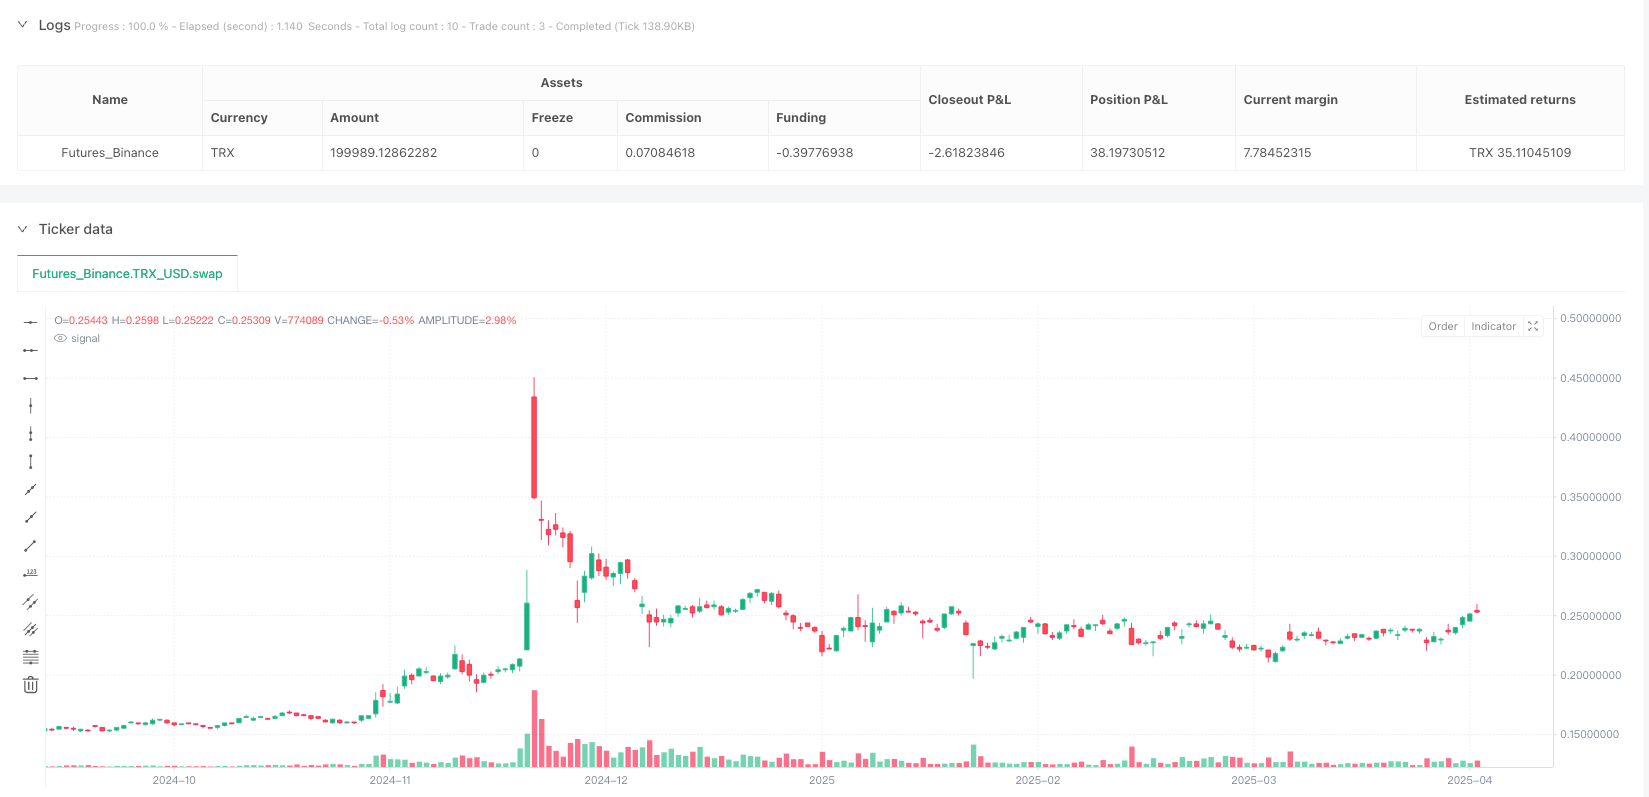
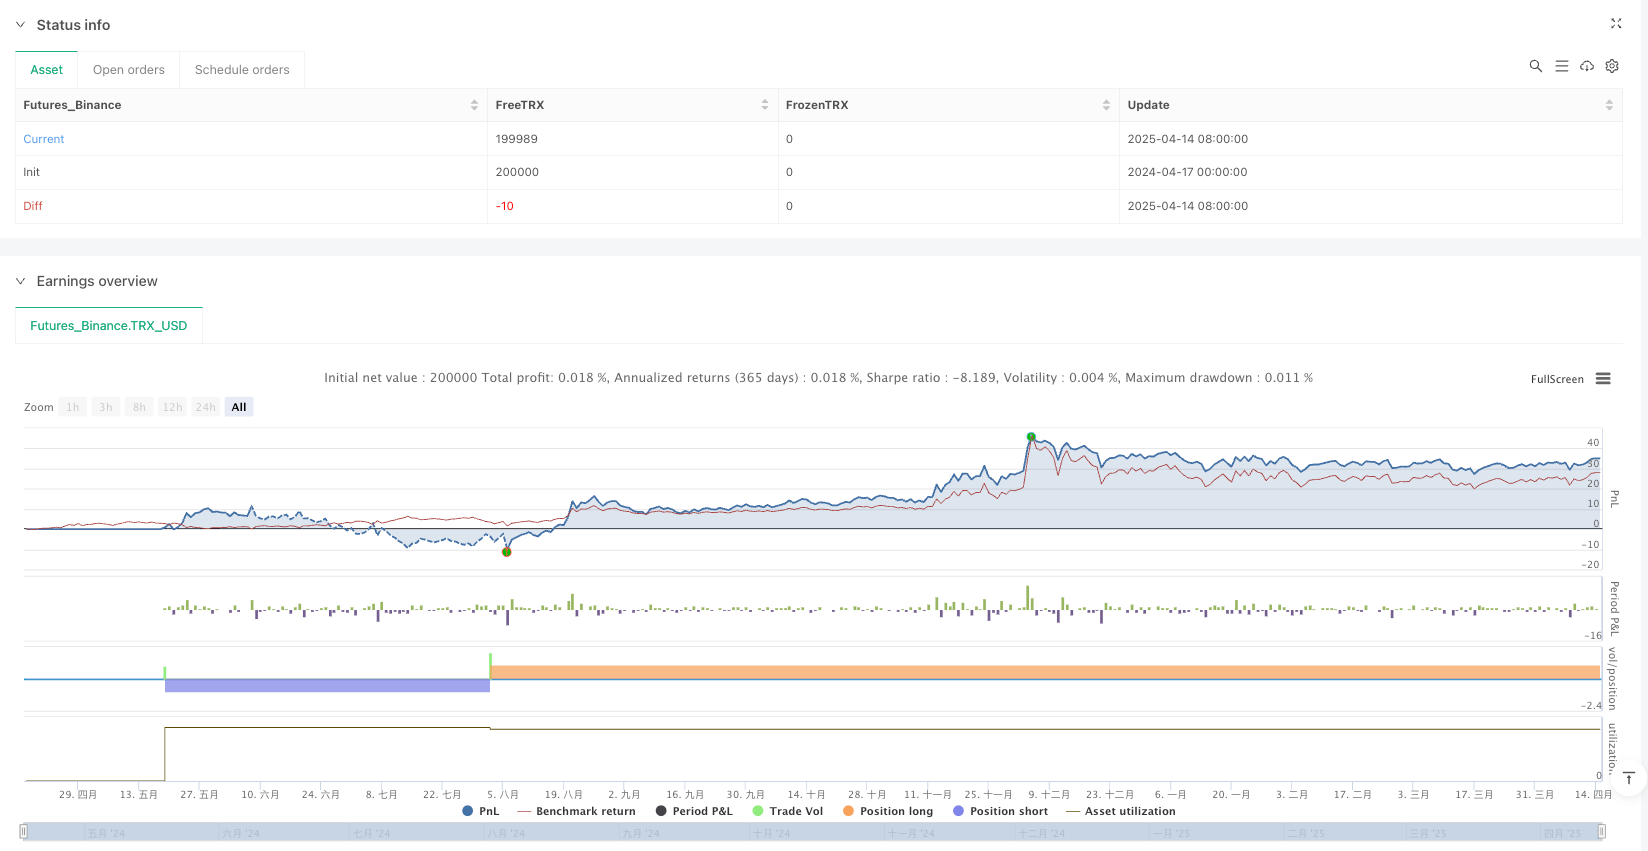
[trans]
概述
这是一种基于多时间尺度技术指标组合的量化交易策略,通过综合分析移动平均线、随机相对强弱指标(SRI)和价格动量,实现精准的市场进入和风险控制。该策略旨在捕捉市场趋势,同时有效管理交易风险,适用于追求稳定收益的量化交易者。
策略原理
策略核心由五个关键技术指标组成:
- 移动平均线指标:
- 5日、10日、50日和100日简单移动平均线(SMA)
- 通过多时间尺度移动平均线的相对位置判断市场趋势方向
- 价格与移动平均线的相对关系确定进入信号
- 随机相对强弱指标(SRI):
- 使用1分钟时间尺度计算SRI
- SRI低于70作为做多信号
- SRI高于30作为做空信号
- 蜡烛线形态:
- 分析开盘价与前一根K线收盘价的关系
- 判断当前价格动量和市场情绪
- 风险管理机制:
- 设置止盈(TP)和止损(SL)点
- 实现盈亏保本(Break-Even, BE)策略
- 动态调整止损位置
策略优势
- 多维度信号验证
- 综合使用移动平均线、SRI和价格动量
- 显著降低错误信号的概率
- 提高交易信号的可靠性
- 灵活的风险控制
- 预设止盈和止损点
- 动态盈亏保本机制
- 有效控制单笔交易最大损失
- 多时间尺度分析
- 结合不同周期移动平均线
- 全面捕捉市场趋势
- 提高策略适应性
- 参数可调节性
- 可自定义止盈、止损点
- 适应不同市场环境和交易品种
策略风险
- 参数敏感性风险
- 移动平均线和SRI参数对策略表现影响显著
- 需要进行充分的回测和参数优化
- 市场剧烈波动风险
- 极端市场条件下策略可能失效
- 建议设置最大回撤限制
- 过度交易风险
- 频繁交易可能增加交易成本
- 需要结合实际交易成本进行调整
- 指标滞后性风险
- 移动平均线存在一定滞后性
- 可能错过趋势early stage信号
策略优化方向
- 引入机器学习算法
- 使用监督学习算法优化参数
- 动态调整止盈止损点
- 提高策略的自适应能力
- 增加附加过滤条件
- 引入成交量指标
- 加入趋势强度指标
- 提高信号的准确性
- 多品种适应性优化
- 开发通用参数自适应机制
- 减少人工干预
- 提高策略的普适性
总结
这是一种基于多时间尺度分析的量化交易策略,通过综合技术指标和先进的风险管理机制,旨在捕捉市场趋势并控制交易风险。策略的核心优势在于信号的多维度验证和灵活的风险控制。未来将通过机器学习和更复杂的技术指标组合进一步提升策略的稳定性和收益率。
||
Overview
This is a quantitative trading strategy based on multi-timeframe technical indicator combinations, achieving precise market entry and risk control through comprehensive analysis of moving averages, Stochastic Relative Strength Index (SRI), and price momentum. The strategy aims to capture market trends while effectively managing trading risks, suitable for quantitative traders seeking stable returns.
Strategy Principles
The strategy's core consists of five key technical indicators:
- Moving Average Indicators:
- 5-day, 10-day, 50-day, and 100-day Simple Moving Averages (SMA)
- Determine market trend direction through relative positions of moving averages
- Confirm entry signals based on price and moving average relationships
- Stochastic Relative Strength Index (SRI):
- Calculated using 1-minute timeframe
- SRI below 70 as long entry signal
- SRI above 30 as short entry signal
- Candlestick Patterns:
- Analyze opening price relative to previous candle's close
- Determine current price momentum and market sentiment
- Risk Management Mechanism:
- Set Take Profit (TP) and Stop Loss (SL) points
- Implement Break-Even (BE) strategy
- Dynamically adjust stop loss positions
Strategy Advantages
- Multi-Dimensional Signal Verification
- Comprehensive use of moving averages, SRI, and price momentum
- Significantly reduce false signal probability
- Improve trading signal reliability
- Flexible Risk Control
- Preset take profit and stop loss points
- Dynamic break-even mechanism
- Effectively control maximum loss per trade
- Multi-Timeframe Analysis
- Combine moving averages of different periods
- Comprehensively capture market trends
- Enhance strategy adaptability
- Parameter Adjustability
- Customizable take profit and stop loss points
- Adapt to different market environments and trading varieties
Strategy Risks
- Parameter Sensitivity Risk
- Moving average and SRI parameters significantly impact strategy performance
- Require comprehensive backtesting and parameter optimization
- Extreme Market Volatility Risk
- Strategy may fail under extreme market conditions
- Recommend setting maximum drawdown limits
- Over-Trading Risk
- Frequent trading may increase transaction costs
- Need adjustment based on actual trading expenses
- Indicator Lagging Risk
- Moving averages have inherent lag
- May miss early-stage trend signals
Strategy Optimization Directions
- Introduce Machine Learning Algorithms
- Use supervised learning to optimize parameters
- Dynamically adjust take profit and stop loss points
- Enhance strategy adaptability
- Add Additional Filtering Conditions
- Introduce volume indicators
- Incorporate trend strength indicators
- Improve signal accuracy
- Multi-Variety Adaptability Optimization
- Develop universal parameter adaptation mechanism
- Reduce manual intervention
- Improve strategy universality
Summary
This is a quantitative trading strategy based on multi-timeframe analysis, aiming to capture market trends and control trading risks through comprehensive technical indicators and advanced risk management mechanisms. The strategy's core advantages lie in multi-dimensional signal verification and flexible risk control. Future improvements will focus on enhancing stability and return rates through machine learning and more complex technical indicator combinations. [/trans]
Source (PineScript)
/*backtest
start: 2024-04-17 00:00:00
end: 2025-04-15 08:00:00
period: 1d
basePeriod: 1d
exchanges: [{"eid":"Futures_Binance","currency":"TRX_USD"}]
*/

//@version=6
strategy("Strategia LONG & SHORT con TP, SL e BE", overlay=true, default_qty_type=strategy.fixed, default_qty_value=1)

// === INPUT === //
tp_points = input.int(60000, "Take Profit (punti)")
sl_points = input.int(25000, "Stop Loss (punti)")
breakeven_trigger = tp_points * 0.5

// === MEDIE MOBILI === //
ma5  = ta.sma(close, 5)
ma10 = ta.sma(close, 10)
ma50 = ta.sma(close, 50)
ma100 = ta.sma(close, 100)

// === SRI da timeframe 1 minuto === //
sri_tf = "1"
sri_length = 10
sri_src = close
sri = request.security(syminfo.tickerid, sri_tf, ta.stoch(sri_src, sri_src, sri_src, sri_length))

// === CONDIZIONI LONG === //
long_candle        = open > close[1]
price_above_ma100  = close > ma100
ma50_above_ma100   = ma50 > ma100
ma5_above_ma10     = ma5 > ma10
sri_below_75       = sri < 70

long_condition = long_candle and price_above_ma100 and ma50_above_ma100 and ma5_above_ma10 and sri_below_75

// === CONDIZIONI SHORT === //
short_candle       = open < close[1]
price_below_ma100  = close < ma100
ma50_below_ma100   = ma50 < ma100
ma5_below_ma10     = ma5 < ma10
sri_above_25       = sri > 30

short_condition = short_candle and price_below_ma100 and ma50_below_ma100 and ma5_below_ma10 and sri_above_25

// === ENTRY LONG === //
if (long_condition)
    strategy.entry("Long", strategy.long)

// === ENTRY SHORT === //
if (short_condition)
    strategy.entry("Short", strategy.short)

// === GESTIONE USCITE === //
var float long_entry_price  = na
var float short_entry_price = na

// LONG: TP/SL + break-even
if (strategy.position_size > 0)
    if (na(long_entry_price))
        long_entry_price := strategy.position_avg_price

    tp_price_long = long_entry_price + tp_points * syminfo.mintick
    sl_price_long = long_entry_price - sl_points * syminfo.mintick
    be_trigger_long = long_entry_price + breakeven_trigger * syminfo.mintick
    sl_be = close >= be_trigger_long ? long_entry_price : sl_price_long

    strategy.exit("Exit Long", from_entry="Long", limit=tp_price_long, stop=sl_be)

// SHORT: TP/SL + break-even
if (strategy.position_size < 0)
    if (na(short_entry_price))
        short_entry_price := strategy.position_avg_price

    tp_price_short = short_entry_price - tp_points * syminfo.mintick
    sl_price_short = short_entry_price + sl_points * syminfo.mintick
    be_trigger_short = short_entry_price - breakeven_trigger * syminfo.mintick
    sl_be_short = close <= be_trigger_short ? short_entry_price : sl_price_short

    strategy.exit("Exit Short", from_entry="Short", limit=tp_price_short, stop=sl_be_short)

// Reset quando flat
if (strategy.position_size == 0)
    long_entry_price := na
    short_entry_price := na
Detail
https://www.fmz.com/strategy/490908
Last Modified
2025-04-17 14:01:16