
19 KiB
Name
多时间周期RSI-SMA动态交叉自适应交易系统-Multi-Timeframe-RSI-SMA-Dynamic-Crossover-Adaptive-Trading-System
Author
ianzeng123
Strategy Description
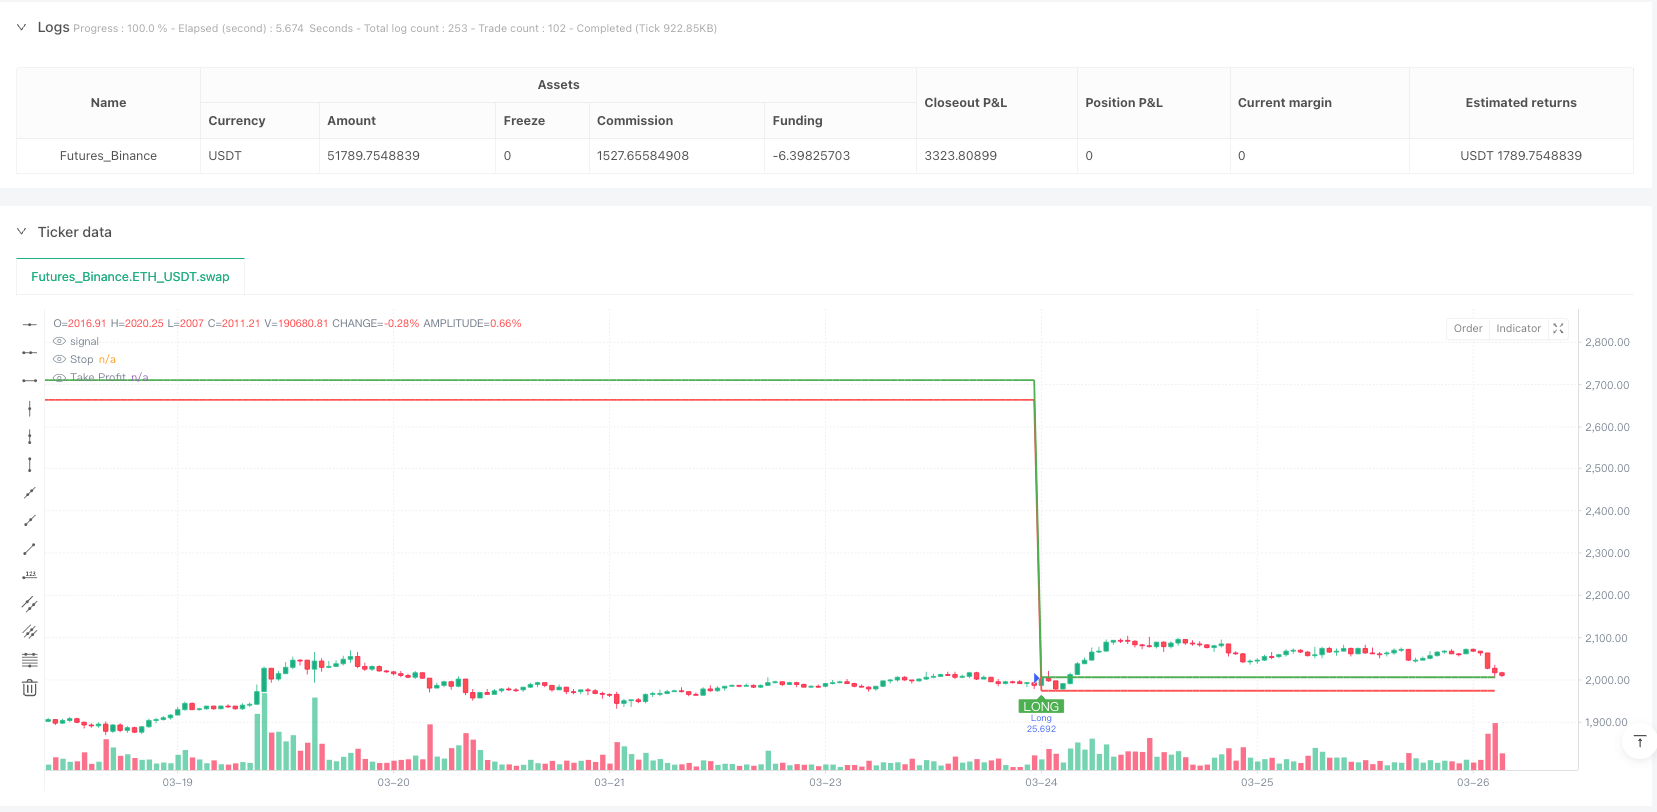
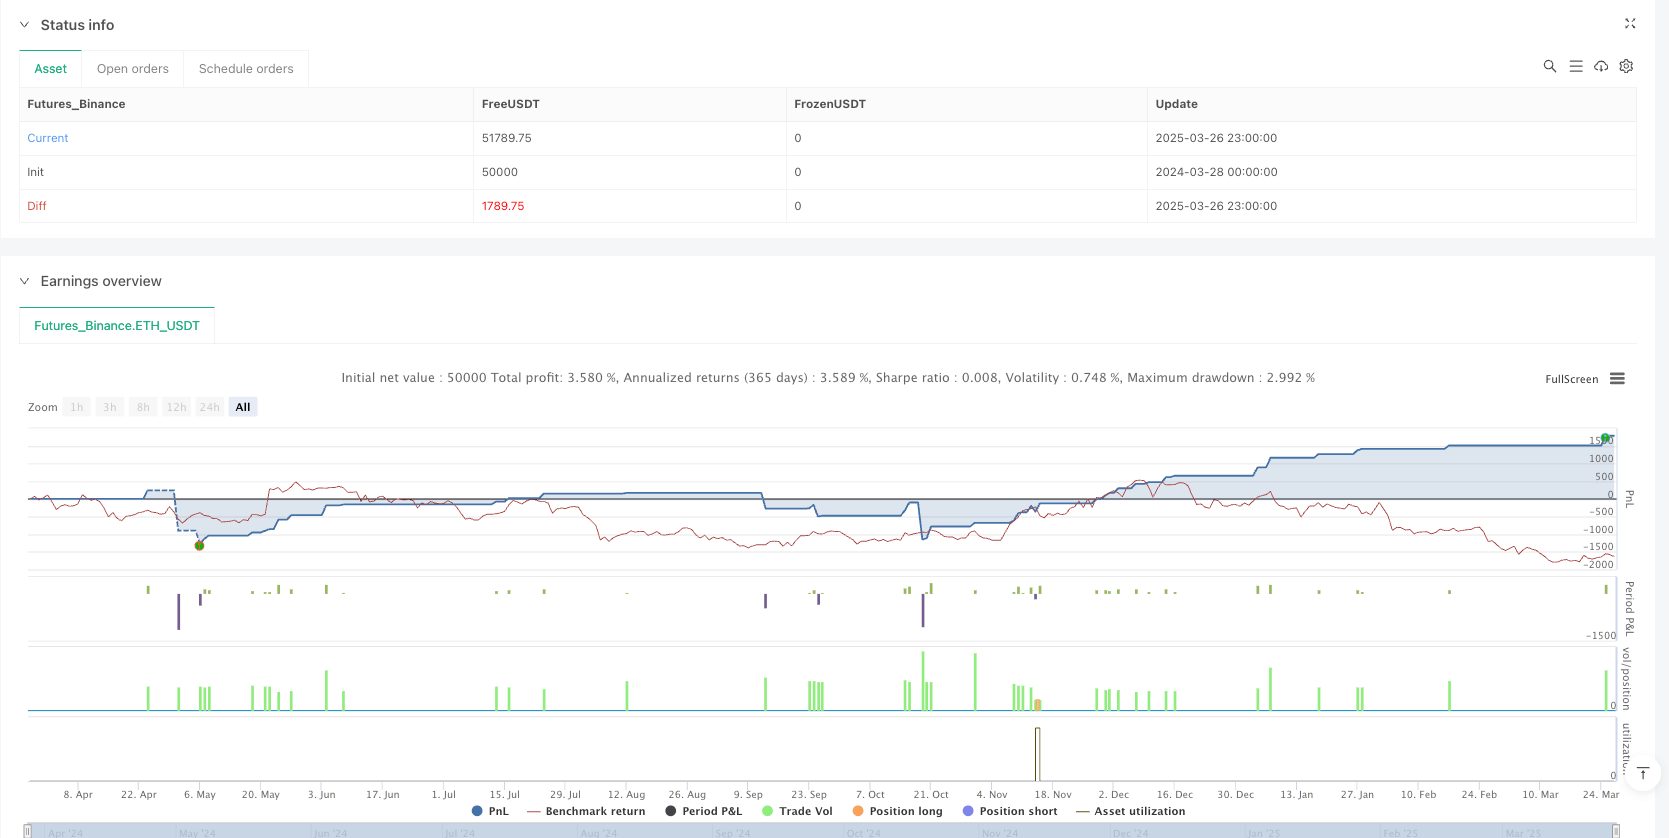
[trans]
概述
多时间周期RSI-SMA动态交叉自适应交易系统是一个结合相对强弱指数(RSI)与简单移动平均线(SMA)交叉信号的高级量化交易策略,该策略的独特之处在于能够根据不同的时间周期(从1分钟到月线)自动调整指标参数、风险水平和过滤条件,实现全时间周期的交易适应性。通过对Pine Script代码的深入分析,可以看出该策略采用了智能参数调整机制,在不同时间框架下自动优化RSI周期、SMA周期、ATR倍数、止盈百分比和成交量要求,从而在短线、中线和长线交易中均能保持一致的性能表现。
策略原理
该策略的核心原理是基于RSI与其SMA均线的交叉信号,结合了多重确认过滤条件和动态风险管理系统。具体运作原理如下:
-
智能参数自适应: 策略通过
timeframe.period函数检测当前图表时间周期,然后使用switch结构为各项指标分配最优参数。例如,RSI周期从1分钟图表的10期扩展到月线图表的28期;SMA周期从20期到200期不等;ATR乘数从1.5倍增加到4.5倍;止盈目标从3%增加到10%。 -
动态指标计算:
- 自适应RSI-SMA: 使用优化后的周期计算RSI值和RSI的SMA均线
- 智能成交量过滤: 根据时间周期调整成交量要求,1分钟图要求成交量为20期平均的2倍,而月线图则仅要求0.5倍
- 趋势确认: 使用快速EMA和慢速EMA的交叉来确认上升趋势,确保顺势而为
-
入场条件:
- RSI上穿其SMA均线
- 成交量大于动态阈值
- 确认上升趋势(快速EMA > 慢速EMA)
- 收盘价大于开盘价(看涨蜡烛)
- 收盘价突破5周期高点
-
退出条件:
- RSI下穿其SMA均线
- 价格跌破5周期低点
-
风险管理:
- 动态止损: 基于ATR的倍数设置(从1.5倍到4.5倍),适应不同时间周期的波动特性
- 动态止盈: 基于入场点设置3%到10%的百分比目标,随时间周期扩大
策略优势
通过深入分析代码结构,该策略展现出以下显著优势:
-
全时间周期适应性: 最突出的优势是策略能在从1分钟到月线的所有时间框架中自适应工作,无需人工干预调整参数。这解决了传统策略在不同时间周期下表现不一致的常见问题。
-
多重过滤机制: 策略不仅依赖RSI-SMA交叉信号,还结合了价格突破、趋势确认、成交量验证等多重过滤条件,显著减少了虚假信号。
-
动态风险管理: 止损和止盈水平会随着时间周期和市场波动性自动调整,更高的时间周期设置更宽松的止损和更大的盈利目标,这符合波动性规律。
-
自动可视化: 代码包含清晰的可视化元素,包括买入标记、止损线和止盈线,帮助交易者直观理解交易逻辑。
-
低代码复杂度: 尽管功能强大,但代码结构清晰,分区明确,逻辑简洁,便于维护和进一步优化。
策略风险
尽管该策略设计精巧,但仍存在以下潜在风险:
-
参数优化过拟合风险: 虽然策略为不同时间周期设定了优化参数,但这些参数可能是基于历史数据优化得出,存在过拟合风险。解决方法是在多个市场周期(牛市、熊市、震荡市)和不同品种上进行回测验证。
-
快速趋势逆转风险: 在高波动市场中,价格可能在触发入场信号后快速逆转,导致止损被触发。建议在极端市场波动期间(如重大财经事件公布前后)暂停策略或增加额外过滤条件。
-
成交量异常风险: 策略依赖成交量作为过滤条件,但某些市场条件下(如流动性干涸)可能出现成交量异常波动,影响信号质量。可以考虑增加相对成交量指标或成交量聚集/发散分析来增强过滤效果。
-
固定百分比止盈限制: 使用固定百分比止盈可能过早退出强劲趋势,错失更大盈利。考虑实施分批获利或结合趋势强度动态调整止盈水平。
-
时间周期切换混淆: 在策略运行期间切换时间周期可能导致参数突变,影响当前持仓的风险管理设置。建议在切换时间周期前关闭所有持仓。
策略优化方向
根据代码分析,可以从以下几个方面优化策略:
-
增加自适应动量指标: 结合RSI-SMA系统引入MACD或OBV等动量指标作为额外确认,特别是在长周期交易中,可以提高信号质量。优化理由是动量指标能更好捕捉趋势的持续性和强度。
-
市场状态分类机制: 引入市场状态(区间震荡/趋势)的自动分类机制,根据波动率和方向性参数自动调整策略偏好。这样可以在区间市场减少交易频率,在趋势市场增加持仓时间。
-
止损动态优化: 当前止损基于固定ATR倍数,可以考虑结合支撑位、阻力位或关键价格水平动态调整止损,提高止损设置的市场相关性。
-
日内时间过滤: 对于短周期(1分钟到1小时)交易,增加日内时间过滤,避开开盘和收盘前30分钟的高波动期间,或专注于特定的高效交易时段。
-
机器学习参数优化: 引入简单的机器学习算法来动态优化RSI和SMA周期,根据最近的市场状态自动调整参数,而不是使用预设的固定参数映射。
-
多指标共振系统: 扩展为多指标共振系统,结合价格行为、成交量分布和市场结构分析,提高信号可靠性和抗干扰能力。
总结
多时间周期RSI-SMA动态交叉自适应交易系统是一个设计精巧的量化交易策略,其最大特点是能够自动适应从1分钟到月线的任何时间周期,无需手动调整参数。策略通过RSI与其SMA均线的交叉作为核心信号,结合多重过滤条件和动态风险管理,实现了全时间周期的交易适应性。
该策略特别适合需要在多个时间周期间灵活切换的交易者,以及希望构建从短线到长线一致性交易系统的量化分析师。通过智能参数调整、动态指标计算和严格的入场条件,策略能够在不同市场环境下保持稳定表现。
虽然存在参数优化过拟合和快速趋势逆转等风险,但通过本文提出的优化方向,如增加自适应动量指标、市场状态分类机制和机器学习参数优化等,可以进一步提升策略的稳健性和盈利能力。在实际应用中,建议在多个市场周期和不同品种上进行充分回测,并结合0.1%交易成本模拟,以验证策略在真实市场环境中的表现。 ||
Overview
The Multi-Timeframe RSI-SMA Dynamic Crossover Adaptive Trading System is an advanced quantitative trading strategy that combines Relative Strength Index (RSI) and Simple Moving Average (SMA) crossover signals. What makes this strategy unique is its ability to automatically adjust indicator parameters, risk levels, and filtering conditions according to different timeframes (from 1-minute to monthly charts), achieving cross-timeframe trading adaptability. Through in-depth analysis of the Pine Script code, it's evident that the strategy employs an intelligent parameter adjustment mechanism that automatically optimizes RSI periods, SMA periods, ATR multipliers, take-profit percentages, and volume requirements across different timeframes, thereby maintaining consistent performance in short-term, medium-term, and long-term trading.
Strategy Principle
The core principle of this strategy is based on the crossover signals between RSI and its SMA line, combined with multiple confirmation filters and a dynamic risk management system. The specific operating principles are as follows:
-
Intelligent Parameter Adaptation: The strategy detects the current chart timeframe using the
timeframe.periodfunction, then assigns optimal parameters for various indicators using a switch structure. For example, the RSI period expands from 10 periods on 1-minute charts to 28 periods on monthly charts; SMA periods range from 20 to 200; ATR multipliers increase from 1.5x to 4.5x; take-profit targets range from 3% to 10%. -
Dynamic Indicator Calculation:
- Adaptive RSI-SMA: Calculates RSI values and RSI SMA lines using optimized periods
- Smart Volume Filtering: Adjusts volume requirements based on timeframe, requiring 2x the 20-period average volume for 1-minute charts, but only 0.5x for monthly charts
- Trend Confirmation: Uses crossovers between fast and slow EMAs to confirm uptrends, ensuring trades follow the trend
-
Entry Conditions:
- RSI crosses above its SMA line
- Volume exceeds the dynamic threshold
- Confirmed uptrend (Fast EMA > Slow EMA)
- Closing price greater than opening price (bullish candle)
- Closing price breaks above the 5-period high
-
Exit Conditions:
- RSI crosses below its SMA line
- Price drops below the 5-period low
-
Risk Management:
- Dynamic Stop-Loss: Based on ATR multipliers (from 1.5x to 4.5x), adapting to the volatility characteristics of different timeframes
- Dynamic Take-Profit: Sets percentage targets from 3% to 10% based on entry point, expanding with the timeframe
Strategy Advantages
Through in-depth analysis of the code structure, this strategy demonstrates the following significant advantages:
-
Full Timeframe Adaptability: The most prominent advantage is the strategy's ability to work adaptively across all timeframes from 1-minute to monthly charts without manual intervention to adjust parameters. This solves the common problem of traditional strategies performing inconsistently across different timeframes.
-
Multiple Filtering Mechanisms: The strategy relies not only on RSI-SMA crossover signals but also combines price breakouts, trend confirmation, volume verification, and other multiple filtering conditions, significantly reducing false signals.
-
Dynamic Risk Management: Stop-loss and take-profit levels automatically adjust with timeframe and market volatility. Higher timeframes set wider stop-losses and larger profit targets, which aligns with volatility patterns.
-
Automatic Visualization: The code includes clear visualization elements, including buy markers, stop-loss lines, and take-profit lines, helping traders intuitively understand the trading logic.
-
Low Code Complexity: Despite being powerful, the code structure is clear, well-organized, and logically concise, making it easy to maintain and further optimize.
Strategy Risks
Despite its sophisticated design, the strategy still has the following potential risks:
-
Parameter Optimization Overfitting Risk: Although the strategy sets optimized parameters for different timeframes, these parameters may be derived from historical data optimization, presenting an overfitting risk. The solution is to backtest and validate across multiple market cycles (bull, bear, ranging markets) and different instruments.
-
Rapid Trend Reversal Risk: In highly volatile markets, prices may quickly reverse after triggering an entry signal, causing stop-losses to be hit. It's advisable to pause the strategy during extreme market volatility periods (such as before and after major economic announcements) or add additional filtering conditions.
-
Volume Anomaly Risk: The strategy relies on volume as a filtering condition, but under certain market conditions (such as liquidity droughts), abnormal volume fluctuations may occur, affecting signal quality. Consider adding relative volume indicators or volume accumulation/distribution analysis to enhance filtering effectiveness.
-
Fixed Percentage Take-Profit Limitations: Using fixed percentage take-profits may exit strong trends too early, missing out on larger profits. Consider implementing scaled profit-taking or dynamically adjusting take-profit levels based on trend strength.
-
Timeframe Switching Confusion: Switching timeframes during strategy operation may cause parameter mutations, affecting risk management settings for current positions. It's recommended to close all positions before switching timeframes.
Strategy Optimization Directions
Based on code analysis, the strategy can be optimized in the following aspects:
-
Add Adaptive Momentum Indicators: Incorporate momentum indicators like MACD or OBV as additional confirmation alongside the RSI-SMA system, especially in long-term trading, to improve signal quality. The rationale for this optimization is that momentum indicators better capture trend continuity and strength.
-
Market State Classification Mechanism: Introduce an automatic classification mechanism for market states (range-bound/trending), automatically adjusting strategy preferences based on volatility and directional parameters. This can reduce trading frequency in range-bound markets and increase holding time in trending markets.
-
Dynamic Stop-Loss Optimization: Current stop-losses are based on fixed ATR multipliers. Consider dynamically adjusting stop-losses by incorporating support levels, resistance levels, or key price levels to increase the market relevance of stop-loss settings.
-
Intraday Time Filtering: For short timeframes (1-minute to 1-hour), add intraday time filtering to avoid high volatility periods 30 minutes before market open and close, or focus on specific high-efficiency trading sessions.
-
Machine Learning Parameter Optimization: Introduce simple machine learning algorithms to dynamically optimize RSI and SMA periods, automatically adjusting parameters based on recent market conditions, rather than using preset fixed parameter mappings.
-
Multi-Indicator Resonance System: Expand to a multi-indicator resonance system, combining price action, volume distribution, and market structure analysis to improve signal reliability and anti-interference capabilities.
Summary
The Multi-Timeframe RSI-SMA Dynamic Crossover Adaptive Trading System is an intricately designed quantitative trading strategy. Its most significant feature is the ability to automatically adapt to any timeframe from 1-minute to monthly charts without manual parameter adjustments. The strategy uses RSI crossing above its SMA line as the core signal, combined with multiple filtering conditions and dynamic risk management, achieving cross-timeframe trading adaptability.
This strategy is particularly suitable for traders who need to flexibly switch between multiple timeframes, as well as quantitative analysts who want to build consistent trading systems from short-term to long-term. Through intelligent parameter adjustment, dynamic indicator calculation, and strict entry conditions, the strategy can maintain stable performance across different market environments.
Although risks such as parameter optimization overfitting and rapid trend reversals exist, through the optimization directions proposed in this article, such as adding adaptive momentum indicators, market state classification mechanisms, and machine learning parameter optimization, the strategy's robustness and profitability can be further enhanced. In practical application, it is recommended to conduct thorough backtesting across multiple market cycles and different instruments, combined with 0.1% transaction cost simulation, to verify the strategy's performance in real market environments.[/trans]
Source (PineScript)
/*backtest
start: 2024-03-28 00:00:00
end: 2025-03-27 00:00:00
period: 1h
basePeriod: 1h
exchanges: [{"eid":"Futures_Binance","currency":"ETH_USDT"}]
*/

//@version=5
strategy("Multi-Timeframe RSI-SMA Strategy [EB]", overlay=true, precision=2, initial_capital=10000, default_qty_type=strategy.percent_of_equity, default_qty_value=100)

//▄▄▄▄▄▄▄▄▄▄▄▄▄▄▄▄▄▄▄▄▄▄▄▄▄▄▄▄▄▄▄▄▄▄▄▄▄▄▄▄▄
//             SMART PARAMETER ADJUSTMENT
//▀▀▀▀▀▀▀▀▀▀▀▀▀▀▀▀▀▀▀▀▀▀▀▀▀▀▀▀▀▀▀▀▀▀▀▀▀▀▀▀▀

// Zaman Dilimi Tespiti
currentTF = timeframe.period

// Parametreler için ayrı switch yapıları
rsiPeriod = switch currentTF
    "1"  => 10
    "5"  => 12
    "15" => 14
    "30" => 16
    "60" => 18
    "240" => 20
    "D"  => 22
    "W"  => 24
    "M"  => 28
    => 14

smaPeriod = switch currentTF
    "1"  => 20
    "5"  => 25
    "15" => 30
    "30" => 40
    "60" => 50
    "240" => 60
    "D"  => 100
    "W"  => 150
    "M"  => 200
    => 50

atrMult = switch currentTF
    "1"  => 1.5
    "5"  => 1.8
    "15" => 2.0
    "30" => 2.2
    "60" => 2.5
    "240" => 3.0
    "D"  => 3.5
    "W"  => 4.0
    "M"  => 4.5
    => 2.0

tpPerc = switch currentTF
    "1"  => 3.0
    "5"  => 3.5
    "15" => 4.0
    "30" => 4.5
    "60" => 5.0
    "240" => 6.0
    "D"  => 7.0
    "W"  => 8.0
    "M"  => 10.0
    => 4.0

volMultiplier = switch currentTF
    "1"  => 2.0
    "5"  => 1.8
    "15" => 1.5
    "30" => 1.3
    "60" => 1.2
    "240" => 1.0
    "D"  => 0.8
    "W"  => 0.6
    "M"  => 0.5
    => 1.0

//▄▄▄▄▄▄▄▄▄▄▄▄▄▄▄▄▄▄▄▄▄▄▄▄▄▄▄▄▄▄▄▄▄▄▄▄▄▄▄▄▄
//             DYNAMIC INDICATORS
//▀▀▀▀▀▀▀▀▀▀▀▀▀▀▀▀▀▀▀▀▀▀▀▀▀▀▀▀▀▀▀▀▀▀▀▀▀▀▀▀▀

// Akıllı Hacim Filtresi
avgVol = ta.sma(volume, 20)
minVol = avgVol * volMultiplier

// Adaptif RSI-SMA
rsi = ta.rsi(close, rsiPeriod)
rsiSMA = ta.sma(rsi, smaPeriod)

// Volatilite Analizi
atr = ta.atr(14)
dynamicATR = atr * atrMult

// Trend Filtresi
emaFast = ta.ema(close, int(smaPeriod * 0.7))
emaSlow = ta.ema(close, smaPeriod * 2)
trendUp = emaFast > emaSlow

//▄▄▄▄▄▄▄▄▄▄▄▄▄▄▄▄▄▄▄▄▄▄▄▄▄▄▄▄▄▄▄▄▄▄▄▄▄▄▄▄▄
//             TRADE LOGIC
//▀▀▀▀▀▀▀▀▀▀▀▀▀▀▀▀▀▀▀▀▀▀▀▀▀▀▀▀▀▀▀▀▀▀▀▀▀▀▀▀▀

entryCondition =
  ta.crossover(rsi, rsiSMA) and
  volume > minVol and
  trendUp and
  close > open and
  close > ta.highest(high, 5)[1]

exitCondition =
  ta.crossunder(rsi, rsiSMA) or
  close < ta.lowest(low, 5)[1]

//▄▄▄▄▄▄▄▄▄▄▄▄▄▄▄▄▄▄▄▄▄▄▄▄▄▄▄▄▄▄▄▄▄▄▄▄▄▄▄▄▄
//             RISK MANAGEMENT
//▀▀▀▀▀▀▀▀▀▀▀▀▀▀▀▀▀▀▀▀▀▀▀▀▀▀▀▀▀▀▀▀▀▀▀▀▀▀▀▀▀

var float entryPrice = na
var float stopLoss = na
var float takeProfit = na

if entryCondition
    entryPrice := close
    stopLoss := close - dynamicATR
    takeProfit := close + (dynamicATR * (tpPerc / 100))
    strategy.entry("Long", strategy.long)
    strategy.exit("Exit", "Long", stop=stopLoss, limit=takeProfit)

if exitCondition
    strategy.close("Long")

//▄▄▄▄▄▄▄▄▄▄▄▄▄▄▄▄▄▄▄▄▄▄▄▄▄▄▄▄▄▄▄▄▄▄▄▄▄▄▄▄▄
//             VISUALIZATION
//▀▀▀▀▀▀▀▀▀▀▀▀▀▀▀▀▀▀▀▀▀▀▀▀▀▀▀▀▀▀▀▀▀▀▀▀▀▀▀▀▀

plotshape(entryCondition, "Buy", shape.labelup, location.belowbar, color.green, 0, "LONG", textcolor=color.white)
plot(stopLoss, "Stop", color.red, 2, plot.style_linebr)
plot(takeProfit, "Take Profit", color.green, 2, plot.style_linebr)
Detail
https://www.fmz.com/strategy/488502
Last Modified
2025-03-28 11:36:12