
20 KiB
Name
多时段流动性扫荡趋势确认量化交易策略-Multi-Timeframe-Liquidity-Sweep-Trend-Confirmation-Quantitative-Trading-Strategy
Author
ianzeng123
Strategy Description
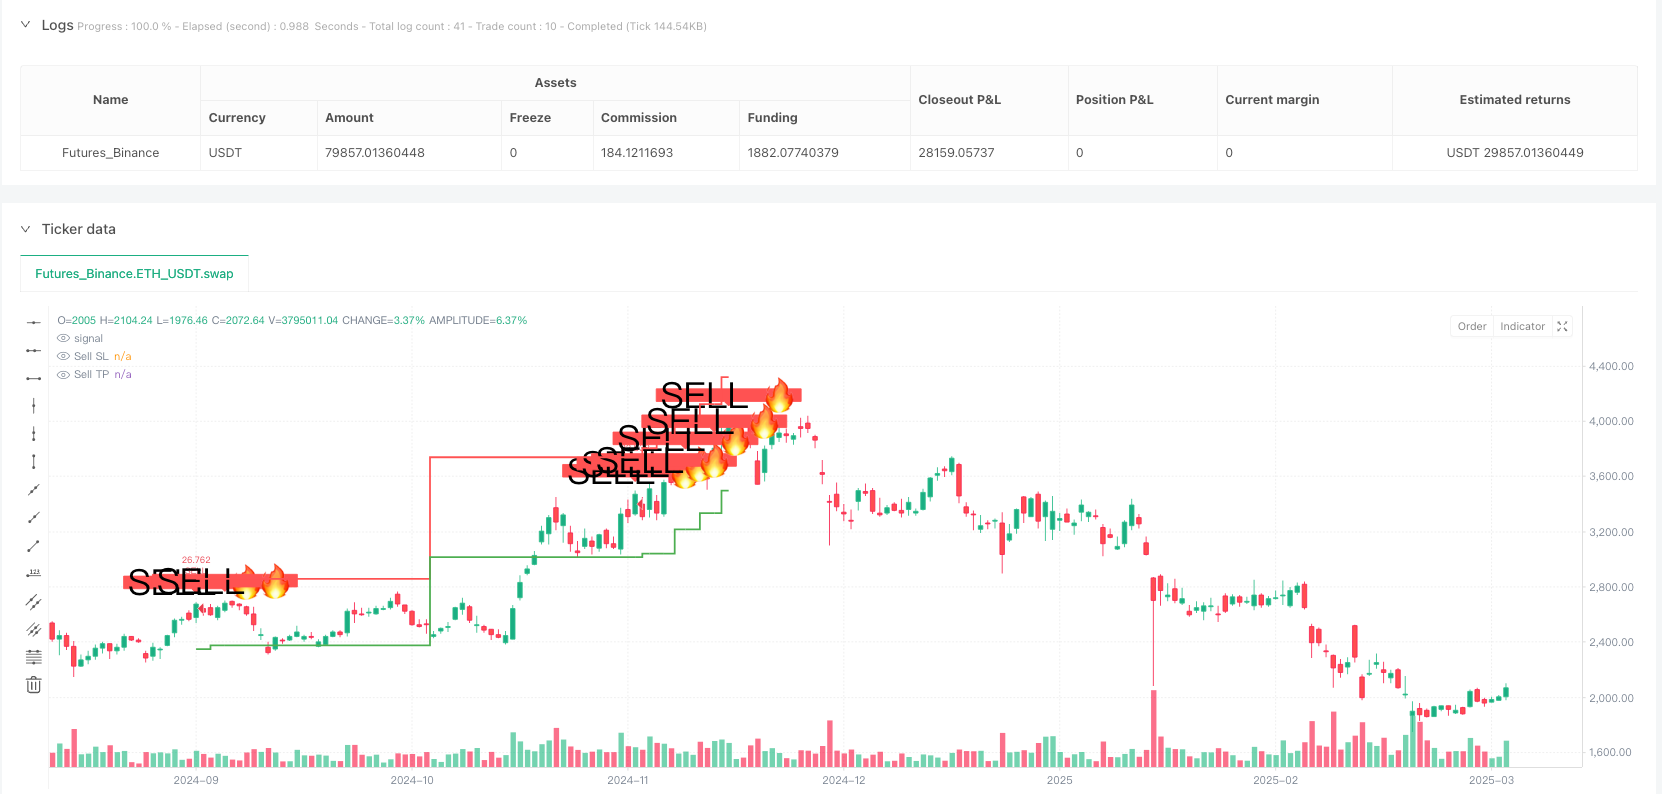
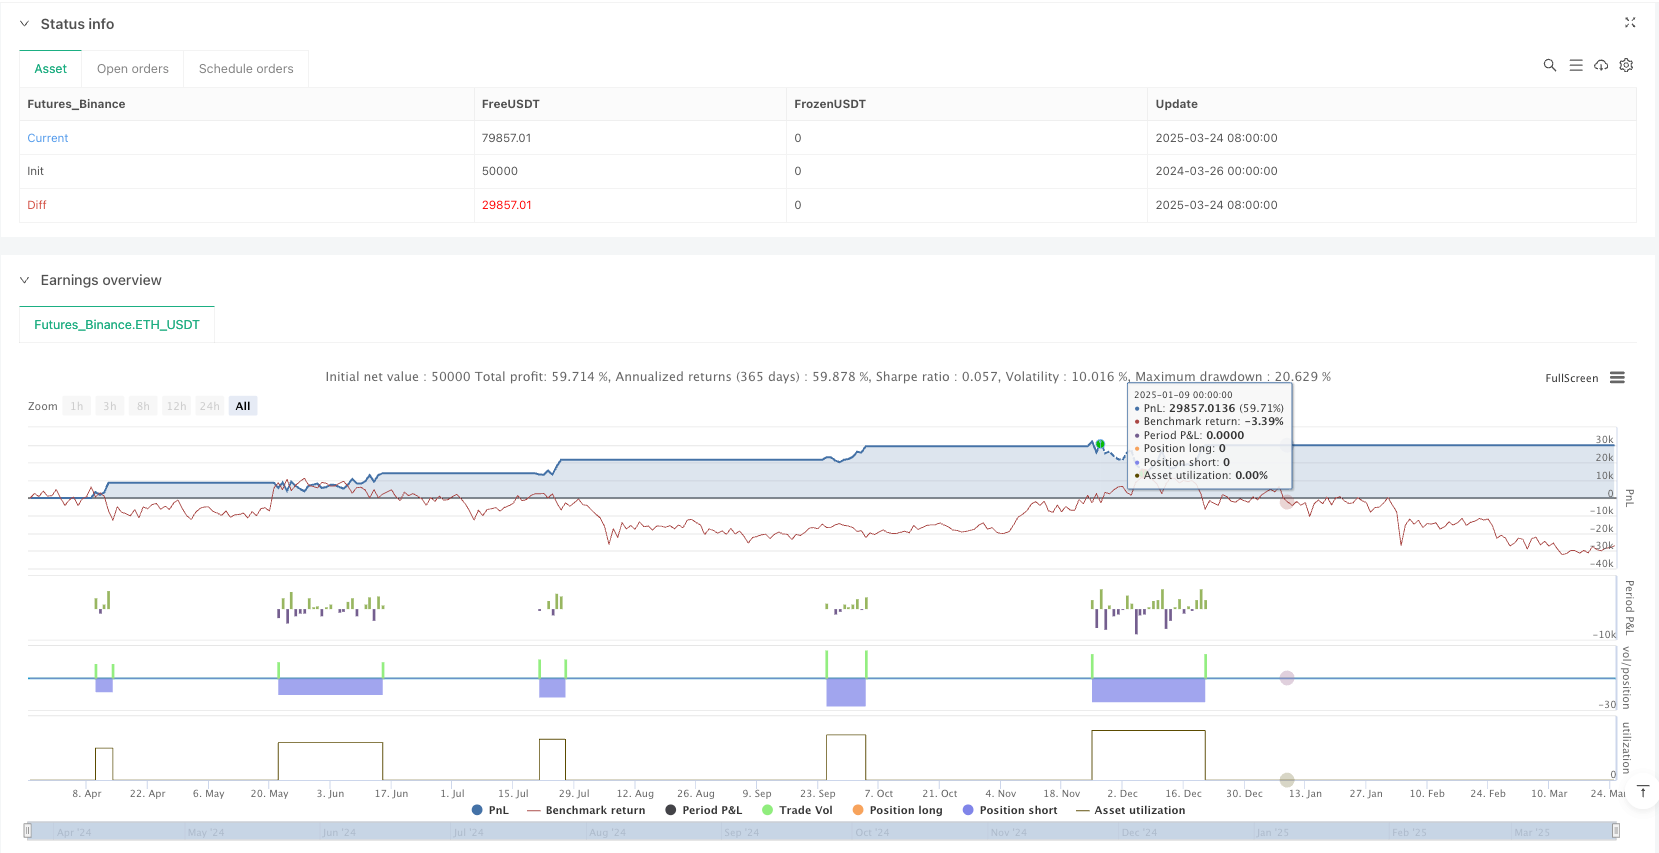
[trans]
概述
多时段流动性扫荡趋势确认量化交易策略是一种结合高时间框架趋势分析与流动性扫荡信号的量化交易方法。该策略主要通过识别市场中的流动性扫荡行为(价格突破近期高点或低点)并结合高时间框架的趋势偏向性来确认交易信号。该策略特别优化用于5分钟图表的短线交易,并使用ATR(平均真实波幅)动态设置止损和止盈水平,从而提高交易胜率和风险回报比。策略通过精确定位市场结构变化点位,在趋势方向上进行高概率交易,实现稳定的盈利能力。
策略原理
该策略的核心原理基于市场流动性与多时段趋势分析的结合。具体来说:
-
流动性扫荡检测:策略通过对比当前价格与过去20个周期的最高/最低价,识别流动性扫荡事件。当价格突破过去20个周期的最高价时,视为高点流动性扫荡;当价格跌破过去20个周期的最低价时,视为低点流动性扫荡。这些突破通常代表市场结构的潜在转折点。
-
高时间框架趋势确认:策略使用4小时时间框架作为趋势过滤器。通过比较高时间框架的高点与过去10个周期的最低点,确定整体市场趋势方向。这一步骤确保交易方向与更大的市场趋势保持一致。
-
交易信号生成:买入信号在两个条件同时满足时触发:发生低点流动性扫荡且高时间框架趋势向上;卖出信号在两个条件同时满足时触发:发生高点流动性扫荡且高时间框架趋势向下。
-
动态风险管理:策略利用ATR(14周期)动态计算止损和止盈水平。止损设置为ATR乘以止损乘数,止盈设置为ATR乘以止盈乘数,从而根据市场波动性自动调整风险参数。
这种方法的理论基础在于,流动性扫荡后常常会出现价格反转,而高时间框架趋势确认则提高了交易信号的可靠性,有效过滤了低质量的交易信号。
策略优势
通过深入分析该策略的代码实现,可以总结出以下几点显著优势:
-
高胜率交易机会:结合流动性扫荡与高时间框架趋势过滤,策略能够识别出高概率的交易机会,显著提高交易胜率。
-
自适应风险管理:使用ATR动态调整止损和止盈水平,使风险管理能够适应不同市场环境下的波动性变化,避免了固定点位止损止盈的局限性。
-
清晰的视觉信号:策略在图表上直观显示买卖信号及相应的止损和止盈水平,使交易者能够清晰把握每笔交易的风险回报比。
-
多时段分析框架:通过整合不同时间框架的市场信息,策略能够更全面地把握市场动态,减少假信号。
-
自动化执行:策略完全可以在交易平台上自动执行,减少人为干预和情绪因素影响,提高交易纪律性。
-
灵活的参数调整:用户可以根据个人风险偏好和交易品种特性调整止损乘数和止盈乘数,实现策略的个性化定制。
-
实时提醒功能:内置的提醒功能可以及时通知交易者潜在的交易机会,便于快速响应市场变化。
策略风险
尽管该策略具有多项优势,但通过代码分析也发现了以下潜在风险点:
-
假突破风险:市场可能出现虚假的流动性扫荡,特别是在波动性较大的市场环境下,可能导致错误信号。解决方法:可以考虑增加确认指标,如成交量确认或价格回踩确认。
-
趋势反转风险:高时间框架趋势判断可能存在滞后性,当市场趋势发生突然反转时,可能导致策略产生不合时宜的信号。解决方法:引入更灵敏的趋势检测方法或多重趋势确认机制。
-
参数敏感性:止损和止盈乘数的设置对策略表现有显著影响,不同市场环境可能需要不同的参数设置。解决方法:进行针对性的参数优化测试,或引入自适应参数调整机制。
-
过度交易风险:在波动性较高的市场中,可能产生过多的流动性扫荡信号,导致过度交易。解决方法:增加信号过滤条件,或设置交易冷却期。
-
ATR计算期间影响:当前使用14周期ATR可能在某些市场条件下反应不够灵敏。解决方法:测试不同ATR周期设置,或使用多周期ATR组合。
-
单一市场依赖性:策略性能可能在不同市场环境(趋势市、震荡市)中表现不一。解决方法:增加市场环境识别逻辑,针对不同市场状态调整策略参数或交易逻辑。
策略优化方向
基于代码分析,该策略可在以下几个方向进行优化:
-
流动性扫荡确认机制:当前策略仅使用价格突破作为流动性扫荡判断依据,可以考虑增加成交量突破确认或价格行为模式确认,以减少假突破信号。这样优化可以提高信号质量,因为真正有效的市场结构突破通常伴随着显著的成交量变化。
-
多层次趋势过滤:可以引入更多时间框架的趋势判断(如日线、周线趋势),构建更全面的趋势确认体系。多时间框架分析可以提供更全面的市场视角,减少信号之间的矛盾。
-
动态止盈策略:可以实现动态跟踪止盈,如基于ATR或价格波动设置移动止盈点,以最大化盈利潜力。这种优化允许在强势行情中获取更多利润,而不是在固定点位提前出场。
-
市场环境适应性:增加市场环境识别功能,在不同市场状态下动态调整策略参数或交易逻辑。市场状态(趋势型、震荡型)对策略表现有重大影响,针对性调整可以显著提升策略稳定性。
-
信号质量评分系统:开发信号质量评分机制,基于多种因素(如趋势强度、突破幅度、成交量确认等)为每个信号评分,只执行高质量信号。这种方法可以进一步提高策略的胜率。
-
资金管理优化:引入更复杂的资金管理逻辑,如基于波动率调整仓位大小,或根据信号质量评分调整交易规模。精细的资金管理是长期盈利的关键因素。
-
机器学习增强:考虑使用机器学习算法优化参数选择或信号过滤,以适应不同市场环境。机器学习可以从历史数据中识别出人类难以发现的模式,提升策略适应性。
总结
多时段流动性扫荡趋势确认量化交易策略通过结合流动性扫荡信号与高时间框架趋势分析,为交易者提供了一种高胜率的交易方法。该策略特别适合5分钟图表的短线交易,并通过ATR动态调整风险参数,实现了灵活的风险管理。
策略的核心优势在于其多时段分析框架和精确的流动性扫荡识别能力,能够在市场结构变化的关键点位捕捉高概率交易机会。同时,清晰的视觉信号展示和自动化执行能力,使交易者能够以纪律性的方式管理交易过程。
虽然策略存在一些潜在风险,如假突破和参数敏感性,但通过建议的优化方向,如增强流动性扫荡确认机制、多层次趋势过滤和动态止盈策略等,可以进一步提升策略的稳定性和盈利能力。
总体而言,这是一个基于扎实市场原理设计的量化交易策略,具有良好的理论基础和实用价值。通过持续优化和针对性调整,该策略可以成为交易者工具箱中的有力武器,帮助实现一致性的交易表现。 ||
Overview
The Multi-Timeframe Liquidity Sweep Trend Confirmation Quantitative Trading Strategy is a quantitative trading approach that combines high timeframe trend analysis with liquidity sweep signals. This strategy primarily identifies trading opportunities by detecting liquidity sweeps (price breaking above recent highs or below recent lows) and confirming them with high timeframe trend bias. The strategy is specifically optimized for short-term trading on 5-minute charts and uses ATR (Average True Range) to dynamically set stop-loss and take-profit levels, thereby improving win rates and risk-reward ratios. By precisely targeting market structure change points, the strategy executes high-probability trades in the direction of the trend, achieving consistent profitability.
Strategy Principles
The core principles of this strategy are based on the combination of market liquidity and multi-timeframe trend analysis. Specifically:
-
Liquidity Sweep Detection: The strategy identifies liquidity sweep events by comparing current prices with the highest/lowest prices over the past 20 periods. When price breaks above the highest level of the past 20 periods, it's considered a high liquidity sweep; when price breaks below the lowest level of the past 20 periods, it's considered a low liquidity sweep. These breakouts typically represent potential turning points in market structure.
-
High Timeframe Trend Confirmation: The strategy uses a 4-hour timeframe as a trend filter. By comparing the high timeframe's high point with the lowest point of the past 10 periods, it determines the overall market trend direction. This step ensures that the trading direction aligns with the larger market trend.
-
Trade Signal Generation: Buy signals are triggered when two conditions are simultaneously met: a low liquidity sweep occurs and the high timeframe trend is upward; sell signals are triggered when two conditions are simultaneously met: a high liquidity sweep occurs and the high timeframe trend is downward.
-
Dynamic Risk Management: The strategy uses ATR (14 periods) to dynamically calculate stop-loss and take-profit levels. Stop-loss is set at ATR multiplied by the stop-loss multiplier, while take-profit is set at ATR multiplied by the take-profit multiplier, automatically adjusting risk parameters based on market volatility.
The theoretical basis of this approach is that price often reverses after liquidity sweeps, and high timeframe trend confirmation enhances the reliability of trading signals, effectively filtering out low-quality trade setups.
Strategy Advantages
Through in-depth analysis of the strategy's code implementation, the following significant advantages can be summarized:
-
High Win-Rate Trading Opportunities: By combining liquidity sweeps with high timeframe trend filtering, the strategy can identify high-probability trading opportunities, significantly improving win rates.
-
Adaptive Risk Management: Using ATR to dynamically adjust stop-loss and take-profit levels enables risk management to adapt to volatility changes in different market environments, avoiding the limitations of fixed-level stops and targets.
-
Clear Visual Signals: The strategy displays buy and sell signals and corresponding stop-loss and take-profit levels intuitively on the chart, allowing traders to clearly grasp the risk-reward ratio of each trade.
-
Multi-Timeframe Analysis Framework: By integrating market information from different timeframes, the strategy can comprehensively grasp market dynamics and reduce false signals.
-
Automated Execution: The strategy can be fully automated on trading platforms, reducing human intervention and emotional factors, and improving trading discipline.
-
Flexible Parameter Adjustment: Users can adjust stop-loss and take-profit multipliers according to personal risk preferences and instrument characteristics, achieving strategy customization.
-
Real-Time Alert Function: The built-in alert function can promptly notify traders of potential trading opportunities, facilitating quick responses to market changes.
Strategy Risks
Despite its multiple advantages, the following potential risk points were identified through code analysis:
-
False Breakout Risk: The market may exhibit false liquidity sweeps, especially in highly volatile market environments, potentially leading to erroneous signals. Solution: Consider adding confirmation indicators, such as volume confirmation or price pullback confirmation.
-
Trend Reversal Risk: High timeframe trend determination may have latency; when market trends suddenly reverse, the strategy may generate untimely signals. Solution: Introduce more sensitive trend detection methods or multiple trend confirmation mechanisms.
-
Parameter Sensitivity: The settings of stop-loss and take-profit multipliers significantly impact strategy performance, and different market environments may require different parameter settings. Solution: Conduct targeted parameter optimization tests or introduce adaptive parameter adjustment mechanisms.
-
Overtrading Risk: In highly volatile markets, too many liquidity sweep signals may lead to overtrading. Solution: Add signal filtering conditions or set trading cooldown periods.
-
ATR Calculation Period Impact: The current 14-period ATR may not be responsive enough under certain market conditions. Solution: Test different ATR period settings or use multiple-period ATR combinations.
-
Single Market Dependency: Strategy performance may vary in different market environments (trending markets, ranging markets). Solution: Add market environment recognition logic and adjust strategy parameters or trading logic for different market states.
Strategy Optimization Directions
Based on code analysis, the strategy can be optimized in the following directions:
-
Liquidity Sweep Confirmation Mechanism: The current strategy only uses price breakouts as the basis for liquidity sweep determination. Consider adding volume breakout confirmation or price action pattern confirmation to reduce false breakout signals. This optimization can improve signal quality because effective market structure breakouts are usually accompanied by significant volume changes.
-
Multi-Level Trend Filtering: Introduce trend determination from more timeframes (such as daily, weekly trends) to build a more comprehensive trend confirmation system. Multi-timeframe analysis can provide a more comprehensive market perspective and reduce contradictions between signals.
-
Dynamic Take-Profit Strategy: Implement dynamic trailing take-profit, such as setting moving take-profit points based on ATR or price fluctuations, to maximize profit potential. This optimization allows for capturing more profit in strong market movements rather than exiting at fixed levels prematurely.
-
Market Environment Adaptability: Add market environment recognition functionality to dynamically adjust strategy parameters or trading logic in different market states. Market conditions (trending, ranging) significantly impact strategy performance; targeted adjustments can substantially enhance strategy stability.
-
Signal Quality Scoring System: Develop a signal quality scoring mechanism to rate each signal based on multiple factors (such as trend strength, breakout magnitude, volume confirmation), and only execute high-quality signals. This approach can further improve the strategy's win rate.
-
Capital Management Optimization: Introduce more sophisticated capital management logic, such as adjusting position size based on volatility or adjusting trade size based on signal quality scores. Refined capital management is a key factor for long-term profitability.
-
Machine Learning Enhancement: Consider using machine learning algorithms to optimize parameter selection or signal filtering to adapt to different market environments. Machine learning can identify patterns from historical data that are difficult for humans to discover, enhancing strategy adaptability.
Summary
The Multi-Timeframe Liquidity Sweep Trend Confirmation Quantitative Trading Strategy provides traders with a high win-rate trading method by combining liquidity sweep signals with high timeframe trend analysis. The strategy is particularly suitable for short-term trading on 5-minute charts and achieves flexible risk management through ATR dynamic adjustment of risk parameters.
The core advantages of the strategy lie in its multi-timeframe analysis framework and precise liquidity sweep identification capability, which can capture high-probability trading opportunities at key points of market structure changes. At the same time, clear visual signal display and automated execution capabilities enable traders to manage the trading process in a disciplined manner.
Although the strategy has some potential risks, such as false breakouts and parameter sensitivity, through the suggested optimization directions, such as enhanced liquidity sweep confirmation mechanisms, multi-level trend filtering, and dynamic take-profit strategies, the stability and profitability of the strategy can be further improved.
Overall, this is a quantitative trading strategy designed on solid market principles, with a sound theoretical foundation and practical value. Through continuous optimization and targeted adjustments, this strategy can become a powerful tool in a trader's toolkit, helping to achieve consistent trading performance. [/trans]
Source (PineScript)
/*backtest
start: 2024-03-26 00:00:00
end: 2025-03-25 00:00:00
period: 1d
basePeriod: 1d
exchanges: [{"eid":"Futures_Binance","currency":"ETH_USDT"}]
*/

//@version=5
strategy("High-Win-Rate Liquidity AI", overlay=true, shorttitle="Liquidity AI", default_qty_type=strategy.percent_of_equity, default_qty_value=100)

// === SETTINGS ===
high_tf = input.timeframe("240", "High Timeframe Bias") // ✅ Fixed timeframe issue
sl_factor = input.float(1.5, "Stop Loss Multiplier", step=0.1)
tp_factor = input.float(3.0, "Take Profit Multiplier", step=0.1)
alerts_on = input(true, "Enable Alerts")

// === HIGH TIMEFRAME BIAS ===
high_tf_high = request.security(syminfo.tickerid, high_tf, high)
high_tf_low = request.security(syminfo.tickerid, high_tf, low)
high_tf_trend = high_tf_high > ta.highest(high_tf_low, 10) ? 1 : -1

// === ENTRY CONDITIONS ===
liq_sweep_high = high > ta.highest(high, 20)[1]
liq_sweep_low = low < ta.lowest(low, 20)[1]

buy_signal = liq_sweep_low and high_tf_trend == 1
sell_signal = liq_sweep_high and high_tf_trend == -1

// === STOP LOSS & TAKE PROFIT ===
long_sl = low - (ta.atr(14) * sl_factor) // SL for Buy
long_tp = low + (ta.atr(14) * tp_factor) // TP for Buy
short_sl = high + (ta.atr(14) * sl_factor) // SL for Sell
short_tp = high - (ta.atr(14) * tp_factor) // TP for Sell

// === PLOT SIGNALS ===
plotshape(buy_signal, style=shape.labelup, color=color.green, location=location.belowbar, size=size.large, text="BUY ?")
plotshape(sell_signal, style=shape.labeldown, color=color.red, location=location.abovebar, size=size.large, text="SELL ?")

// Plot SL & TP
plot(buy_signal ? long_sl : na, style=plot.style_stepline, color=color.red, linewidth=2, title="Buy SL")
plot(buy_signal ? long_tp : na, style=plot.style_stepline, color=color.green, linewidth=2, title="Buy TP")
plot(sell_signal ? short_sl : na, style=plot.style_stepline, color=color.red, linewidth=2, title="Sell SL")
plot(sell_signal ? short_tp : na, style=plot.style_stepline, color=color.green, linewidth=2, title="Sell TP")

// === EXECUTE STRATEGY TRADES ===
if buy_signal
    strategy.entry("BUY", strategy.long)
    strategy.exit("Take Profit", from_entry="BUY", limit=long_tp, stop=long_sl)

if sell_signal
    strategy.entry("SELL", strategy.short)
    strategy.exit("Take Profit", from_entry="SELL", limit=short_tp, stop=short_sl)

// === ALERTS ===
if alerts_on and buy_signal
    alert("BUY Signal on " + syminfo.ticker + " | TP: " + str.tostring(long_tp) + " | SL: " + str.tostring(long_sl))

if alerts_on and sell_signal
    alert("SELL Signal on " + syminfo.ticker + " | TP: " + str.tostring(short_tp) + " | SL: " + str.tostring(short_sl))
Detail
https://www.fmz.com/strategy/488279
Last Modified
2025-03-26 15:18:48