
20 KiB
Name
多时段指数移动平均线交叉策略与趋势确认系统-Multi-Timeframe-Exponential-Moving-Average-Crossover-Strategy-with-Trend-Confirmation-System
Author
ianzeng123
Strategy Description
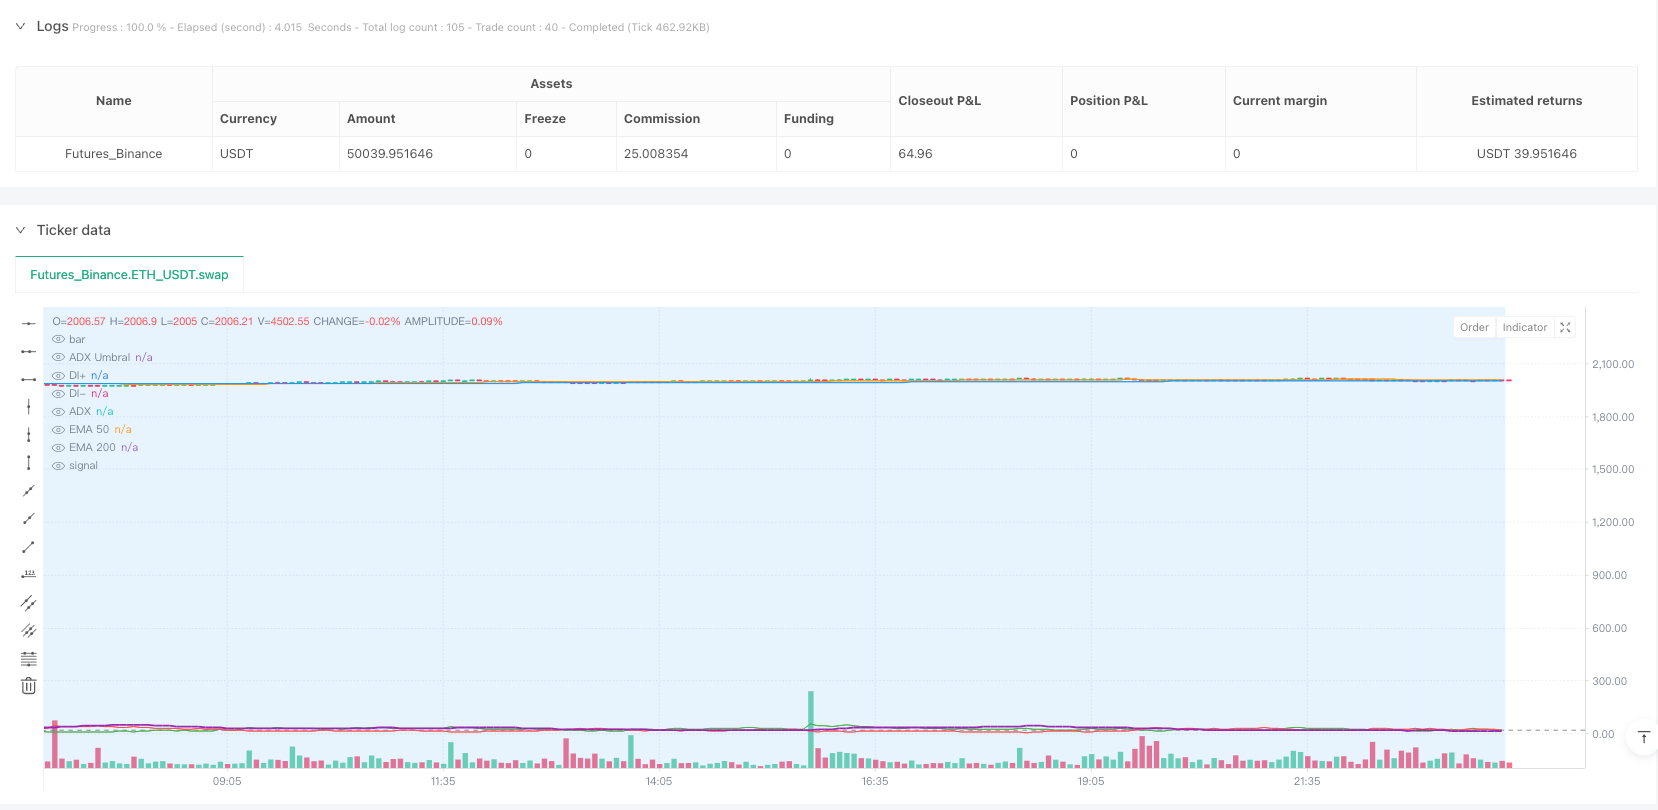
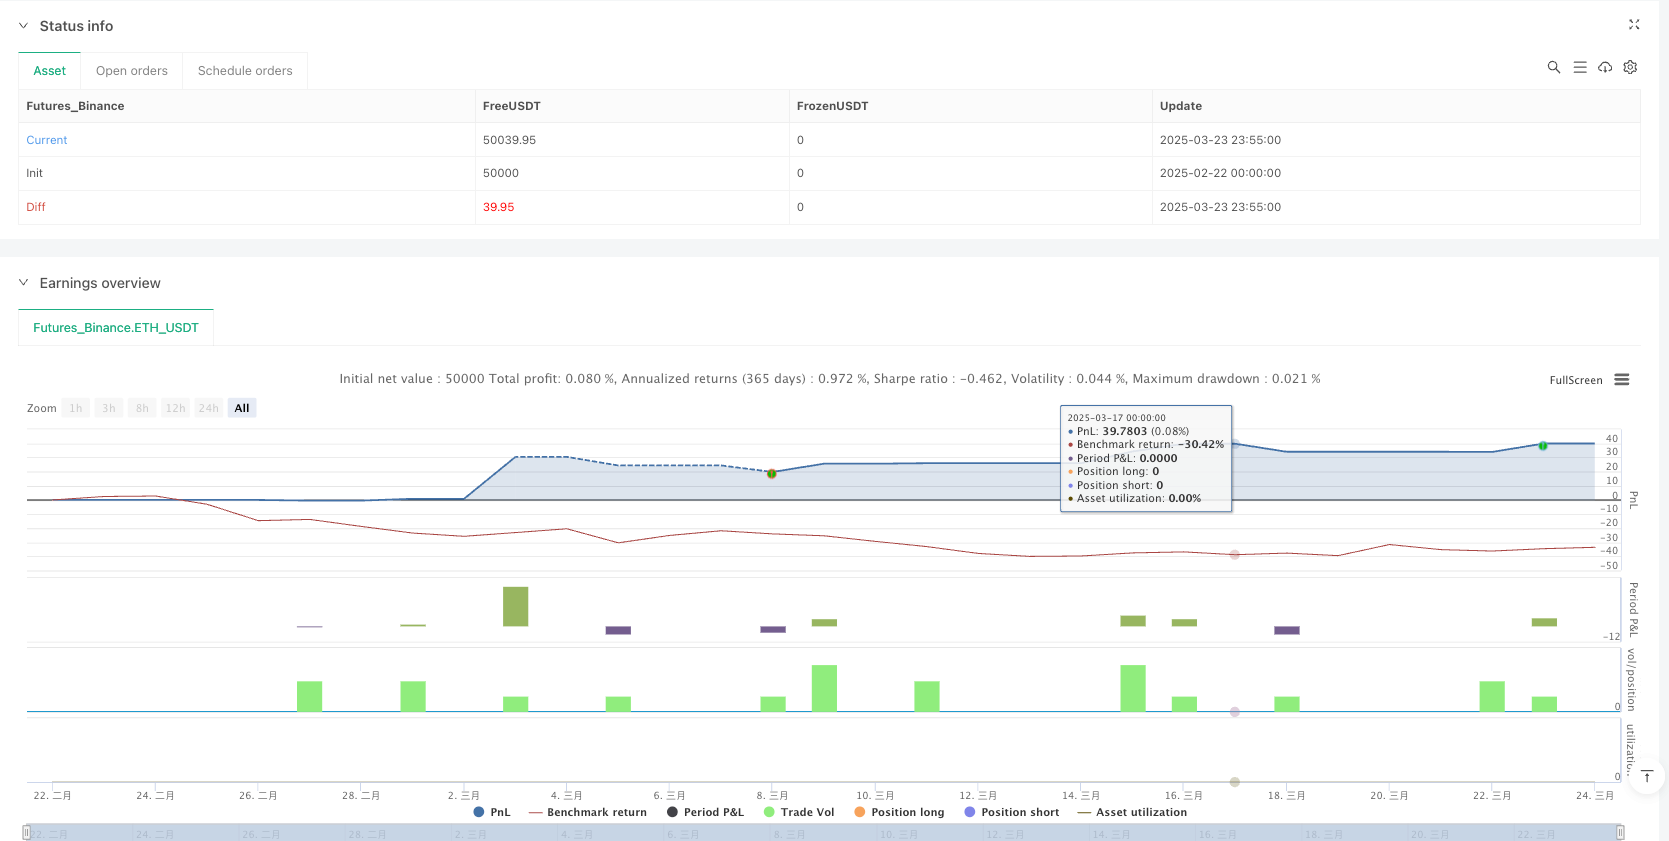
[trans]
概述
多时段指数移动平均线交叉策略与趋势确认系统是一个基于技术分析的量化交易策略,该策略主要利用两条不同周期的指数移动平均线(EMA)之间的交叉关系以及方向性指数(ADX)的变化来识别市场趋势并生成交易信号。策略核心思想是在特定的交易时段内,结合价格与EMA 50的交叉、EMA 50与EMA 200的相对位置关系以及ADX指标的趋势强度确认,形成一套完整的交易决策系统。该策略还集成了风险管理机制,通过预设的止盈止损水平来控制单笔交易的风险与收益比例。
策略原理
多时段指数移动平均线交叉策略与趋势确认系统的核心原理基于以下几个关键组件:
-
指数移动平均线(EMA)交叉系统:策略应用了两条关键的EMA,分别是短期的50周期EMA和长期的200周期EMA。当价格向上穿越EMA 50时,同时EMA 50位于EMA 200之上,形成潜在的做多信号;反之,当价格向下穿越EMA 50,同时EMA 50位于EMA 200之下,形成潜在的做空信号。
-
方向性指数(ADX)趋势确认:策略使用14周期的ADX指标来衡量趋势的强度,并通过比较正向方向指标(DI+)和负向方向指标(DI-)的相对值来确认趋势方向。当ADX值高于设定的阈值(默认为20)时,表明市场存在足够强的趋势,增加了交易信号的可靠性。
-
时段过滤:策略实现了双重时间过滤机制,一方面定义了特定的交易时段(默认为16:30-20:30),另一方面允许更精细地设置交易起始和结束的具体时间(小时和分钟)。这种设计使策略可以专注于特定市场的高活跃度时段,避免在波动性不足或市场噪音过大的时间内产生错误信号。
-
风险管理:策略内置了自动化的风险控制机制,为每笔交易设置了固定的止盈水平(默认为价格变动600个最小单位)和止损水平(默认为价格变动300个最小单位),这相当于2:1的风险收益比。此外,策略还利用ATR指标动态计算标签位置,使交易标记在图表上更加清晰可见。
-
视觉辅助:策略在图表上绘制了关键的技术指标,包括EMA 200、EMA 50、ADX以及DI+/DI-线,并使用颜色编码标记交易时段,提高了策略监控和分析的直观性。
策略优势
多时段指数移动平均线交叉策略与趋势确认系统具有以下显著优势:
-
多重确认机制:策略不仅依赖移动平均线交叉,还结合了趋势方向和强度确认,大大降低了假突破和假信号的风险。需要价格与均线交叉、均线相对位置正确以及ADX指标支持三重确认,显著提高了信号质量。
-
智能时间过滤:通过精确的时间段设置,策略可以针对特定市场的高效交易时段进行优化,避免在低流动性或高波动性不确定性时段进行交易,提高了整体的胜率和效率。
-
自动化风险管理:预设的止盈止损比例(2:1)体现了稳健的风险管理原则,确保即使在连续亏损的情况下,仍可以通过较少的盈利交易来维持整体盈利能力。
-
视觉反馈系统:策略通过图表标记和颜色编码,为交易者提供了清晰的视觉反馈,有助于实时监控策略执行情况并进行回测分析。
-
适应性强:虽然策略设定了默认参数,但提供了多个可调整的输入参数(如ADX周期、平滑度、阈值以及交易时段设置等),使交易者可以根据不同市场环境和个人风险偏好进行灵活调整。
策略风险
尽管这一策略设计相对完善,但仍存在以下潜在风险和局限性:
-
趋势反转延迟:由于策略基于移动平均线和ADX指标,这两者都属于滞后指标,可能在市场快速反转时无法及时捕捉转折点,导致入场或出场延迟,增加潜在的回撤。
-
横盘市场表现不佳:在无明显趋势的区间震荡市场中,移动平均线交叉可能频繁出现,导致多次错误信号和连续亏损。尽管ADX过滤有助于减轻这一问题,但仍无法完全避免在区间市场中的不良表现。
-
固定止盈止损的局限性:策略使用固定点数的止盈止损设置,而非基于市场波动性(如ATR倍数)动态调整,这可能在不同波动性环境下导致止损过紧或过松的问题。
-
参数优化的过度拟合风险:策略包含多个可调参数,包括EMA周期、ADX参数和交易时段等,过度优化这些参数可能导致策略在历史数据上表现良好,但在实际交易中效果不佳的过度拟合问题。
-
技术故障风险:如果策略部署在自动化交易系统中,可能面临技术故障、网络延迟或执行滑点等操作风险,尤其在交易时段开始和结束附近可能产生意外行为。
策略优化方向
针对上述风险和局限性,该策略可以从以下几个方向进行优化:
-
动态止损机制:将固定点数的止损策略改为基于ATR倍数的动态止损,使风险管理能够自动适应市场波动性的变化。例如,可以设置止损为当前ATR值的1.5倍或2倍,止盈为ATR的3倍或4倍,保持良好的风险收益比。
-
增加市场环境过滤:引入市场环境分类机制,例如通过长期ADX水平或波动率指标判断当前是趋势市还是震荡市,然后根据不同市场类型应用不同的策略参数或交易规则。
-
优化入场时机:在满足基本交易条件后,可考虑增加短期价格模式或动量确认,例如等待价格在穿越EMA 50后形成短期高点/低点突破,或者结合RSI等动量指标进行入场优化。
-
增加部分仓位管理:实现分批入场和分批止盈的机制,例如在信号触发时仅使用50%资金入场,在趋势继续发展时加仓,或在达到不同盈利水平时分批获利了结,提高策略的灵活性。
-
整合多时间周期分析:在当前15分钟周期的基础上,增加对更高时间周期(如1小时或4小时)趋势方向的判断,仅在多个时间周期趋势一致时才执行交易,进一步减少错误信号。
-
优化指标参数自适应机制:开发参数自适应机制,使EMA和ADX的关键参数能够根据近期市场波动特性自动调整,提高策略在不同市场环境下的适应性,避免固定参数导致的性能下降。
总结
多时段指数移动平均线交叉策略与趋势确认系统是一个结合了趋势跟踪、指标确认和时间过滤的综合交易策略。通过EMA交叉信号、ADX趋势确认以及严格的交易时段控制,该策略能够在强趋势市场中捕捉高概率交易机会。内置的风险管理机制和直观的视觉反馈系统进一步增强了策略的实用性和易用性。
然而,作为一个趋势跟踪系统,该策略在震荡市场中可能面临挑战,且存在入场延迟和固定止损的局限性。通过引入动态风险管理、市场环境过滤和多时间周期分析等优化措施,可以显著提升策略在不同市场环境下的稳健性和适应性。
对于追求技术分析和系统化交易的投资者,这一策略提供了一个结构清晰、逻辑严谨的交易框架,能够在适当的市场条件下产生可靠的交易信号,并通过内置的风险控制机制保护投资资本。最重要的是,策略的多个可调参数允许交易者根据自身风险偏好和目标市场特性进行个性化定制,实现长期稳定的交易绩效。 ||
Overview
The Multi-Timeframe Exponential Moving Average Crossover Strategy with Trend Confirmation System is a quantitative trading strategy based on technical analysis that primarily utilizes the crossover relationship between two Exponential Moving Averages (EMAs) of different periods and the Average Directional Index (ADX) to identify market trends and generate trading signals. The core concept involves analyzing price crossovers with the 50-period EMA, the relative position between the 50-period EMA and 200-period EMA, and trend strength confirmation using the ADX indicator within specific trading sessions. The strategy also integrates risk management mechanisms through preset take-profit and stop-loss levels to control the risk-to-reward ratio for each trade.
Strategy Principle
The Multi-Timeframe Exponential Moving Average Crossover Strategy with Trend Confirmation System is based on several key components:
-
Exponential Moving Average (EMA) Crossover System: The strategy employs two critical EMAs - a short-term 50-period EMA and a long-term 200-period EMA. When price crosses above the 50-period EMA while the 50-period EMA is above the 200-period EMA, a potential long signal is formed; conversely, when price crosses below the 50-period EMA while the 50-period EMA is below the 200-period EMA, a potential short signal is generated.
-
Average Directional Index (ADX) Trend Confirmation: The strategy uses a 14-period ADX indicator to measure trend strength and compares the Positive Directional Indicator (DI+) and Negative Directional Indicator (DI-) values to confirm trend direction. When the ADX value exceeds the set threshold (default 20), it indicates a sufficiently strong trend, enhancing the reliability of trading signals.
-
Time Filtering: The strategy implements a dual time filtering mechanism, defining specific trading sessions (default 16:30-20:30) while allowing for more precise setting of trading start and end times (hours and minutes). This design allows the strategy to focus on high-activity periods in specific markets, avoiding false signals during times of insufficient volatility or excessive market noise.
-
Risk Management: The strategy incorporates automated risk control mechanisms, setting fixed take-profit levels (default 600 price minimum movements) and stop-loss levels (default 300 price minimum movements) for each trade, equivalent to a 2:1 reward-to-risk ratio. Additionally, the strategy uses the ATR indicator to dynamically calculate label positions, making trade markers more clearly visible on the chart.
-
Visual Aids: The strategy plots key technical indicators on the chart, including EMA 200, EMA 50, ADX, and DI+/DI- lines, and uses color coding to mark trading sessions, enhancing the intuitiveness of strategy monitoring and analysis.
Strategy Advantages
The Multi-Timeframe Exponential Moving Average Crossover Strategy with Trend Confirmation System offers several significant advantages:
-
Multiple Confirmation Mechanisms: The strategy relies not only on moving average crossovers but also combines trend direction and strength confirmation, greatly reducing the risk of false breakouts and signals. It requires a triple confirmation of price-EMA crossover, correct EMA relative positioning, and ADX indicator support, significantly improving signal quality.
-
Intelligent Time Filtering: Through precise time period settings, the strategy can be optimized for efficient trading sessions in specific markets, avoiding trading during periods of low liquidity or high volatility uncertainty, thereby improving overall win rate and efficiency.
-
Automated Risk Management: The preset take-profit to stop-loss ratio (2:1) reflects sound risk management principles, ensuring that even in cases of consecutive losses, the strategy can maintain overall profitability through fewer winning trades.
-
Visual Feedback System: The strategy provides clear visual feedback through chart markers and color coding, helping traders monitor strategy execution in real-time and perform backtesting analysis.
-
High Adaptability: While the strategy has default parameters, it offers multiple adjustable input parameters (such as ADX period, smoothing, threshold, and trading session settings), allowing traders to make flexible adjustments based on different market environments and personal risk preferences.
Strategy Risks
Despite its relatively comprehensive design, this strategy still has the following potential risks and limitations:
-
Trend Reversal Delay: Since the strategy is based on moving averages and the ADX indicator, both of which are lagging indicators, it may not capture turning points in a timely manner during rapid market reversals, leading to delayed entries or exits and increasing potential drawdowns.
-
Poor Performance in Ranging Markets: In range-bound markets with no clear trend, moving average crossovers may occur frequently, resulting in multiple false signals and consecutive losses. Although ADX filtering helps mitigate this issue, it cannot completely avoid poor performance in range-bound markets.
-
Limitations of Fixed Take-Profit and Stop-Loss: The strategy uses fixed point settings for take-profit and stop-loss rather than dynamically adjusting based on market volatility (such as ATR multiples), which may lead to stops being too tight or too loose in different volatility environments.
-
Risk of Overfitting in Parameter Optimization: The strategy includes multiple adjustable parameters, including EMA periods, ADX parameters, and trading sessions. Excessive optimization of these parameters may lead to overfitting, where the strategy performs well on historical data but poorly in actual trading.
-
Technical Failure Risk: If the strategy is deployed in an automated trading system, it may face technical failures, network delays, or execution slippage, particularly near the beginning and end of trading sessions.
Strategy Optimization Directions
Addressing the risks and limitations mentioned above, the strategy can be optimized in the following directions:
-
Dynamic Stop-Loss Mechanism: Replace the fixed point stop-loss strategy with an ATR multiple-based dynamic stop-loss, allowing risk management to automatically adapt to changes in market volatility. For example, stop-loss could be set at 1.5 or 2 times the current ATR value, with take-profit at 3 or 4 times the ATR, maintaining a good risk-to-reward ratio.
-
Enhanced Market Environment Filtering: Introduce a market environment classification mechanism, such as using long-term ADX levels or volatility indicators to determine whether the current market is trending or range-bound, then apply different strategy parameters or trading rules based on different market types.
-
Optimized Entry Timing: After meeting basic trading conditions, consider adding short-term price patterns or momentum confirmation, such as waiting for price to form a short-term high/low breakout after crossing the EMA 50, or combining with momentum indicators like RSI for entry optimization.
-
Partial Position Management: Implement mechanisms for partial entry and partial profit-taking, such as entering with only 50% of funds when a signal triggers and adding to the position as the trend develops, or taking profits in stages at different profit levels, increasing strategy flexibility.
-
Integration of Multiple Timeframe Analysis: Building on the current 15-minute timeframe, add trend direction analysis from higher timeframes (such as 1-hour or 4-hour) and only execute trades when trends align across multiple timeframes, further reducing false signals.
-
Optimized Indicator Parameter Adaptation: Develop parameter adaptation mechanisms that allow key EMA and ADX parameters to automatically adjust based on recent market volatility characteristics, improving strategy adaptability across different market environments and avoiding performance degradation from fixed parameters.
Conclusion
The Multi-Timeframe Exponential Moving Average Crossover Strategy with Trend Confirmation System is a comprehensive trading approach combining trend following, indicator confirmation, and time filtering. Through EMA crossover signals, ADX trend confirmation, and strict trading session control, this strategy can capture high-probability trading opportunities in strong trending markets. The built-in risk management mechanism and intuitive visual feedback system further enhance the strategy's practicality and usability.
However, as a trend-following system, this strategy may face challenges in oscillating markets and has limitations related to entry delays and fixed stop-losses. By introducing dynamic risk management, market environment filtering, and multiple timeframe analysis, the strategy's robustness and adaptability across different market conditions can be significantly improved.
For investors pursuing technical analysis and systematic trading, this strategy provides a clearly structured and logically rigorous trading framework capable of generating reliable trading signals under appropriate market conditions while protecting investment capital through built-in risk control mechanisms. Most importantly, the strategy's multiple adjustable parameters allow traders to customize according to their risk preferences and target market characteristics, achieving long-term stable trading performance. [/trans]
Source (PineScript)
/*backtest
start: 2025-02-22 00:00:00
end: 2025-03-24 00:00:00
period: 5m
basePeriod: 5m
exchanges: [{"eid":"Futures_Binance","currency":"ETH_USDT"}]
*/

//@version=6
strategy("15 MIN Strategy", overlay=true)

// Parameters
ema200 = ta.ema(close, 200)
ema50 = ta.ema(close, 50)
bullish_crossover = ta.crossover(close, ema50) // Now stored in a variable
bearish_crossover = ta.crossunder(close, ema50) // Now stored in a variable
atr14 = ta.atr(14)

// ADX and DI+/DI- Calculation
adx_length = input(14, title="ADX Period")
adx_smoothing = input(14, title="ADX Smoothing") // Smoothing must be specified
adx_threshold = input(20, title="ADX Threshold") // Minimum ADX level
[diplus, diminus, adx] = ta.dmi(adx_length, adx_smoothing)

// Define the session
session_time = input("1630-2030", title="Session")

// Determine if the current time is within the selected session
in_session = na(time(timeframe.period, session_time)) ? false : true

// Color the background of the selected session
bgcolor(in_session ? color.new(color.blue, 85) : na)

// Trading hours with minutes
start_hour = input(16, "Start Hour")  // 4 PM
start_minute = input(30, "Start Minute") // 30 minutes
end_hour = input(20, "End Hour")  // 8 PM
end_minute = input(0, "End Minute") // 00 minutes

current_hour = hour(time)
current_minute = minute(time)

within_trading_hours = (current_hour > start_hour or (current_hour == start_hour and current_minute >= start_minute)) and (current_hour < end_hour or (current_hour == end_hour and current_minute <= end_minute))

// Buy conditions with ADX and DI+
buy_condition = close > ema50 and ema50 > ema200 and bullish_crossover and within_trading_hours and diplus > diminus

// Sell conditions with ADX and DI-
sell_condition = close < ema50 and ema50 < ema200 and bearish_crossover and within_trading_hours and diminus > diplus

// Execute trades with TP and SL
take_profit = 600 // 60 points
stop_loss = 300 // 30 points

if buy_condition
    strategy.entry("Buy", strategy.long)
    strategy.exit("TP/SL Buy", from_entry="Buy", limit=close + take_profit * syminfo.mintick, stop=close - stop_loss * syminfo.mintick)
    label_pos = low - (atr14 * 0.5)
    label.new(bar_index, label_pos, "Buy", color=color.green, style=label.style_triangleup, size=size.small)

if sell_condition
    strategy.entry("Sell", strategy.short)
    strategy.exit("TP/SL Sell", from_entry="Sell", limit=close - take_profit * syminfo.mintick, stop=close + stop_loss * syminfo.mintick)
    label_pos = high + (atr14 * 0.5)
    label.new(bar_index, label_pos, "Sell", color=color.red, style=label.style_triangledown, size=size.small)

// Plot EMAs and ADX
plot(ema200, title="EMA 200", color=color.blue)
plot(ema50, title="EMA 50", color=color.orange)
plot(adx, title="ADX", color=color.purple, linewidth=2)
plot(diplus, title="DI+", color=color.green)
plot(diminus, title="DI-", color=color.red)
hline(adx_threshold, "ADX Threshold", color=color.gray, linestyle=hline.style_dashed)
Detail
https://www.fmz.com/strategy/488165
Last Modified
2025-03-25 16:58:58