
20 KiB
Name
多时段动态动量波动捕捉策略-Multi-Timeframe-Dynamic-Momentum-Wave-Capture-Strategy
Author
ianzeng123
Strategy Description
[trans]
概述
多时段动态动量波动捕捉策略是一种专为短线交易者设计的2分钟级别高效捕捉市场波动的量化交易方法。该策略巧妙结合了均线通道、动量波动指标和多时段确认机制,形成了一个完整的交易系统。策略核心在于利用200均线构建的价格通道来确定市场大趋势方向,同时使用改良版WaveTrend指标捕捉市场超买超卖区域的反转机会,并通过12EMA作为精确入场信号过滤器。此外,策略还整合了小时级别的趋势确认,动态止损设置和基于风险的仓位管理,形成了一个全面而系统的交易框架。
策略原理
该策略的核心原理基于多层次信号确认和精确的风险控制,具体实现逻辑如下:
-
趋势判断层:策略使用200均线分别应用于高价和低价构建价格通道,并结合小时图收盘价来判断大趋势方向。当小时收盘价位于通道上方时,系统偏向做多;当小时收盘价位于通道下方时,系统偏向做空。
-
动量波动层:策略采用改良版的WaveTrend指标来捕捉市场动量的变化。WaveTrend指标是通过自定义函数
f_wavetrend计算得出,其中包含了波动趋势线(wt1)和信号线(wt2)。当指标达到超买水平(50)或超卖水平(-50)时,系统会记录极值价格并计算持续的超买超卖状态条数。 -
入场确认层:策略结合了多个条件确认入场信号:
- 做多条件:小时级别价格在通道上方 + (超卖状态持续指定条数或WaveTrend指标金叉) + 当前收盘价大于12EMA
- 做空条件:小时级别价格在通道下方 + (超买状态持续指定条数或WaveTrend指标死叉) + 当前收盘价小于12EMA
-
风险管理层:策略使用动态止损和基于风险的仓位计算方法:
- 做多止损设置为极值低点和200低价均线*0.998的较小值
- 做空止损设置为极值高点和200高价均线*1.002的较大值
- 仓位大小通过预设风险金额除以每单位风险(入场价与止损价差值)来计算
-
获利目标:系统根据预设的风险回报比(默认3倍)自动设置获利目标位置。
策略优势
-
多层次确认机制:策略整合了多时段、多指标的确认机制,显著提高了信号质量。通过小时图趋势方向与短周期动量指标的结合,有效减少了假信号。
-
动态风险管理:相比固定点数的止损设置,该策略的动态止损方法更加贴合市场结构,通过极值点位与均线的结合,为每笔交易提供了更合理的风险边界。
-
精确的仓位控制:策略采用基于固定风险金额的仓位计算方法,无论市场波动率如何变化,都能保持一致的风险敞口,有效防止单笔交易的过度损失。
-
自适应性强:通过参数化设计,策略可以适应不同市场环境。用户可以调整EMA长度、超买超卖阈值、风险金额和风险回报比等参数,使策略更好地适应特定市场。
-
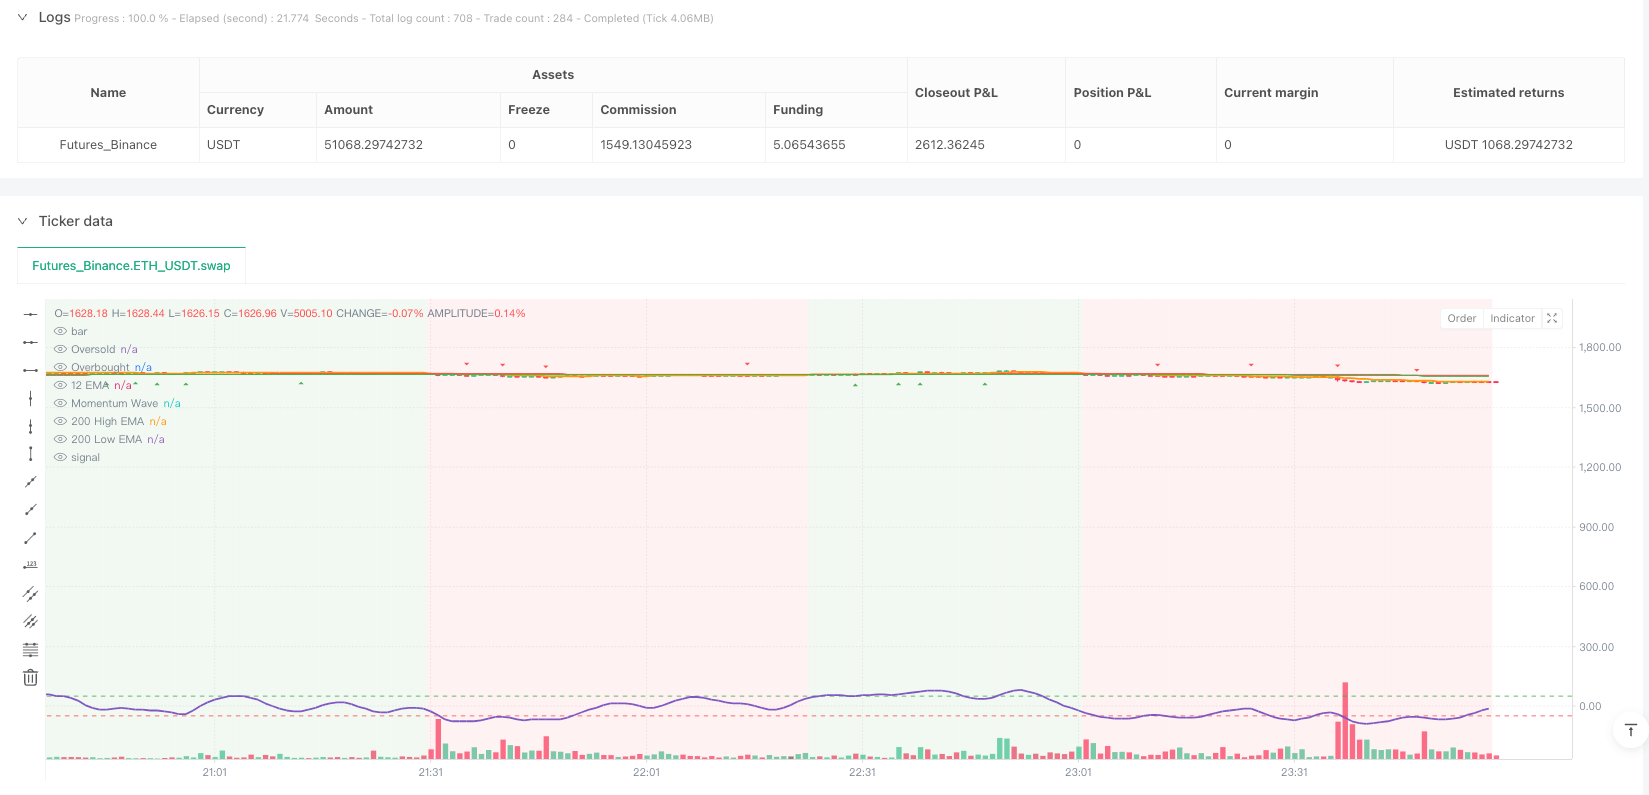
视觉化辅助:策略提供了丰富的视觉化元素,包括均线通道、动量波形、趋势背景色和入场标记,帮助交易者更直观地理解市场状态和策略逻辑。
策略风险
尽管该策略具有多重优势,但仍存在以下潜在风险:
-
趋势突变风险:虽然策略使用了小时级别的趋势确认,但在重大新闻或黑天鹅事件影响下,市场可能出现急剧反转,导致止损被迅速触发。解决方法是在重要经济数据或新闻发布前暂停交易,或增加额外的波动率过滤器。
-
低流动性风险:在交易量较低的市场或时段,可能出现滑点增加或成交困难的情况,影响策略表现。建议在主要交易时段使用该策略,并避开市场流动性较差的品种。
-
参数优化风险:过度优化参数可能导致策略在历史测试中表现优异但在实盘中效果不佳。建议采用前向验证法和稳健性测试来评估参数的可靠性,避免过度拟合。
-
连续亏损风险:尽管策略有严格的风险控制,但仍可能遇到连续亏损的情况,尤其是在震荡市场中。建议设置最大日损失和最大连续亏损次数的限制,必要时暂停交易重新评估市场环境。
-
技术依赖风险:策略依赖于EMA和WaveTrend等技术指标,这些指标在某些市场条件下可能失效。可以考虑增加基本面过滤器或其他非相关性指标来提高策略的稳健性。
策略优化方向
基于对策略代码的深入分析,可以从以下几个方面进行优化:
-
时间过滤器引入:当前策略没有考虑交易时间因素,可以添加时间过滤器,避开市场开盘和收盘前的高波动时段,或专注于特定的高效交易时段。
-
动态参数自适应:可以根据市场波动率自动调整超买超卖阈值和确认条数,使策略在不同市场环境中保持最佳表现。例如,可以使用ATR指标来调整阈值,在高波动市场提高阈值,低波动市场降低阈值。
-
多指标综合评分:除了现有的WaveTrend指标,可以引入RSI、MACD或CCI等辅助指标,建立综合评分系统,只有当多数指标达到一致意见时才触发交易信号。
-
盈利目标动态调整:当前策略使用固定的风险回报比设置盈利目标,可以考虑基于支撑阻力位或波动率的动态盈利目标,更好地适应市场结构。
-
部分获利机制:增加分批平仓机制,在达到一定盈利后锁定部分利润,剩余仓位继续持有以捕捉更大行情,平衡了风险控制和盈利最大化的需求。
-
交易成本优化:策略中没有考虑交易成本因素,可以添加滑点和佣金设置,并优化入场逻辑以减少不必要的交易频率,提高净盈利表现。
总结
多时段动态动量波动捕捉策略是一个结构完善、逻辑清晰的短线交易系统,通过结合均线通道、动量波动指标和多时段确认机制,为交易者提供了高质量的入场信号。该策略最大的特点在于其全面的风险管理体系,包括动态止损设置和基于风险的仓位控制,有效保障了资金安全。
尽管存在市场突变和参数优化等潜在风险,但通过引入时间过滤器、动态参数自适应、多指标综合评分等优化措施,可以进一步提升策略的稳健性和适应性。该策略特别适合那些追求高效率短线交易,同时注重风险控制的量化交易者。
通过合理设置参数并持续监控和优化,这个策略有潜力成为交易者武器库中的重要工具,帮助他们在快速波动的市场中把握交易机会,实现稳定盈利。 ||
Overview
The Multi-Timeframe Dynamic Momentum Wave Capture Strategy is a sophisticated quantitative trading approach designed for short-term traders operating on a 2-minute timeframe to efficiently capture market waves. This strategy ingeniously combines EMA channels, momentum wave indicators, and multi-timeframe confirmation mechanisms to form a comprehensive trading system. The core concept revolves around utilizing a 200 EMA-based price channel to determine the market's primary trend direction, while employing an enhanced WaveTrend indicator to capture reversal opportunities in overbought and oversold areas, with a 12 EMA serving as a precise entry signal filter. Additionally, the strategy integrates hourly trend confirmation, dynamic stop-loss settings, and risk-based position management to create a thorough and systematic trading framework.
Strategy Principles
The core principles of this strategy are based on multi-level signal confirmation and precise risk control, with specific implementation logic as follows:
-
Trend Determination Layer: The strategy applies the 200 EMA separately to high and low prices to construct a price channel, combined with hourly chart closing prices to determine the major trend direction. When the hourly closing price is above the channel, the system favors long positions; when the hourly closing price is below the channel, the system favors short positions.
-
Momentum Wave Layer: The strategy employs an enhanced WaveTrend indicator to capture market momentum changes. The WaveTrend indicator is calculated through a custom function
f_wavetrend, which includes a wave trend line (wt1) and a signal line (wt2). When the indicator reaches overbought (50) or oversold (-50) levels, the system records extreme price values and counts the duration of overbought or oversold conditions. -
Entry Confirmation Layer: The strategy combines multiple conditions to confirm entry signals:
- Long condition: Hourly price above the channel + (Oversold condition persisting for a specified number of bars or WaveTrend indicator golden cross) + Current closing price greater than 12 EMA
- Short condition: Hourly price below the channel + (Overbought condition persisting for a specified number of bars or WaveTrend indicator death cross) + Current closing price less than 12 EMA
-
Risk Management Layer: The strategy employs dynamic stop-losses and risk-based position calculation:
- Long stop-loss is set at the smaller value between the extreme low point and 200 low price EMA*0.998
- Short stop-loss is set at the larger value between the extreme high point and 200 high price EMA*1.002
- Position size is calculated by dividing the preset risk amount by the per-unit risk (difference between entry price and stop-loss price)
-
Profit Target: The system automatically sets profit target levels based on a preset risk-reward ratio (default is 3x).
Strategy Advantages
-
Multi-level Confirmation Mechanism: The strategy integrates multi-timeframe, multi-indicator confirmation mechanisms, significantly improving signal quality. By combining hourly chart trend direction with short-term momentum indicators, false signals are effectively reduced.
-
Dynamic Risk Management: Compared to fixed-point stop-loss settings, this strategy's dynamic stop-loss method better aligns with market structure, providing more reasonable risk boundaries for each trade through the combination of extreme points and moving averages.
-
Precise Position Control: The strategy adopts a position calculation method based on fixed risk amounts, maintaining consistent risk exposure regardless of market volatility changes, effectively preventing excessive losses in individual trades.
-
Strong Adaptability: Through parametric design, the strategy can adapt to different market environments. Users can adjust EMA lengths, overbought/oversold thresholds, risk amounts, and risk-reward ratios to better suit specific markets.
-
Visual Assistance: The strategy provides rich visualization elements, including EMA channels, momentum waveforms, trend background colors, and entry markers, helping traders more intuitively understand market conditions and strategy logic.
Strategy Risks
Despite its multiple advantages, the strategy still has the following potential risks:
-
Trend Reversal Risk: Although the strategy uses hourly trend confirmation, markets may experience sharp reversals under major news or black swan events, causing stop-losses to be quickly triggered. The solution is to pause trading before important economic data or news releases, or to add additional volatility filters.
-
Low Liquidity Risk: In markets or time periods with lower trading volume, increased slippage or difficulty in execution may occur, affecting strategy performance. It is recommended to use this strategy during main trading sessions and avoid instruments with poor market liquidity.
-
Parameter Optimization Risk: Excessive parameter optimization may lead to a strategy that performs excellently in historical testing but poorly in live trading. Forward validation methods and robustness tests are recommended to assess parameter reliability and avoid overfitting.
-
Consecutive Loss Risk: Despite strict risk control, consecutive losses may still occur, especially in range-bound markets. It is advisable to set limits on maximum daily losses and maximum consecutive losing trades, pausing trading to reassess market conditions when necessary.
-
Technical Dependency Risk: The strategy relies on technical indicators such as EMA and WaveTrend, which may fail under certain market conditions. Consider adding fundamental filters or other non-correlated indicators to improve strategy robustness.
Strategy Optimization Directions
Based on in-depth analysis of the strategy code, optimization can be pursued in the following areas:
-
Time Filter Introduction: The current strategy does not consider trading time factors. Time filters could be added to avoid high volatility periods at market open and close, or to focus on specific efficient trading sessions.
-
Dynamic Parameter Adaptation: Overbought/oversold thresholds and confirmation bar counts could be automatically adjusted according to market volatility, maintaining optimal performance across different market environments. For example, ATR indicators could be used to adjust thresholds—raising them in high-volatility markets and lowering them in low-volatility markets.
-
Multi-indicator Comprehensive Scoring: Besides the existing WaveTrend indicator, auxiliary indicators such as RSI, MACD, or CCI could be introduced to establish a comprehensive scoring system, triggering trading signals only when multiple indicators reach consensus.
-
Dynamic Profit Target Adjustment: The current strategy uses a fixed risk-reward ratio to set profit targets. Consider dynamic profit targets based on support/resistance levels or volatility to better adapt to market structure.
-
Partial Profit Mechanism: Add a scaled exit mechanism to secure partial profits when reaching certain profitability levels, while holding remaining positions to capture larger movements, balancing risk control and profit maximization.
-
Trading Cost Optimization: The strategy does not account for trading costs. Adding slippage and commission settings and optimizing entry logic to reduce unnecessary trading frequency could improve net profit performance.
Summary
The Multi-Timeframe Dynamic Momentum Wave Capture Strategy is a well-structured, logically sound short-term trading system that provides traders with high-quality entry signals by combining EMA channels, momentum wave indicators, and multi-timeframe confirmation mechanisms. The strategy's greatest feature is its comprehensive risk management system, including dynamic stop-loss settings and risk-based position control, effectively safeguarding capital.
Despite potential risks such as market reversals and parameter optimization challenges, the strategy's robustness and adaptability can be further enhanced by introducing time filters, dynamic parameter adaptation, and multi-indicator comprehensive scoring systems. This strategy is particularly suitable for quantitative traders who pursue efficient short-term trading while emphasizing risk control.
With reasonable parameter settings and continuous monitoring and optimization, this strategy has the potential to become an important tool in a trader's arsenal, helping them capture trading opportunities in rapidly fluctuating markets and achieve stable profits.[/trans]
Source (PineScript)
/*backtest
start: 2025-03-16 00:00:00
end: 2025-04-15 00:00:00
period: 1m
basePeriod: 1m
exchanges: [{"eid":"Futures_Binance","currency":"ETH_USDT"}]
*/

//@version=5
strategy("Enhanced Momentum Wave Catcher", overlay=true,
  default_qty_type=strategy.cash,
  default_qty_value=10000,
  initial_capital=10000,
  currency="USD")

// Inputs
fastEmaLength = input.int(12, "12 EMA Length", minval=1)
slowEmaHighLength = input.int(200, "200 High EMA Length", minval=1)
slowEmaLowLength = input.int(200, "200 Low EMA Length", minval=1)
oversoldLevel = input.int(-50, "Oversold Level")
overboughtLevel = input.int(50, "Overbought Level")
riskAmount = input.float(100.0, "Risk Amount ($)", minval=1.0)
rrRatio = input.float(3.0, "Risk-Reward Ratio", minval=0.1)
confirmationBars = input.int(1, "Confirmation Bars After Extreme", minval=0)

// Calculate EMAs
fastEma = ta.ema(close, fastEmaLength)
slowEmaHigh = ta.ema(high, slowEmaHighLength)
slowEmaLow = ta.ema(low, slowEmaLowLength)

// Hourly close
hourlyClose = request.security(syminfo.tickerid, "60", close)

// Enhanced Momentum Wave Calculation
f_wavetrend(src, chlen, avg, malen) =>
    esa = ta.ema(src, chlen)
    de = ta.ema(math.abs(src - esa), chlen)
    ci = (src - esa) / (0.015 * de)
    wt1 = ta.ema(ci, avg)
    wt2 = ta.sma(wt1, malen)
    wtCrossUp = ta.crossover(wt1, wt2)
    wtCrossDown = ta.crossunder(wt1, wt2)
    [wt1, wt2, wtCrossUp, wtCrossDown]

[wt1, wt2, wtCrossUp, wtCrossDown] = f_wavetrend(hlc3, 9, 12, 3)

// Track extremes with improved detection
var int oversoldBars = 0
var int overboughtBars = 0
var float extremeLow = na
var float extremeHigh = na

// Enhanced extreme detection
if wt2 <= oversoldLevel
    oversoldBars := oversoldBars + 1
    extremeLow := na(extremeLow) ? low : math.min(low, extremeLow)
else
    oversoldBars := 0
    extremeLow := na

if wt2 >= overboughtLevel
    overboughtBars := overboughtBars + 1
    extremeHigh := na(extremeHigh) ? high : math.max(high, extremeHigh)
else
    overboughtBars := 0
    extremeHigh := na

// Hourly Channel Status
var bool hourlyAboveChannel = false
var bool hourlyBelowChannel = false

if barstate.isconfirmed
    if hourlyClose > slowEmaHigh
        hourlyAboveChannel := true
        hourlyBelowChannel := false
    else if hourlyClose < slowEmaLow
        hourlyAboveChannel := false
        hourlyBelowChannel := true

// Entry Conditions with improved wave detection
longCondition = hourlyAboveChannel and (oversoldBars > confirmationBars or wtCrossUp) and close > fastEma
shortCondition = hourlyBelowChannel and (overboughtBars > confirmationBars or wtCrossDown) and close < fastEma

// Dynamic Stops
longStop = math.min(extremeLow, slowEmaLow * 0.998)
shortStop = math.max(extremeHigh, slowEmaHigh * 1.002)

// Position Sizing
calculatePositionSize(entryPrice, stopPrice) =>
    riskPerUnit = math.abs(entryPrice - stopPrice)
    riskPerUnit > 0 ? riskAmount / riskPerUnit : na

// Execute Trades
if longCondition and not na(longStop)
    strategy.entry("Long", strategy.long, qty=calculatePositionSize(close, longStop))
    strategy.exit("Long Exit", "Long", stop=longStop, limit=close + (rrRatio * (close - longStop)))

if shortCondition and not na(shortStop)
    strategy.entry("Short", strategy.short, qty=calculatePositionSize(close, shortStop))
    strategy.exit("Short Exit", "Short", stop=shortStop, limit=close - (rrRatio * (shortStop - close)))

// Enhanced Visuals
plot(fastEma, "12 EMA", color=color.orange, linewidth=2)
plot(slowEmaHigh, "200 High EMA", color=color.red, linewidth=1)
plot(slowEmaLow, "200 Low EMA", color=color.green, linewidth=1)

// Wave visualization
plot(wt2, "Momentum Wave", color=#7E57C2, linewidth=2)
hline(oversoldLevel, "Oversold", color=color.red, linestyle=hline.style_dashed)
hline(overboughtLevel, "Overbought", color=color.green, linestyle=hline.style_dashed)

// Channel status
bgcolor(hourlyAboveChannel ? color.new(color.green, 90) :
       hourlyBelowChannel ? color.new(color.red, 90) :
       color.new(color.gray, 90))

// Entry markers
plotshape(longCondition, "Long Entry", style=shape.triangleup,
         location=location.belowbar, color=color.green, size=size.small)
plotshape(shortCondition, "Short Entry", style=shape.triangledown,
         location=location.abovebar, color=color.red, size=size.small)
Detail
https://www.fmz.com/strategy/490787
Last Modified
2025-04-16 14:53:29