
12 KiB
Name
多指标高杠杆短线交易策略-Multi-Indicator-High-Leverage-Short-Term-Trading-Strategy
Author
ChaoZhang
Strategy Description
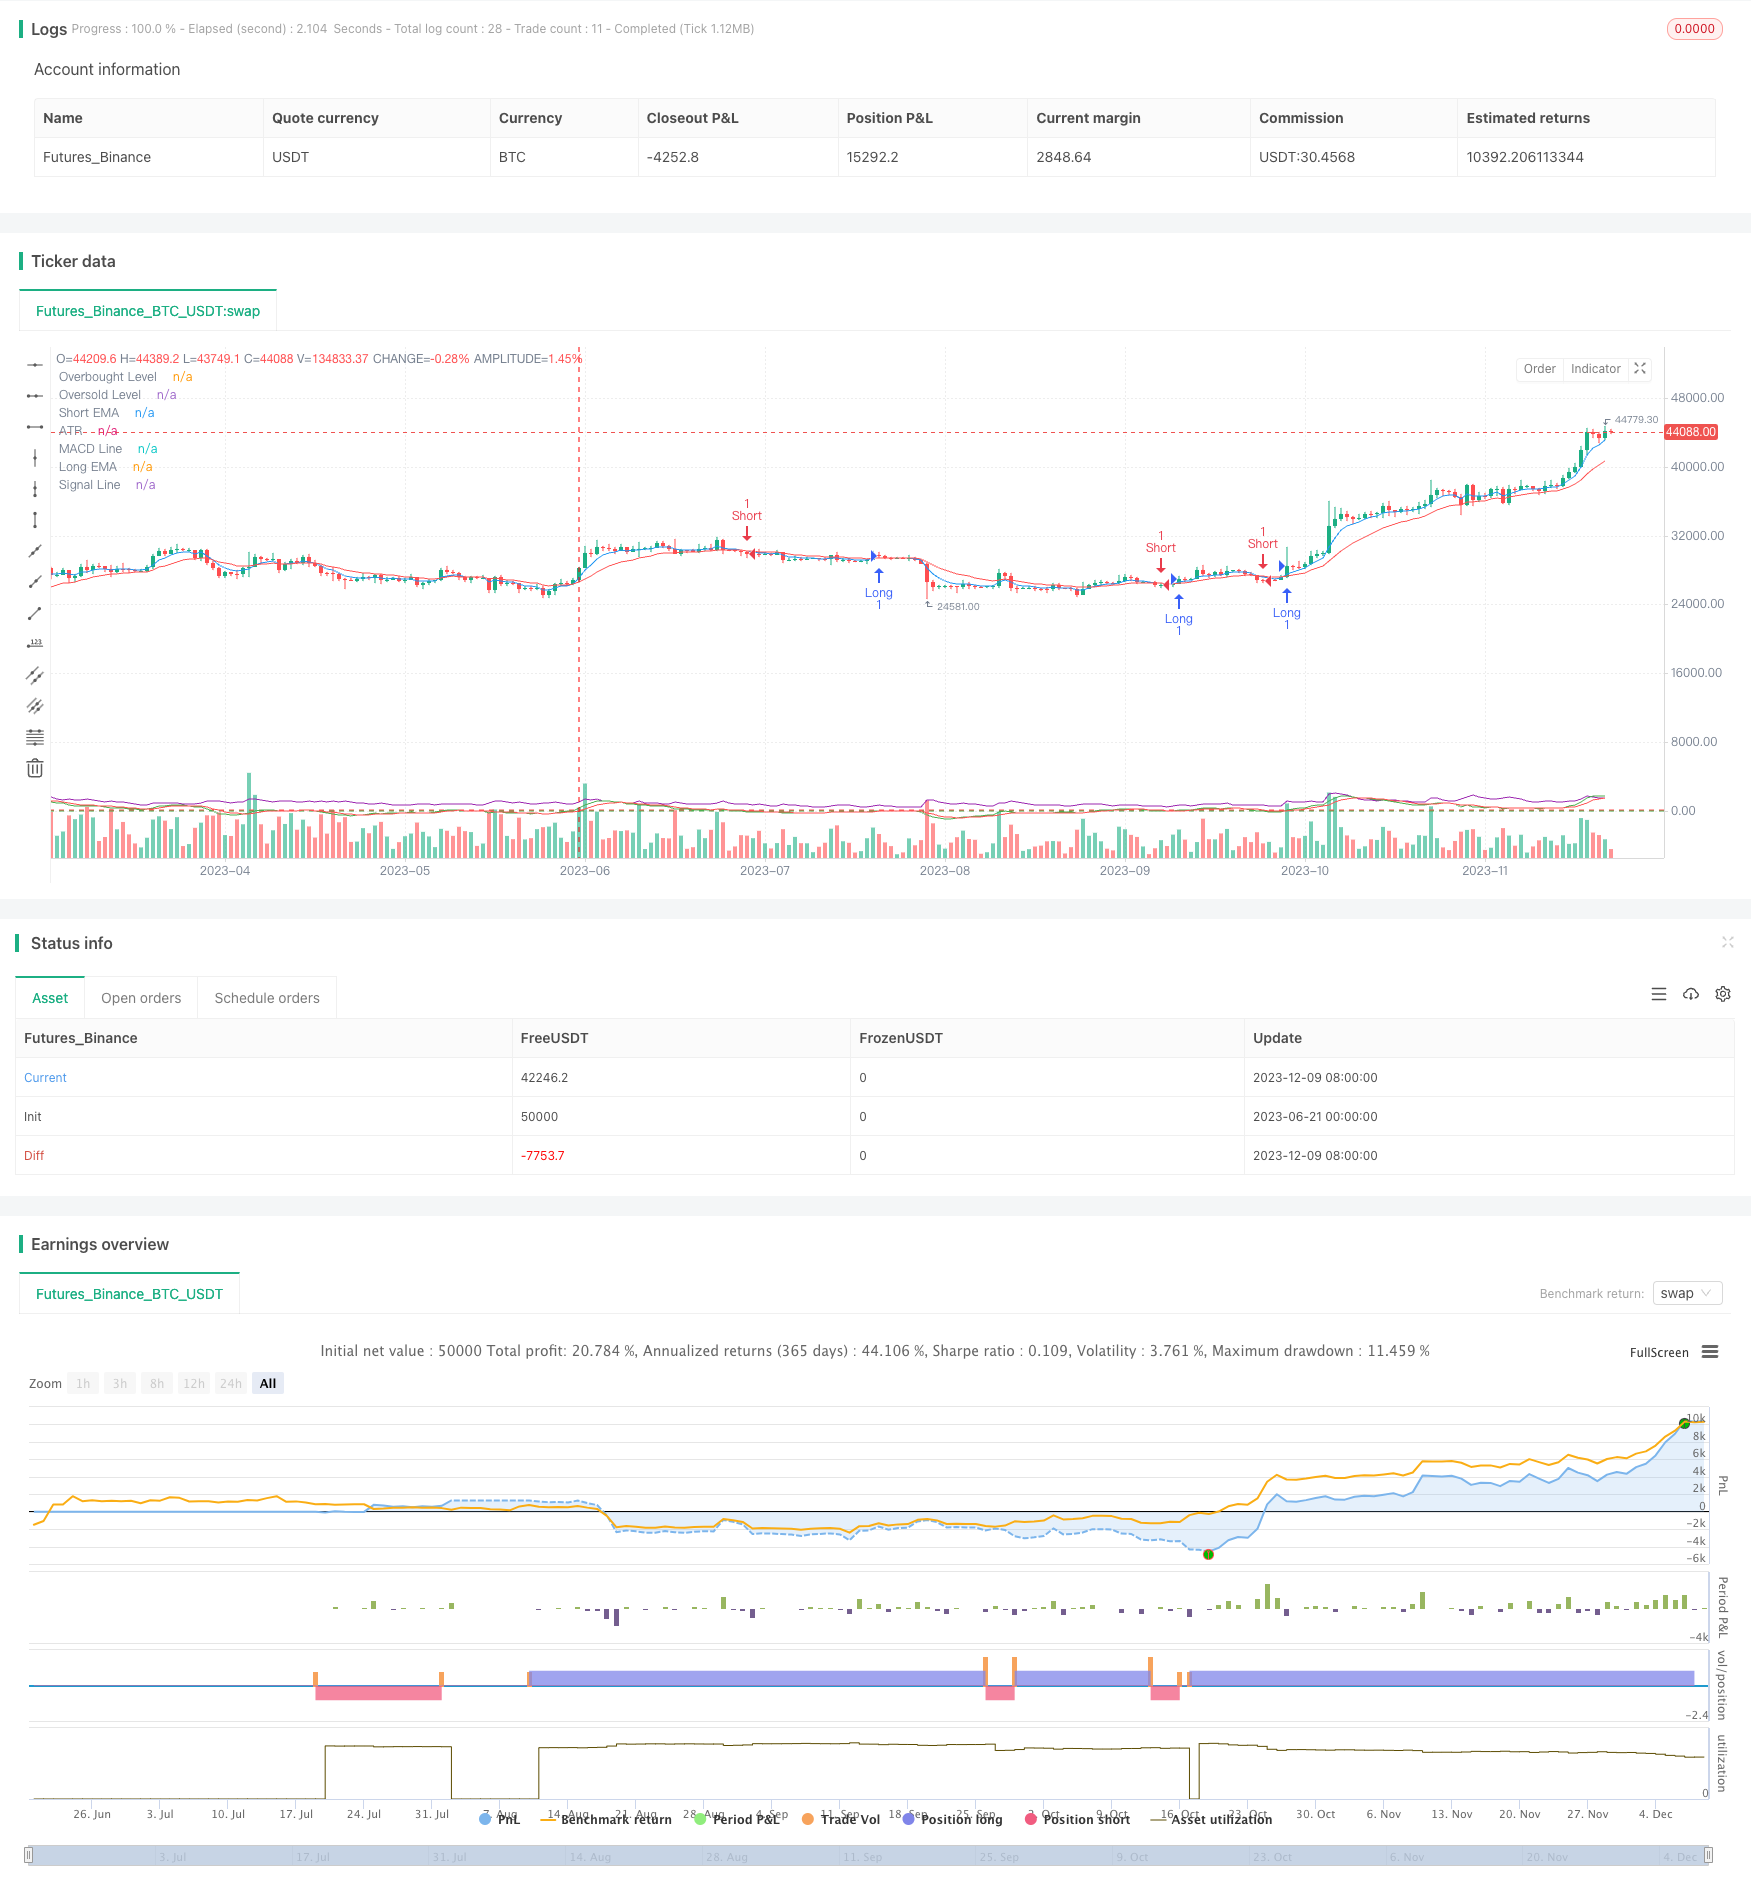
[trans]
概述
本文介绍了一种名为"多指标高杠杆短线交易策略"的量化交易方法。该策略旨在利用多个技术指标的组合,在短时间内捕捉市场波动,实现快速获利。策略核心是通过指数移动平均线(EMA)、相对强弱指标(RSI)、移动平均线趋同散度指标(MACD)以及平均真实范围(ATR)的协同作用,精准定位入场和出场时机,同时运用高杠杆放大收益。
策略原理
-
趋势识别:使用5周期和15周期的EMA交叉来判断短期趋势方向。当短期EMA上穿长期EMA时,视为上升趋势;反之则为下降趋势。
-
超买超卖判断:采用7周期的RSI指标,设定80为超买阈值,20为超卖阈值。RSI低于80时考虑做多,高于20时考虑做空,避免在极端区域开仓。
-
趋势确认:利用MACD指标(参数为6,13,5)进一步验证趋势强度。MACD线位于信号线上方支持做多,位于下方支持做空。
-
风险管理:基于5周期ATR设置动态止损和止盈水平,乘数为1.5倍,以适应市场波动性。
-
入场条件:
- 做多:短期EMA上穿长期EMA,RSI低于80,MACD线在信号线上方。
- 做空:短期EMA下穿长期EMA,RSI高于20,MACD线在信号线下方。
-
出场条件:达到基于ATR设置的动态止损或止盈位。
策略优势
-
多维度分析:结合趋势、动量和波动性指标,全面评估市场状况,提高交易准确性。
-
快速反应:短周期指标设置使策略能够迅速捕捉市场变化,适合短线交易。
-
风险控制:动态止损止盈机制根据市场波动自动调整,有效控制风险。
-
高收益潜力:利用高杠杆放大收益,适合风险承受能力较强的交易者。
-
自适应性:ATR based风险管理使策略能够适应不同市场环境。
-
清晰的交易信号:多指标协同提供明确的入场和出场信号,减少主观判断。
策略风险
-
高杠杆风险:虽然高杠杆可以放大收益,但同时也会放大损失,可能导致账户快速亏损。
-
假突破风险:短期EMA交叉可能产生假信号,导致频繁交易和不必要的手续费损失。
-
趋势反转风险:在强趋势市场中,RSI可能长期处于超买或超卖状态,影响策略表现。
-
市场波动风险:在剧烈波动行情下,ATR based止损可能过宽,增加单笔交易风险。
-
滑点风险:高频交易可能面临严重滑点,实际执行价格可能与预期有较大偏差。
-
系统风险:依赖多个指标的复杂策略可能因单个指标失效而整体表现下降。
策略优化方向
-
参数优化:可通过回测对EMA、RSI、MACD和ATR的参数进行细致调优,以适应不同市场周期。
-
增加过滤器:引入成交量、波动率等额外指标作为过滤条件,减少假信号。
-
时间过滤:加入交易时间窗口限制,避开波动较大或流动性不足的时段。
-
动态杠杆管理:根据市场波动性和账户净值动态调整杠杆率,平衡风险和收益。
-
趋势强度评估:整合趋势强度指标,如ADX,仅在强趋势市场开仓,提高胜率。
-
机器学习优化:利用机器学习算法动态调整指标权重,提高策略适应性。
-
多时间框架分析:结合更长周期指标确认大趋势,提高交易方向的准确性。
-
风险敞口管理:设置最大允许亏损金额和最大持仓数量,控制整体风险。
总结
"多指标高杠杆短线交易策略"是一种结合多种技术指标,旨在短期内捕捉市场机会的高频交易方法。通过EMA、RSI、MACD和ATR的协同作用,该策略能够快速识别趋势,确定入场和出场时机,同时利用高杠杆放大收益。尽管策略具有反应迅速、收益潜力大等优势,但也面临高杠杆风险、假突破风险等挑战。为了提高策略的稳定性和盈利能力,可以从参数优化、增加过滤条件、动态风险管理等方面进行改进。总的来说,这是一个适合经验丰富、风险承受能力强的交易者的复杂策略,在实际应用中需要谨慎管理风险,并根据市场变化不断优化调整。
||
Overview
This article introduces a quantitative trading method called "Multi-Indicator High Leverage Short-Term Trading Strategy". The strategy aims to capture market volatility in a short period of time using a combination of multiple technical indicators to achieve quick profits. The core of the strategy is to precisely locate entry and exit points through the synergy of Exponential Moving Average (EMA), Relative Strength Index (RSI), Moving Average Convergence Divergence (MACD), and Average True Range (ATR), while using high leverage to amplify returns.
Strategy Principles
-
Trend Identification: Uses 5-period and 15-period EMA crossovers to determine short-term trend direction. An uptrend is identified when the short-term EMA crosses above the long-term EMA; conversely, a downtrend is identified.
-
Overbought/Oversold Judgment: Employs a 7-period RSI indicator, setting 80 as the overbought threshold and 20 as the oversold threshold. Consider long positions when RSI is below 80 and short positions when above 20, avoiding extreme areas for entry.
-
Trend Confirmation: Utilizes the MACD indicator (parameters 6, 13, 5) to further verify trend strength. The MACD line above the signal line supports long positions, below supports short positions.
-
Risk Management: Sets dynamic stop-loss and take-profit levels based on 5-period ATR, with a multiplier of 1.5, to adapt to market volatility.
-
Entry Conditions:
- Long: Short-term EMA crosses above long-term EMA, RSI below 80, MACD line above signal line.
- Short: Short-term EMA crosses below long-term EMA, RSI above 20, MACD line below signal line.
-
Exit Conditions: Reach the dynamic stop-loss or take-profit levels set based on ATR.
Strategy Advantages
-
Multi-dimensional Analysis: Combines trend, momentum, and volatility indicators for comprehensive market assessment, improving trading accuracy.
-
Quick Response: Short-period indicator settings allow the strategy to rapidly capture market changes, suitable for short-term trading.
-
Risk Control: Dynamic stop-loss and take-profit mechanism automatically adjusts based on market volatility, effectively controlling risk.
-
High Profit Potential: Uses high leverage to amplify returns, suitable for traders with higher risk tolerance.
-
Adaptability: ATR-based risk management allows the strategy to adapt to different market environments.
-
Clear Trading Signals: Multiple indicators working together provide clear entry and exit signals, reducing subjective judgment.
Strategy Risks
-
High Leverage Risk: While high leverage can amplify profits, it also magnifies losses, potentially leading to rapid account depletion.
-
False Breakout Risk: Short-term EMA crossovers may produce false signals, leading to frequent trading and unnecessary transaction costs.
-
Trend Reversal Risk: In strong trending markets, RSI may remain in overbought or oversold conditions for extended periods, affecting strategy performance.
-
Market Volatility Risk: In highly volatile markets, ATR-based stop-losses may be too wide, increasing single trade risk.
-
Slippage Risk: High-frequency trading may face severe slippage, with actual execution prices potentially deviating significantly from expectations.
-
Systemic Risk: Complex strategies relying on multiple indicators may suffer overall performance decline if a single indicator fails.
Strategy Optimization Directions
-
Parameter Optimization: Fine-tune parameters for EMA, RSI, MACD, and ATR through backtesting to adapt to different market cycles.
-
Additional Filters: Introduce extra indicators like volume and volatility as filtering conditions to reduce false signals.
-
Time Filtering: Add trading time window restrictions to avoid periods of high volatility or low liquidity.
-
Dynamic Leverage Management: Adjust leverage ratios dynamically based on market volatility and account equity to balance risk and return.
-
Trend Strength Assessment: Integrate trend strength indicators, such as ADX, to open positions only in strong trend markets, improving win rates.
-
Machine Learning Optimization: Use machine learning algorithms to dynamically adjust indicator weights, enhancing strategy adaptability.
-
Multi-timeframe Analysis: Combine longer-period indicators to confirm larger trends, improving accuracy of trading direction.
-
Risk Exposure Management: Set maximum allowable loss amounts and maximum position sizes to control overall risk.
Conclusion
The "Multi-Indicator High Leverage Short-Term Trading Strategy" is a high-frequency trading method that combines multiple technical indicators to capture market opportunities in the short term. Through the synergy of EMA, RSI, MACD, and ATR, this strategy can quickly identify trends and determine entry and exit points while using high leverage to amplify returns. Although the strategy has advantages such as quick response and high profit potential, it also faces challenges including high leverage risk and false breakout risk. To improve the stability and profitability of the strategy, improvements can be made in areas such as parameter optimization, adding filtering conditions, and dynamic risk management. Overall, this is a complex strategy suitable for experienced traders with high risk tolerance, requiring careful risk management and continuous optimization based on market changes in practical application.
[/trans]
Source (PineScript)
/*backtest
start: 2023-06-21 00:00:00
end: 2023-12-10 00:00:00
period: 1d
basePeriod: 1h
exchanges: [{"eid":"Futures_Binance","currency":"BTC_USDT"}]
*/

//@version=5
strategy("High Leverage Scalping Strategy", overlay=true)

// Parameters
shortEmaLength = input.int(5, minval=1, title="Short EMA Length")
longEmaLength = input.int(15, minval=1, title="Long EMA Length")
rsiLength = input.int(7, minval=1, title="RSI Length")
rsiOverbought = input.int(80, minval=50, maxval=100, title="RSI Overbought Level")
rsiOversold = input.int(20, minval=0, maxval=50, title="RSI Oversold Level")
macdFastLength = input.int(6, minval=1, title="MACD Fast Length")
macdSlowLength = input.int(13, minval=1, title="MACD Slow Length")
macdSignalSmoothing = input.int(5, minval=1, title="MACD Signal Smoothing")
atrLength = input.int(5, minval=1, title="ATR Length")
atrMultiplier = input.float(1.5, minval=0.1, title="ATR Multiplier")

// Indicators
shortEma = ta.ema(close, shortEmaLength)
longEma = ta.ema(close, longEmaLength)
rsi = ta.rsi(close, rsiLength)
[macdLine, signalLine, _] = ta.macd(close, macdFastLength, macdSlowLength, macdSignalSmoothing)
atr = ta.atr(atrLength)

// Conditions
longCondition = ta.crossover(shortEma, longEma) and rsi < rsiOverbought and macdLine > signalLine
shortCondition = ta.crossunder(shortEma, longEma) and rsi > rsiOversold and macdLine < signalLine

// Dynamic stop-loss and take-profit levels
longStopLoss = close - (atr * atrMultiplier)
longTakeProfit = close + (atr * atrMultiplier)
shortStopLoss = close + (atr * atrMultiplier)
shortTakeProfit = close - (atr * atrMultiplier)

// Long Entry
if (longCondition)
    strategy.entry("Long", strategy.long)
    strategy.exit("Take Profit/Stop Loss", from_entry="Long", limit=longTakeProfit, stop=longStopLoss)

// Short Entry
if (shortCondition)
    strategy.entry("Short", strategy.short)
    strategy.exit("Take Profit/Stop Loss", from_entry="Short", limit=shortTakeProfit, stop=shortStopLoss)

// Plotting
plot(shortEma, color=color.blue, title="Short EMA")
plot(longEma, color=color.red, title="Long EMA")
hline(rsiOverbought, "Overbought Level", color=color.red)
hline(rsiOversold, "Oversold Level", color=color.green)
plot(macdLine, color=color.green, title="MACD Line")
plot(signalLine, color=color.red, title="Signal Line")
plot(atr, color=color.purple, title="ATR")
Detail
https://www.fmz.com/strategy/454767
Last Modified
2024-06-21 18:16:24