
16 KiB
Name
多指标量化交易策略-7合1超级指标策略-Multi-Indicator-Quantitative-Trading-Strategy-Super-Indicator-7-in-1-Strategy
Author
ChaoZhang
Strategy Description
[trans]
概述
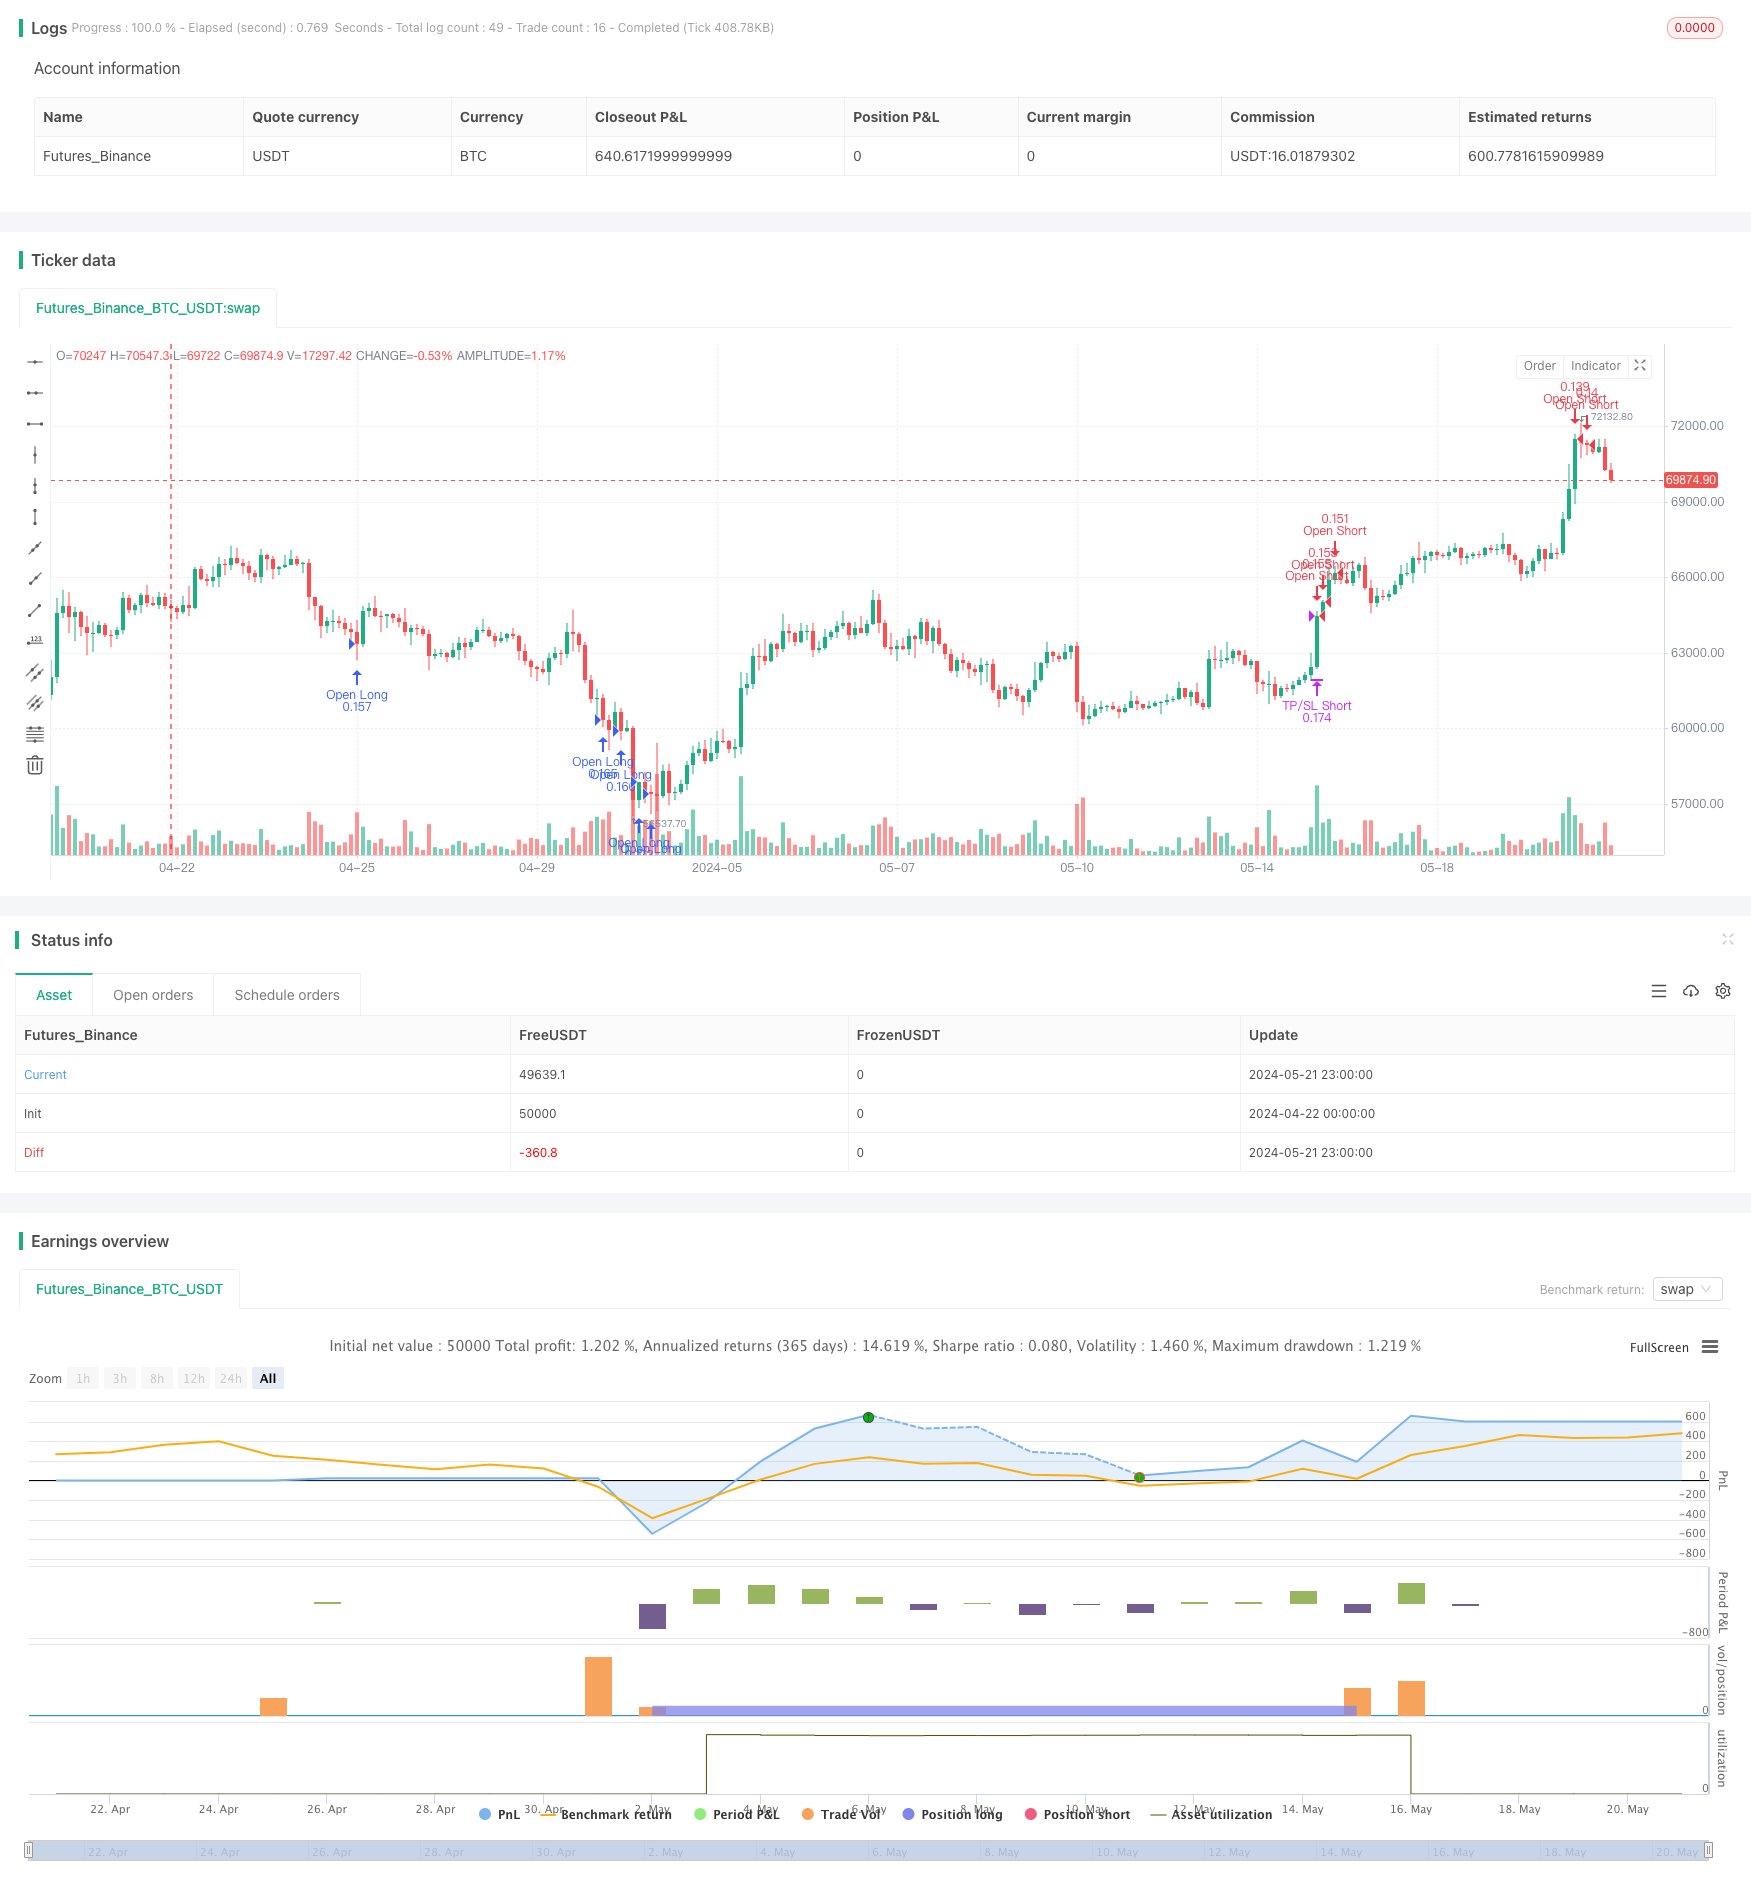
这个名为"7合1超级指标策略"的量化交易策略综合运用了7个流行的技术指标,包括相对强弱指数(RSI)、移动平均线收敛发散指标(MACD)、随机指标(Stochastic)、布林带(Bollinger Bands)、简单移动平均线(SMA)、指数移动平均线(EMA)和成交量(Volume)。通过将这些指标的信号整合在一起,该策略旨在识别市场的超买和超卖状态,从而找出最佳的买卖机会。策略还设置了止盈止损和基于时间的过滤器,以优化交易执行和风险管理。
策略原理
该策略的核心原理是综合运用多个技术指标,以获得更全面可靠的交易信号。每个指标都有其独特的计算方法和解释市场走势的角度。例如,RSI衡量价格变化的速度和强度;MACD基于移动平均线的交叉来判断趋势;随机指标通过比较收盘价与一定时期内的价格范围来确定超买超卖水平;布林带则根据价格的波动性来设定上下轨。
策略通过设定阈值,综合判断多个指标的信号强度。当指标达到某些组合条件时,就会产生买卖信号。同时,策略还会考虑成交量等其他市场信息,以确认价格走势。此外,策略纳入了止盈止损和交易时段过滤等风险管理和优化措施,以求在把握机会的同时控制风险。
优势分析
这个"7合1超级指标策略"的主要优势在于其全面性和灵活性。通过综合考虑多个指标,策略能够从不同角度验证市场信号,提高产生可靠交易机会的概率。即便有个别指标发出有误导性的信号,只要大多数指标指向一致,策略仍能作出正确判断。
此外,该策略还提供了丰富的参数选项,使用户能够根据自己的偏好和交易风格进行调整。不同的参数组合能够生成不同的信号灵敏度和频率,适应不同的市场状况。策略还内置了风险管理工具,如止盈止损和交易时段过滤,进一步提升了其实用性和可控性。
风险分析
尽管该策略有诸多优势,但也存在一些潜在风险。首先,策略的表现很大程度上取决于所选参数的合理性。不恰当的参数设置可能导致信号失真,从而产生错误的交易决策。其次,该策略主要基于历史数据和统计规律,而市场行情瞬息万变,过去的规律不一定适用于未来。
此外,在极端行情下,多个指标可能同时失效,导致策略作出错误判断。策略也可能在震荡市中频繁产生相互矛盾的信号,从而导致过度交易和资金快速耗损。
优化方向
为了进一步提升策略的稳健性和收益潜力,可以从以下几个方面进行优化:
- 对各项指标的参数进行更系统的回测和优化,找出最佳的参数组合。
- 引入更多非价格类指标,如情绪指标、基本面指标等,以扩宽策略的视角。
- 对止盈止损逻辑进行深化,设置动态的止盈止损比例,或采用移动止损等方式。
- 在交易时段过滤中加入对特定事件(如重要经济数据公布)的考量。
- 对策略产生的信号进行二次确认,如考虑多个时间框架下的指标表现。
通过这些优化,策略可望在保持优势的同时,进一步提高其应对复杂市场环境的能力,为用户带来更稳健的收益。
总结
总的来说,"7合1超级指标策略"是一个功能强大,设计全面的量化交易策略。它巧妙地结合了7个常用技术指标,能够从多个角度把握市场脉搏,为交易者提供可靠的买卖信号。丰富的参数选择和内置的风险管理工具,使得该策略灵活易用,适应性强。
不过,策略的表现仍然受到参数选择、市场环境等因素的影响,交易者需要根据自身经验和回测结果对其进行调优。通过引入更多指标维度、优化止盈止损逻辑、细化交易时段过滤等措施,该策略有望进一步提升其抗风险能力和盈利潜力,成为量化交易者的得力助手。
||
Overview
The "Super Indicator 7-in-1 Strategy" is a quantitative trading strategy that integrates seven popular technical indicators, including the Relative Strength Index (RSI), Moving Average Convergence Divergence (MACD), Stochastic Oscillator, Bollinger Bands, Simple Moving Average (SMA), Exponential Moving Average (EMA), and Volume. By combining the signals from these indicators, the strategy aims to identify overbought and oversold market conditions and pinpoint optimal buying and selling opportunities. The strategy also incorporates take profit, stop loss, and time-based filters to optimize trade execution and risk management.
Strategy Principles
The core principle of this strategy is to leverage multiple technical indicators to obtain more comprehensive and reliable trading signals. Each indicator has its unique calculation method and perspective on interpreting market trends. For example, RSI measures the speed and strength of price movements; MACD determines trends based on moving average crossovers; the Stochastic Oscillator assesses overbought and oversold levels by comparing the closing price to the price range over a certain period; and Bollinger Bands set upper and lower bounds based on price volatility.
The strategy generates buy and sell signals by setting thresholds and evaluating the combined strength of multiple indicator signals. When indicators reach certain combinations of conditions, it triggers a trading signal. The strategy also considers other market information, such as volume, to confirm price movements. Additionally, the strategy incorporates risk management and optimization measures, including take profit, stop loss, and trading session filters, to seize opportunities while controlling risks.
Advantage Analysis
The main advantages of the "Super Indicator 7-in-1 Strategy" lie in its comprehensiveness and flexibility. By considering multiple indicators, the strategy can validate market signals from different angles, increasing the probability of generating reliable trading opportunities. Even if individual indicators produce misleading signals, as long as most indicators align, the strategy can still make correct judgments.
Moreover, the strategy offers a wide range of parameter options, allowing users to customize settings according to their preferences and trading styles. Different parameter combinations can generate signals with varying sensitivity and frequency, adapting to different market conditions. The strategy also includes built-in risk management tools, such as take profit, stop loss, and trading session filters, further enhancing its practicality and controllability.
Risk Analysis
Despite its numerous advantages, the strategy also has some potential risks. First, the strategy's performance heavily depends on the reasonableness of the selected parameters. Inappropriate parameter settings can lead to signal distortions and incorrect trading decisions. Second, the strategy primarily relies on historical data and statistical patterns, while market conditions are ever-changing, and past patterns may not apply to the future.
Furthermore, under extreme market conditions, multiple indicators may simultaneously fail, causing the strategy to make erroneous judgments. The strategy may also generate conflicting signals in choppy markets, resulting in overtrading and rapid capital depletion.
Optimization Directions
To further enhance the strategy's robustness and profit potential, consider the following optimization aspects:
- Conduct more systematic backtesting and optimization of indicator parameters to identify the optimal combination.
- Introduce additional non-price indicators, such as sentiment and fundamental indicators, to broaden the strategy's perspective.
- Refine the take profit and stop loss logic by setting dynamic percentages or employing trailing stops.
- Incorporate considerations for specific events (e.g., significant economic data releases) into the trading session filter.
- Perform secondary confirmation of the signals generated by the strategy, such as evaluating indicator performance across multiple timeframes.
Through these optimizations, the strategy can maintain its advantages while further enhancing its ability to navigate complex market environments, delivering more consistent returns for users.
Summary
In summary, the "Super Indicator 7-in-1 Strategy" is a powerful and well-designed quantitative trading strategy. It cleverly combines seven commonly used technical indicators to grasp market dynamics from multiple angles and provide traders with reliable buy and sell signals. The rich parameter options and built-in risk management tools make the strategy flexible, user-friendly, and adaptable.
However, the strategy's performance is still influenced by factors such as parameter selection and market conditions. Traders need to fine-tune the strategy based on their own experience and backtesting results. By introducing more indicator dimensions, optimizing take profit and stop loss logic, and refining trading session filters, the strategy can further enhance its risk resilience and profit potential, becoming a valuable tool for quantitative traders. [/trans]
Source (PineScript)
/*backtest
start: 2024-04-22 00:00:00
end: 2024-05-22 00:00:00
period: 3h
basePeriod: 15m
exchanges: [{"eid":"Futures_Binance","currency":"BTC_USDT"}]
*/

//@version=5
strategy(title='Super Indicator 7 in 1', shorttitle='Super Indicator 7 in 1', overlay=true, initial_capital=100, pyramiding=0, default_qty_value=10000, default_qty_type=strategy.cash)

// Defining indicator parameters
show_plots = input(false, title="Show Plots", group="Visibility")
show_indicators = input(false, title="Show Indicators", group="Visibility")
show_trades = input(true, title="Show Trades", group="Visibility")
show_labels = input(false, title="Show Labels", group="Visibility")
start_hour = input.int(0, title="Start Hour (24h format)", group="Time-Based Filter", minval=0, maxval=24)
end_hour = input.int(24, title="End Hour (24h format)", group="Time-Based Filter", minval=0, maxval=24)
stop_trading = input(false, "Stop Trading", group="Time-Based Filter")
trade_time = (hour >= start_hour and hour <= end_hour)
bgcolor(trade_time and (start_hour != 0 or end_hour != 24) ? color.new(color.blue, 90) : na)

volume_length = input.int(1, title="Volume SMA Length", group="Volume", minval=1, step=1)
sma_period = input.int(50, title="SMA Period", group="Moving Averages")
ema_period = input.int(50, title="EMA Period", group="Moving Averages")
bb_length = input.int(20, title='Bollinger Bands Length', group="Bollinger Bands")
mult = input.float(2.0, title='Bollinger Bands MultFactor', group="Bollinger Bands")
src = input(close, title='Bollinger Bands Source', group="Bollinger Bands")
rsi_length = input.int(14, title='RSI Length', group="RSI")
macd_fast_length = input.int(12, title='MACD Fast Length', group="MACD")
macd_slow_length = input.int(26, title='MACD Slow Length', group="MACD")
macd_signal_length = input.int(9, title='MACD Signal Smoothing', group="MACD")
stoch_length = input.int(14, title='Stochastic Length', group="Stochastic")
smoothK = input.int(3, title='Stochastic %K Smoothing', group="Stochastic")
smoothD = input.int(3, title='Stochastic %D Smoothing', group="Stochastic")
tp_percent = input.float(0.14, title="Take Profit (%)", group="Trade Settings", minval=0.01, step=0.01) / 100
sl_percent = input.float(0.25, title="Stop Loss (%)", group="Trade Settings", minval=0.01, step=0.01) / 100

// Calculating indicators
dev = mult * ta.stdev(src, bb_length)
upper = ta.sma(src, bb_length) + dev
lower = ta.sma(src, bb_length) - dev
rsi_value = ta.rsi(close, rsi_length)
stoch_value = ta.stoch(close, high, low, stoch_length)
[macd_line, signal_line, _] = ta.macd(close, macd_fast_length, macd_slow_length, macd_signal_length)
k = ta.sma(stoch_value, smoothK)
d = ta.sma(k, smoothD)
sma = ta.sma(close, sma_period)
ema = ta.ema(close, ema_period)
volume_ma = ta.sma(volume, volume_length)
volume_condition = volume >= volume_ma

// Signal definitions(-10%, Normal, +10% and ! failed indicator)
min_buy_signal = rsi_value < 33 and rsi_value > 30 and stoch_value < 22 and stoch_value > 20 and low < lower and macd_line < 0 and volume_condition
min_sell_signal = rsi_value > 63 and rsi_value < 70 and stoch_value > 72 and stoch_value < 80 and high > upper and macd_line > 0 and volume_condition
buy_signal = rsi_value < 30 and stoch_value < 20 and low < lower and macd_line < 0 and volume_condition
sell_signal = rsi_value > 70 and stoch_value > 80 and high > upper and macd_line > 0 and volume_condition
max_buy_signal = rsi_value < 27 and stoch_value < 18 and low < lower and macd_line < 0 and volume_condition
max_sell_signal = rsi_value > 77 and stoch_value > 80 and high > upper and macd_line > 0 and volume_condition
buy_condition = (rsi_value < 30 ? 1 : 0) + (stoch_value < 20 ? 1 : 0) + (macd_line < 0 ? 1 : 0) + (low < lower ? 1 : 0) + (volume_condition ? 1 : 0) == 4
sell_condition = (rsi_value > 70 ? 1 : 0) + (stoch_value > 80 ? 1 : 0) + (macd_line > 0 ? 1 : 0) + (high > upper ? 1 : 0) + (volume_condition ? 1 : 0) == 4

// Plotting buy and sell signals
plotshape(show_plots and min_buy_signal, style=shape.triangleup, location=location.belowbar, color=#00ffb7, size=size.small, title="Min Buy Signal")
plotshape(show_plots and min_sell_signal, style=shape.triangledown, location=location.abovebar, color=#efa803, size=size.small, title="Min Sell Signal")
plotshape(show_plots and buy_signal and not max_buy_signal, style=shape.triangleup, location=location.belowbar, color=#004cff, size=size.small, title="Buy Signal")
plotshape(show_plots and sell_signal and not max_sell_signal, style=shape.triangledown, location=location.abovebar, color=#ffff00, size=size.small, title="Sell Signal")
plotshape(show_plots and max_buy_signal, style=shape.triangleup, location=location.belowbar, color=#1eff00, size=size.small, title="Max Buy Signal")
plotshape(show_plots and max_sell_signal, style=shape.triangledown, location=location.abovebar, color=#ff0000, size=size.small, title="Max Sell Signal")
plotshape(show_plots and buy_condition and not min_buy_signal and not buy_signal and not max_buy_signal, style=shape.triangleup, location=location.belowbar, color=#ffffff, size=size.small, title="Buy Condition")
plotshape(show_plots and sell_condition and not min_sell_signal and not sell_signal and not max_sell_signal, style=shape.triangledown, location=location.abovebar, color=#ffffff, size=size.small, title="Sell Condition")

// Plotting moving averages
plot(show_indicators ? sma : na, color=#fc0000, linewidth=2, title="SMA")
plot(show_indicators ? ema : na, color=#00aaff, linewidth=2, title="EMA")

// Crossover labels for moving averages
BullCross = ta.crossover(ema, sma)
BearCross = ta.crossunder(ema, sma)

if (show_labels)
    if (BullCross)
        label.new(bar_index, sma, color=color.green, textcolor=color.white, style=label.style_cross, size=size.huge)
    if (BearCross)
        label.new(bar_index, sma, color=color.red, textcolor=color.white, style=label.style_cross, size=size.huge)

// Calculating take profit and stop loss
long_take_profit = close * (1 + tp_percent)
long_stop_loss = close * (1 - sl_percent)
short_take_profit = close * (1 - tp_percent)
short_stop_loss = close * (1 + sl_percent)

// Opening long and short orders based on signals
if (show_trades and trade_time and not stop_trading)
    if (min_buy_signal or buy_signal or max_buy_signal or buy_condition)
        strategy.entry("Open Long", strategy.long)
        strategy.exit("TP/SL Long", limit=long_take_profit, stop=long_stop_loss)
    if (min_sell_signal or sell_signal or max_sell_signal or sell_condition)
        strategy.entry("Open Short", strategy.short)
        strategy.exit("TP/SL Short", limit=short_take_profit, stop=short_stop_loss)
Detail
https://www.fmz.com/strategy/452283
Last Modified
2024-05-23 18:20:25