
7.9 KiB
Name
多指标趋势跟随与动量结合的高级量化交易策略-Advanced-Multi-Indicator-Trend-Following-and-Momentum-Quantitative-Trading-Strategy
Author
ChaoZhang
Strategy Description
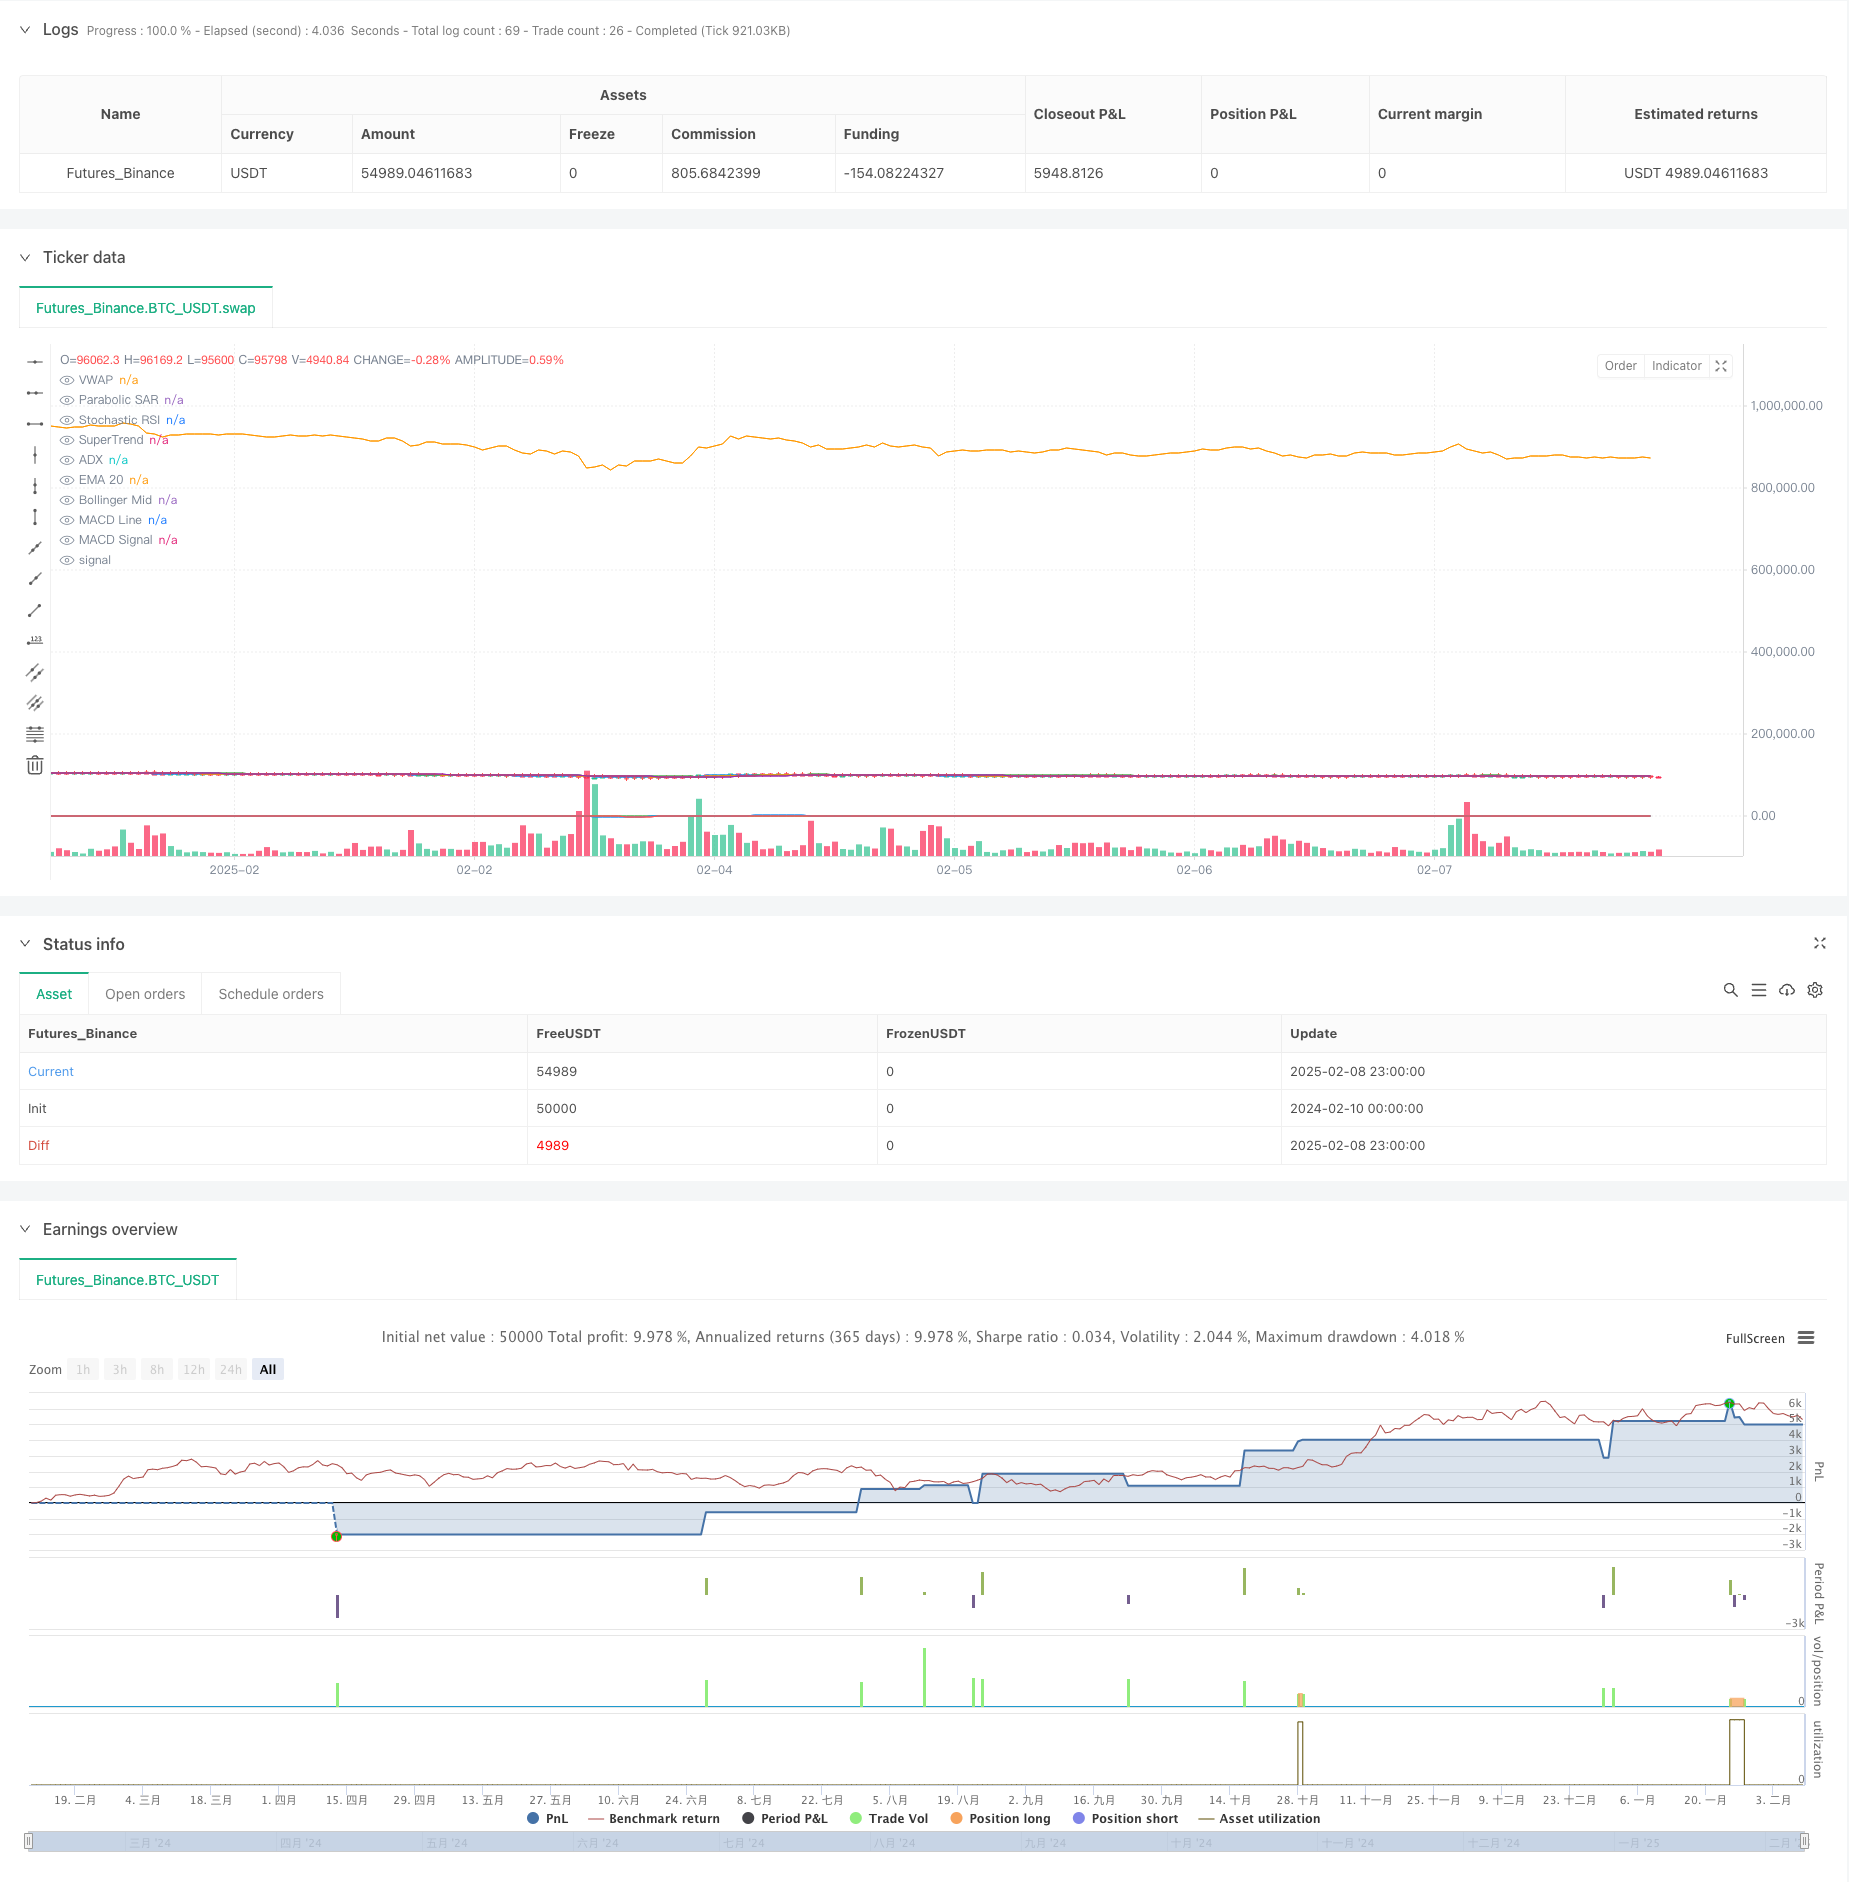
[trans]
概述
该策略是一个结合了多个技术指标的复杂量化交易系统,通过趋势跟随和动量分析相结合的方式进行交易。策略整合了成交量加权平均价(VWAP)、指数移动平均线(EMA)、相对强弱指标(RSI)等多个指标,构建了一个全面的交易决策框架。该策略主要关注市场趋势的确认和动量的持续性,同时采用严格的风险控制措施。
策略原理
策略采用多层过滤机制来确认交易信号。当价格位于VWAP和EMA20上方,且SuperTrend指标显示上升趋势时,系统开始寻找做多机会。同时结合RSI指标进行动量确认,使用布林带来识别波动性扩张。策略还整合了MACD指标来确认趋势的持续性,并使用ADX来衡量趋势强度。止损设置采用ATR的1.5倍,获利目标设为止损的1.5倍。
策略优势
- 多维度分析: 通过整合多个技术指标,提供了更全面的市场视角
- 风险控制完善: 使用ATR动态调整止损位置,能更好地适应市场波动
- 趋势确认可靠: 采用多重指标交叉验证,显著减少假突破
- 自适应性强: 止损和获利目标会根据市场波动性自动调整
- 策略逻辑严谨: 入场条件经过多重过滤,降低了错误信号的概率
策略风险
- 信号滞后: 多重确认机制可能导致入场时机略有延迟
- 震荡市场表现欠佳: 在横盘震荡市场中可能产生频繁的假信号
- 参数优化风险: 过多的指标可能导致过度优化
- 执行成本较高: 频繁交易可能带来较高的交易成本
- 市场环境依赖: 策略在不同市场周期的表现可能存在较大差异
策略优化方向
- 引入波动率过滤: 在低波动率环境下降低交易频率
- 优化指标权重: 对不同市场环境下各指标的重要性进行动态调整
- 加入成交量分析: 结合成交量变化来强化信号可靠性
- 开发智能止损: 根据市场结构动态调整止损位置
- 时间过滤: 在特定时间段增加入场条件的严格程度
总结
该策略通过综合运用多个技术指标,构建了一个较为完善的交易系统。虽然存在一定的滞后性和参数优化风险,但通过严格的风险控制和多重信号确认,策略展现出较好的稳定性和适应性。通过持续优化和改进,该策略有望在不同市场环境下都能保持稳定的表现。
||
Overview
This strategy is a sophisticated quantitative trading system that combines multiple technical indicators, integrating trend following and momentum analysis. The strategy incorporates various indicators including Volume Weighted Average Price (VWAP), Exponential Moving Average (EMA), Relative Strength Index (RSI), and others to create a comprehensive trading decision framework. It focuses on trend confirmation and momentum persistence while implementing strict risk control measures.
Strategy Principles
The strategy employs a multi-layer filtering mechanism to confirm trading signals. Buy signals are generated when price is above both VWAP and EMA20, and SuperTrend indicates an uptrend. It uses RSI for momentum confirmation and Bollinger Bands to identify volatility expansion. The strategy also integrates MACD for trend continuation confirmation and ADX to measure trend strength. Stop-loss is set at 1.5 times ATR, with profit targets at 1.5 times the stop-loss distance.
Strategy Advantages
- Multi-dimensional Analysis: Provides a more comprehensive market perspective by integrating multiple technical indicators
- Robust Risk Control: Uses ATR for dynamic stop-loss adjustment, better adapting to market volatility
- Reliable Trend Confirmation: Employs multiple indicator cross-validation to significantly reduce false breakouts
- Strong Adaptability: Stop-loss and profit targets automatically adjust based on market volatility
- Rigorous Strategy Logic: Entry conditions undergo multiple filters, reducing the probability of false signals
Strategy Risks
- Signal Lag: Multiple confirmation mechanisms may lead to slightly delayed entries
- Poor Performance in Ranging Markets: May generate frequent false signals in sideways markets
- Parameter Optimization Risk: Multiple indicators may lead to over-optimization
- High Execution Costs: Frequent trading may result in significant transaction costs
- Market Environment Dependency: Strategy performance may vary significantly across different market cycles
Strategy Optimization Directions
- Implement Volatility Filtering: Reduce trading frequency in low volatility environments
- Optimize Indicator Weights: Dynamically adjust the importance of different indicators based on market conditions
- Incorporate Volume Analysis: Strengthen signal reliability by integrating volume changes
- Develop Smart Stop-Loss: Dynamically adjust stop-loss positions based on market structure
- Time Filtering: Increase entry condition stringency during specific time periods
Summary
The strategy constructs a comprehensive trading system through the integrated use of multiple technical indicators. While it has certain inherent lag and parameter optimization risks, the strategy demonstrates good stability and adaptability through strict risk control and multiple signal confirmations. Through continuous optimization and improvement, the strategy shows promise in maintaining stable performance across various market environments. [/trans]
Source (PineScript)
/*backtest
start: 2024-02-10 00:00:00
end: 2025-02-09 00:00:00
period: 1h
basePeriod: 1h
exchanges: [{"eid":"Futures_Binance","currency":"BTC_USDT"}]
*/

//@version=5
strategy("Nifty 1-Min Advanced Scalping", overlay=true, default_qty_type=strategy.percent_of_equity, default_qty_value=200)

// Indicators
vwap = ta.vwap(close)
ema20 = ta.ema(close, 20)
supertrendFactor = 2
supertrendLength = 10
[superTrend, superTrendDirection] = ta.supertrend(supertrendFactor, supertrendLength)
atr = ta.atr(14)
psar = ta.sar(0.02, 0.2, 0.2)
rsi = ta.rsi(close, 14)
[bbMid, bbUpper, bbLower] = ta.bb(close, 20, 2)
[macdLine, macdSignal, _] = ta.macd(close, 12, 26, 9)
[adx, _, _] = ta.dmi(14, 14)
stochRsi = ta.stoch(close, 14, 3, 3)

// Buy Condition
buyCondition = close > vwap and close > ema20 and superTrendDirection == 1 and rsi > 50 and close > bbMid and close > psar and macdLine > macdSignal and adx > 25 and stochRsi > 20

// Sell Condition
sellCondition = close < vwap and close < ema20 and superTrendDirection == -1 and rsi < 50 and close < bbMid and close < psar and macdLine < macdSignal and adx > 25 and stochRsi < 80

// Stop Loss & Take Profit
sl = atr * 1.5
long_sl = close - sl
short_sl = close + sl
tp = sl * 1.5
long_tp = close + tp
short_tp = close - tp

// Execute Trades
if buyCondition
    strategy.entry("Long", strategy.long)
    strategy.exit("Long Exit", from_entry="Long", stop=long_sl, limit=long_tp)

if sellCondition
    strategy.entry("Short", strategy.short)
    strategy.exit("Short Exit", from_entry="Short", stop=short_sl, limit=short_tp)

// Plot indicators
plot(vwap, title="VWAP", color=color.blue)
plot(ema20, title="EMA 20", color=color.orange)
plot(superTrend, title="SuperTrend", color=color.green)
plot(psar, title="Parabolic SAR", color=color.red, style=plot.style_cross)
plot(bbMid, title="Bollinger Mid", color=color.purple)
plot(macdLine, title="MACD Line", color=color.blue)
plot(macdSignal, title="MACD Signal", color=color.red)
plot(adx, title="ADX", color=color.green)
plot(stochRsi, title="Stochastic RSI", color=color.orange)

// Alerts
alertcondition(buyCondition, title="Buy Signal", message="Buy Signal Triggered")
alertcondition(sellCondition, title="Sell Signal", message="Sell Signal Triggered")
Detail
https://www.fmz.com/strategy/481368
Last Modified
2025-02-10 15:13:07