
9.8 KiB
Name
多指标趋势跟踪与波动突破策略-Multi-Indicator-Trend-Following-and-Volatility-Breakout-Strategy
Author
ChaoZhang
Strategy Description
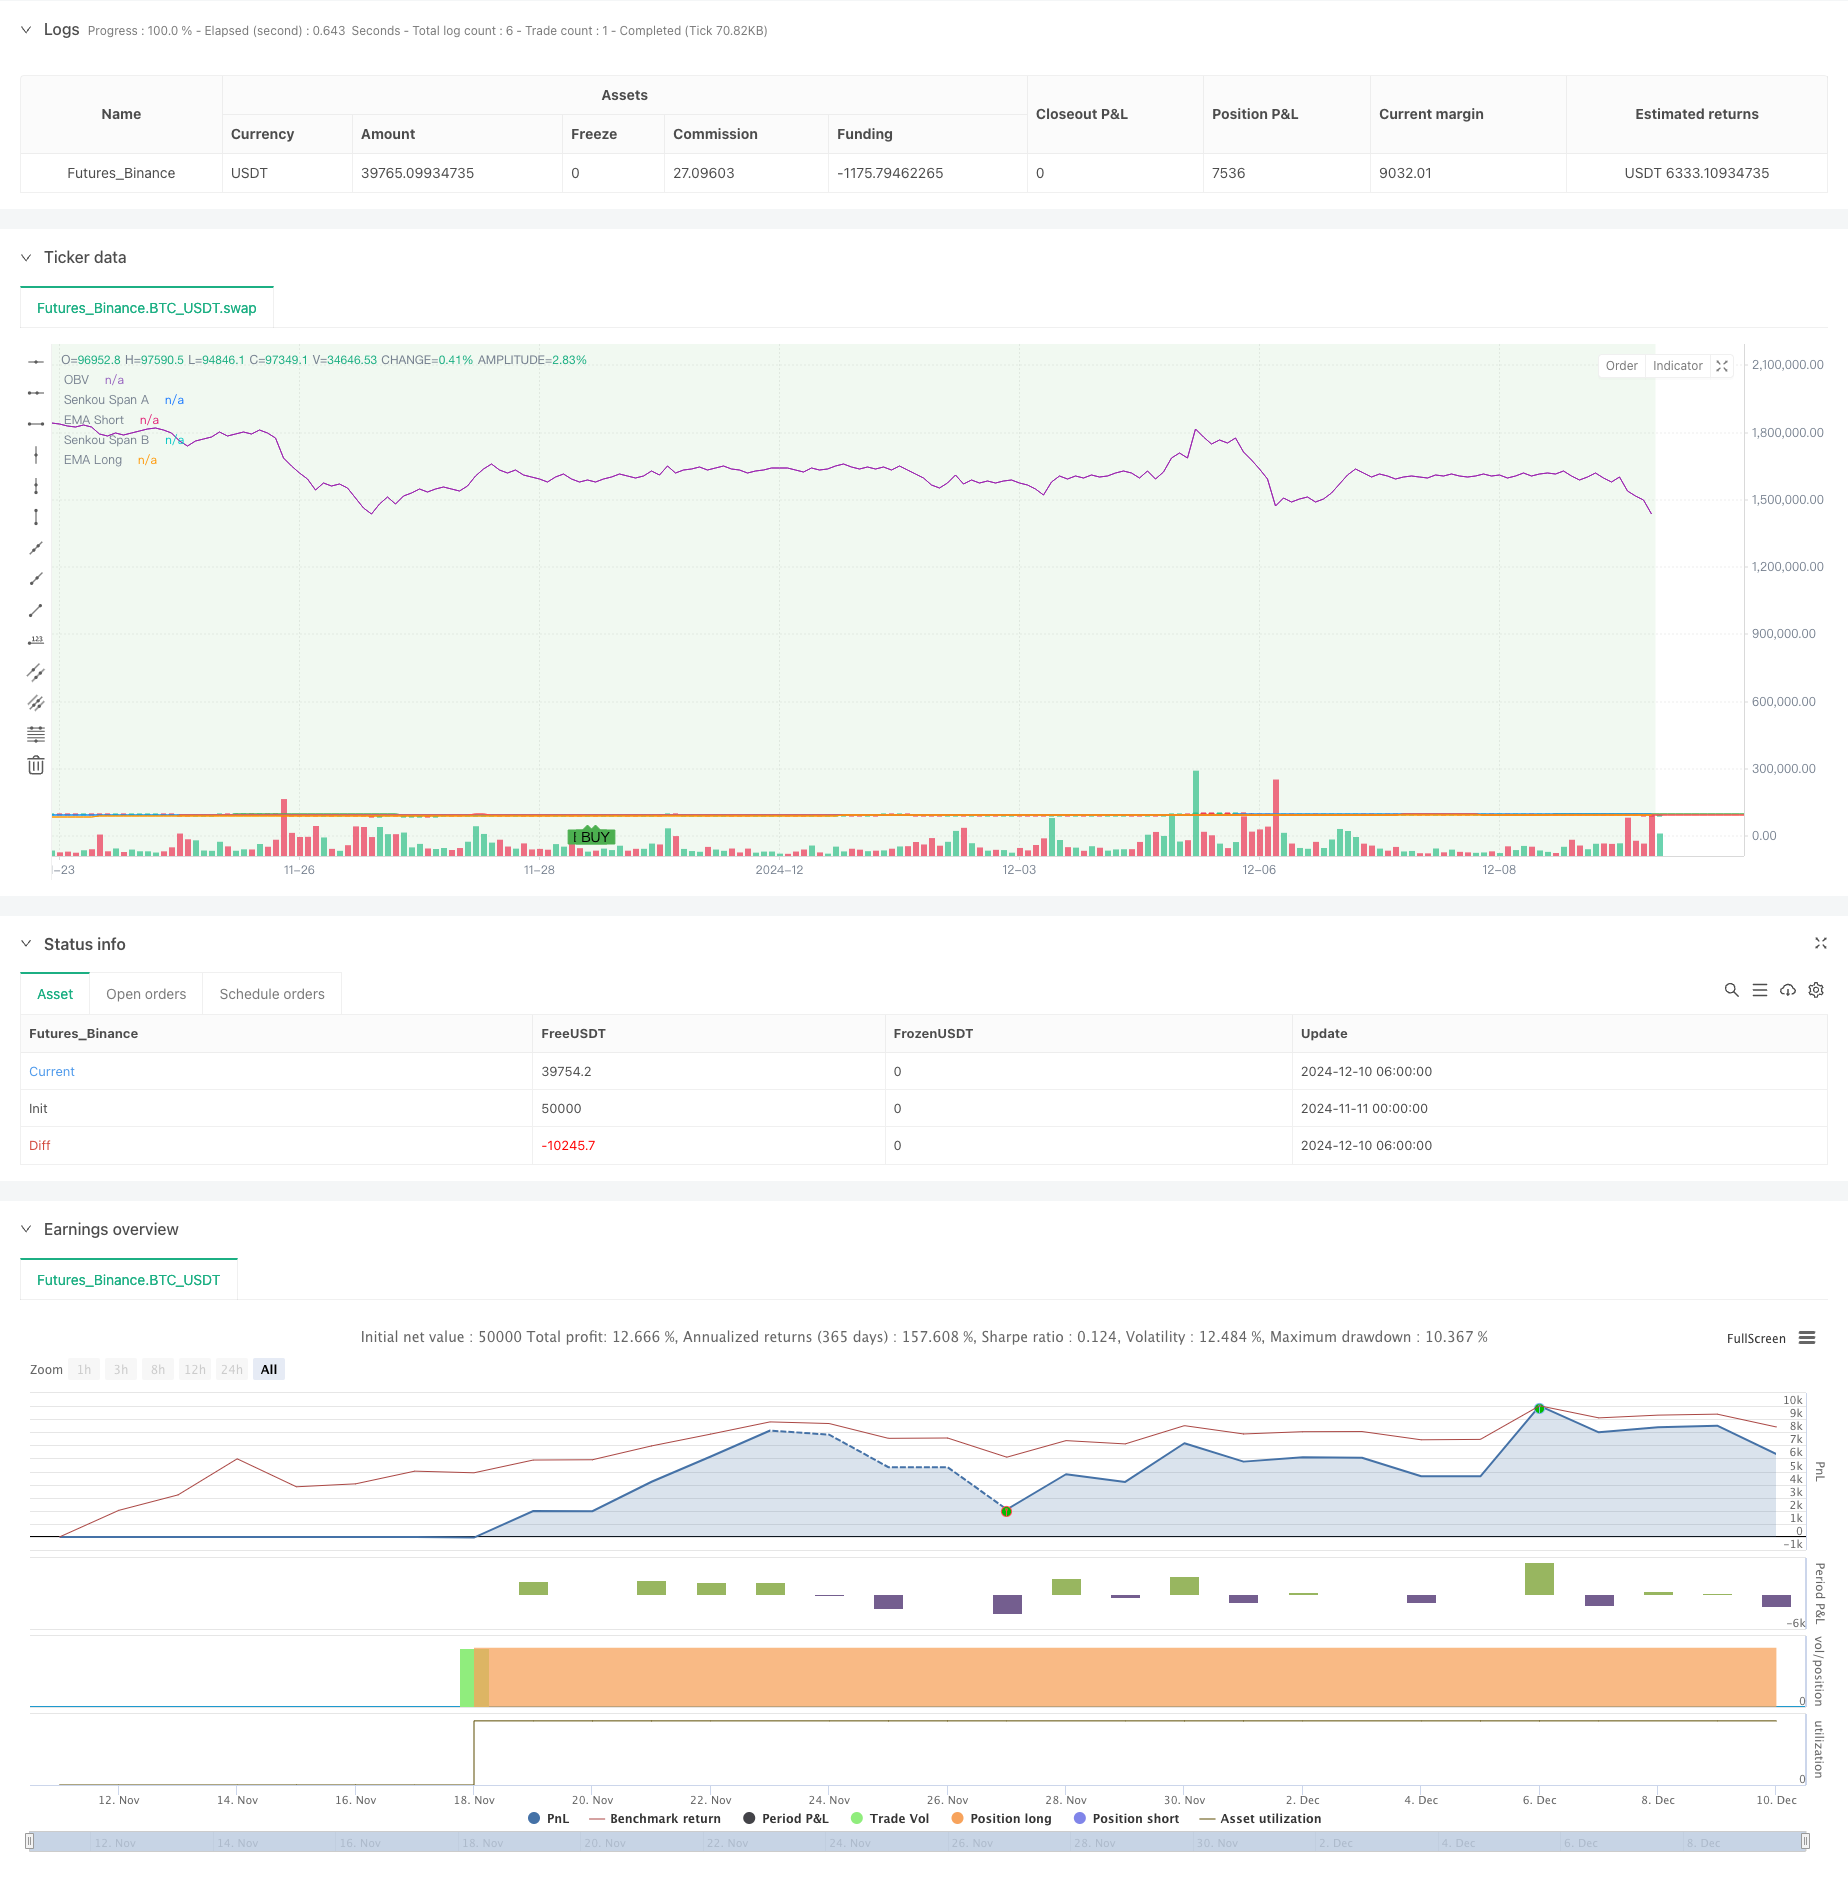
[trans]
概述
这是一个结合了多个技术指标的趋势跟踪与波动突破策略。该策略通过整合均线系统(EMA)、趋势强度指标(ADX)、市场波动指标(ATR)、量价分析(OBV)以及一些辅助指标如Ichimoku云图和随机指标(Stochastic)来捕捉市场趋势和突破机会。策略设置了严格的时间过滤器,仅在特定交易时段内运行,以提高交易效率。
策略原理
策略的核心逻辑基于多层技术指标的综合判断:
- 使用50周期和200周期EMA构建趋势跟踪系统
- 通过ADX指标确认趋势强度
- 利用Ichimoku云图提供额外的趋势确认
- 结合Stochastic指标识别超买超卖区域
- 使用ATR动态设置止损和获利目标
- 通过OBV验证成交量支持度
策略在满足以下条件时发出买入信号:
- 处于允许交易时间段内
- 价格位于短期EMA之上
- 短期EMA位于长期EMA之上
- ADX高于设定阈值
- 价格位于云图上方
- Stochastic指标处于超卖区域
策略优势
- 多层技术指标交叉验证,提高信号可靠性
- 结合趋势跟踪和波动突破,增加策略适应性
- 通过时间过滤器避免低效交易时段
- 动态止损和获利目标设置,适应市场波动
- 量价结合分析,提供更全面的市场视角
- 系统化的进出场规则,减少主观判断
策略风险
- 多指标系统可能导致信号滞后
- 在横盘市场中可能产生过多假信号
- 参数优化难度较大,过度优化风险高
- 交易时间限制可能错过重要行情
- 止损设置过大可能导致单笔损失较高
风险控制建议:
- 定期检查并优化参数设置
- 考虑加入波动率过滤器
- 实施更严格的资金管理规则
- 增加趋势确认的辅助指标
策略优化方向
- 引入自适应参数系统,根据市场状态动态调整指标参数
- 增加市场状态分类机制,在不同市场环境下使用不同的信号生成规则
- 优化时间过滤器设置,根据历史数据分析最佳交易时段
- 改进止损策略,考虑使用跟踪止损
- 加入市场情绪指标,提高信号质量
总结
该策略通过综合运用多个技术指标,构建了一个完整的交易系统。策略的优势在于多层指标交叉验证和严格的风险控制,但同时也面临参数优化和信号滞后等挑战。通过持续优化和改进,策略有望在不同市场环境下保持稳定表现。
||
Overview
This is a comprehensive trading strategy that combines trend following and volatility breakout approaches using multiple technical indicators. The strategy integrates an EMA system, ADX for trend strength, ATR for volatility measurement, OBV for volume analysis, and supplementary indicators like Ichimoku Cloud and Stochastic oscillator to capture market trends and breakout opportunities. A time filter is implemented to optimize trading efficiency by operating only during specific trading hours.
Strategy Principle
The core logic is based on multi-layer technical analysis:
- Trend following system using 50 and 200 period EMAs
- Trend strength confirmation through ADX
- Additional trend validation using Ichimoku Cloud
- Overbought/oversold identification with Stochastic oscillator
- Dynamic stop-loss and profit targets using ATR
- Volume confirmation through OBV
Buy signals are generated when:
- Within allowed trading hours
- Price above short-term EMA
- Short-term EMA above long-term EMA
- ADX above threshold
- Price above Ichimoku Cloud
- Stochastic in oversold territory
Strategy Advantages
- Multiple indicator cross-validation improves signal reliability
- Combination of trend following and volatility breakout increases adaptability
- Time filter avoids inefficient trading periods
- Dynamic stop-loss and profit targets adapt to market volatility
- Integrated volume-price analysis provides comprehensive market view
- Systematic entry/exit rules reduce subjective judgment
Strategy Risks
- Multiple indicators may lead to lagging signals
- False signals in ranging markets
- Complex parameter optimization with overfitting risks
- Time restrictions may miss important market moves
- Wide stops may result in larger individual losses
Risk control suggestions:
- Regular parameter optimization review
- Consider adding volatility filters
- Implement stricter money management rules
- Add supplementary trend confirmation indicators
Strategy Optimization Directions
- Introduce adaptive parameter system for dynamic indicator adjustment
- Add market regime classification for different signal generation rules
- Optimize time filter based on historical data analysis
- Improve stop-loss strategy with trailing stops
- Incorporate market sentiment indicators for signal quality enhancement
Summary
The strategy constructs a complete trading system through the comprehensive application of multiple technical indicators. Its strengths lie in multi-layer indicator cross-validation and strict risk control, while facing challenges in parameter optimization and signal lag. Through continuous optimization and improvement, the strategy shows potential for stable performance across different market conditions. [/trans]
Source (PineScript)
/*backtest
start: 2024-11-11 00:00:00
end: 2024-12-10 08:00:00
period: 2h
basePeriod: 2h
exchanges: [{"eid":"Futures_Binance","currency":"BTC_USDT"}]
*/

//@version=5
strategy("Khaleq Strategy Pro - Fixed Version", overlay=true)

// === Input Settings ===
ema_short = input.int(50, "EMA Short", minval=1)
ema_long = input.int(200, "EMA Long", minval=1)
adx_threshold = input.int(25, "ADX Threshold", minval=1)
atr_multiplier = input.float(2.0, "ATR Multiplier", minval=0.1)
time_filter_start = input(timestamp("0000-01-01 09:00:00"), "Trading Start Time", group="Time Filter")
time_filter_end = input(timestamp("0000-01-01 17:00:00"), "Trading End Time", group="Time Filter")

// === Ichimoku Settings ===
tenkan_len = 9
kijun_len = 26
senkou_span_b_len = 52
displacement = 26

// === Calculations ===
// Ichimoku Components
tenkan_sen = (ta.highest(high, tenkan_len) + ta.lowest(low, tenkan_len)) / 2
kijun_sen = (ta.highest(high, kijun_len) + ta.lowest(low, kijun_len)) / 2
senkou_span_a = (tenkan_sen + kijun_sen) / 2
senkou_span_b = (ta.highest(high, senkou_span_b_len) + ta.lowest(low, senkou_span_b_len)) / 2

// EMA Calculations
ema_short_val = ta.ema(close, ema_short)
ema_long_val = ta.ema(close, ema_long)

// Manual ADX Calculation
length = 14
dm_plus = math.max(ta.change(high), 0)
dm_minus = math.max(-ta.change(low), 0)
tr = math.max(high - low, math.max(math.abs(high - close[1]), math.abs(low - close[1])))
tr14 = ta.sma(tr, length)
dm_plus14 = ta.sma(dm_plus, length)
dm_minus14 = ta.sma(dm_minus, length)
di_plus = (dm_plus14 / tr14) * 100
di_minus = (dm_minus14 / tr14) * 100
dx = math.abs(di_plus - di_minus) / (di_plus + di_minus) * 100
adx_val = ta.sma(dx, length)

// ATR Calculation
atr_val = ta.atr(14)

// Stochastic RSI Calculation
k = ta.stoch(close, high, low, 14)
d = ta.sma(k, 3)

// Time Filter
is_within_time = true

// Support and Resistance (High and Low Levels)
resistance_level = ta.highest(high, 20)
support_level = ta.lowest(low, 20)

// Volume Analysis (On-Balance Volume)
vol_change = ta.change(close)
obv = ta.cum(vol_change > 0 ? volume : vol_change < 0 ? -volume : 0)

// === Signal Conditions ===
buy_signal = is_within_time and
             (close > ema_short_val) and
             (ema_short_val > ema_long_val) and
             (adx_val > adx_threshold) and
             (close > senkou_span_a) and
             (k < 20)  // Stochastic oversold

sell_signal = is_within_time and
              (close < ema_short_val) and
              (ema_short_val < ema_long_val) and
              (adx_val > adx_threshold) and
              (close < senkou_span_b) and
              (k > 80)  // Stochastic overbought

// === Plotting ===
// Plot Buy and Sell Signals
plotshape(buy_signal, color=color.green, style=shape.labelup, title="Buy Signal", location=location.belowbar, text="BUY")
plotshape(sell_signal, color=color.red, style=shape.labeldown, title="Sell Signal", location=location.abovebar, text="SELL")

// Plot EMAs
plot(ema_short_val, color=color.blue, title="EMA Short")
plot(ema_long_val, color=color.orange, title="EMA Long")

// Plot Ichimoku Components
plot(senkou_span_a, color=color.green, title="Senkou Span A", offset=displacement)
plot(senkou_span_b, color=color.red, title="Senkou Span B", offset=displacement)

// // Plot Support and Resistance using lines
// var line resistance_line = na
// var line support_line = na
// if bar_index > 1
//     line.delete(resistance_line)
//     line.delete(support_line)
// resistance_line := line.new(x1=bar_index - 1, y1=resistance_level, x2=bar_index, y2=resistance_level, color=color.red, width=1, style=line.style_dotted)
// support_line := line.new(x1=bar_index - 1, y1=support_level, x2=bar_index, y2=support_level, color=color.green, width=1, style=line.style_dotted)

// Plot OBV
plot(obv, color=color.purple, title="OBV")

// Plot Background for Trend (Bullish/Bearish)
bgcolor(close > ema_long_val ? color.new(color.green, 90) : color.new(color.red, 90), title="Trend Background")

// === Alerts ===
alertcondition(buy_signal, title="Buy Alert", message="Buy Signal Triggered")
alertcondition(sell_signal, title="Sell Alert", message="Sell Signal Triggered")

// === Strategy Execution ===
if buy_signal
    strategy.entry("Buy", strategy.long)

if sell_signal
    strategy.close("Buy")
    strategy.exit("Sell", "Buy", stop=close - atr_multiplier * atr_val, limit=close + atr_multiplier * atr_val)
Detail
https://www.fmz.com/strategy/474858
Last Modified
2024-12-12 15:48:29