
18 KiB
Name
多指标趋势突破动态止损量化交易策略-Multi-Indicator-Trend-Breakout-Strategy-with-Dynamic-Stop-Loss
Author
ianzeng123
Strategy Description
[trans]
概述
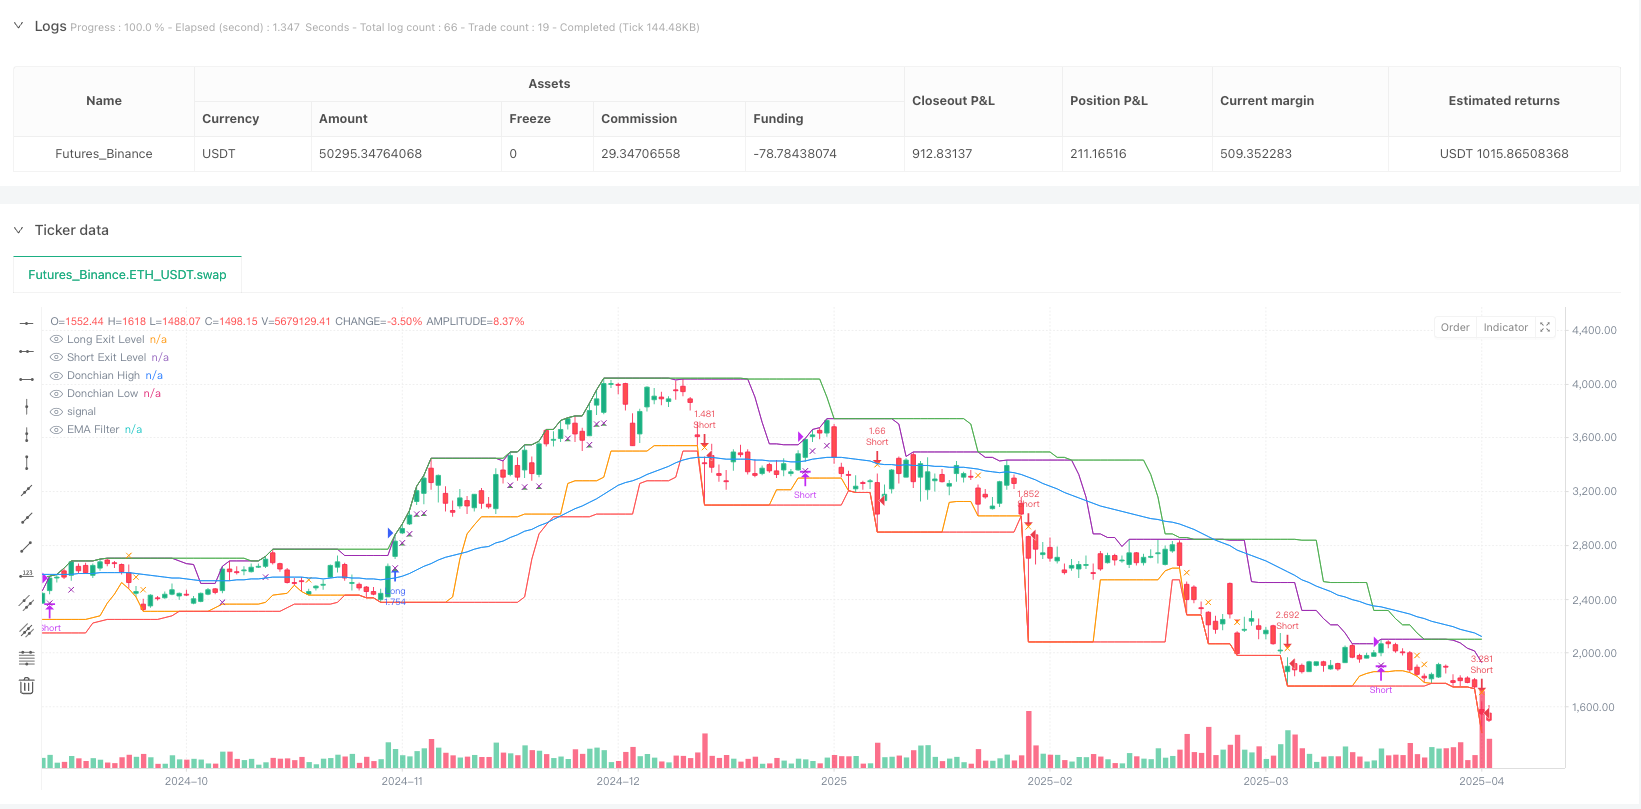
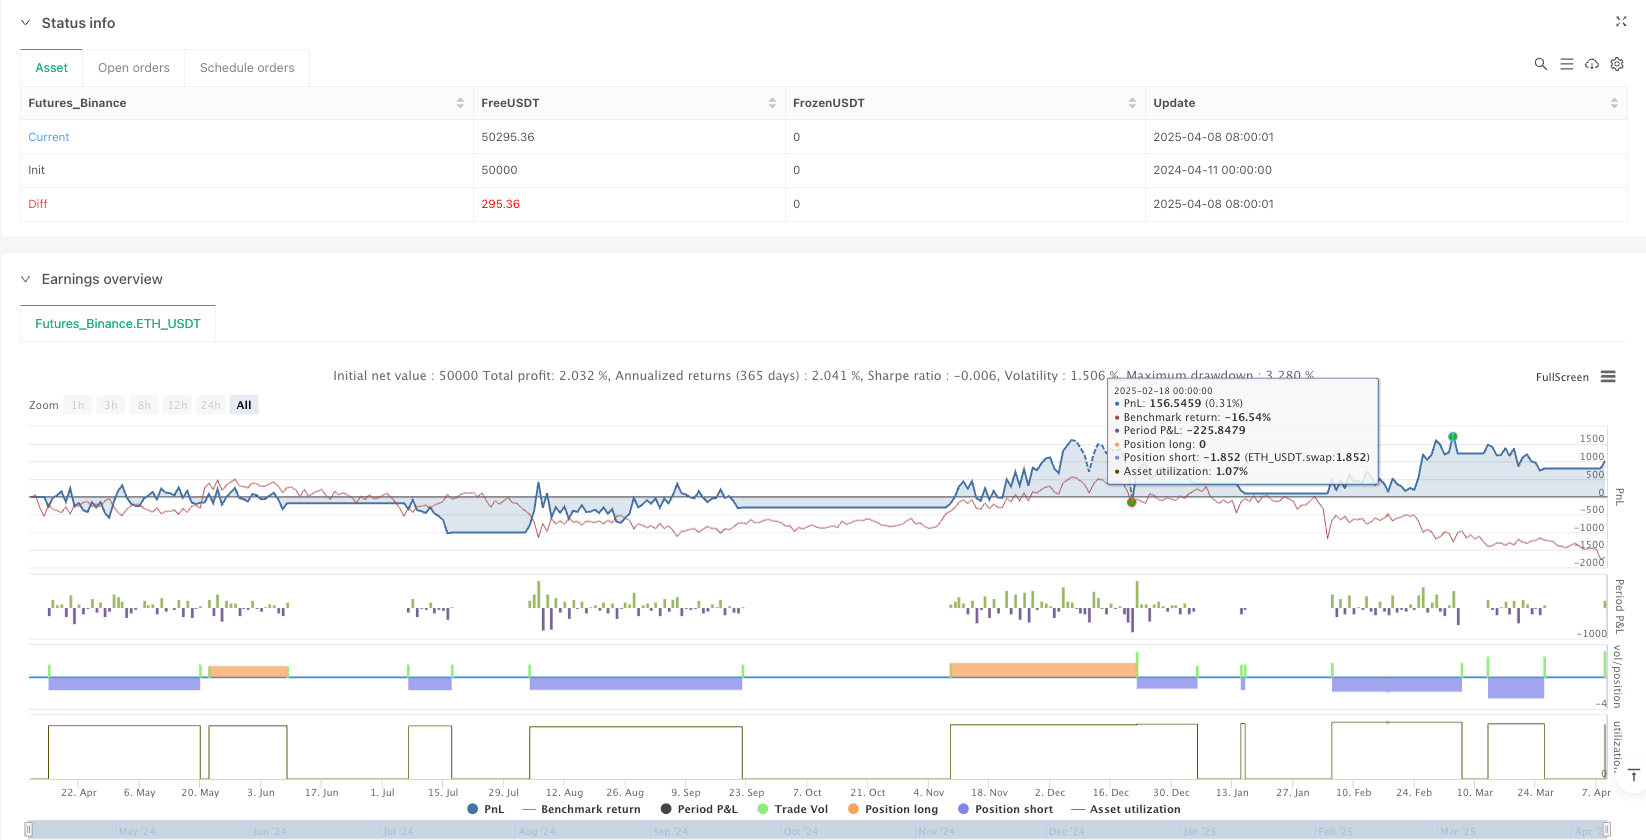
多指标趋势突破动态止损量化交易策略是一种基于唐奇安通道(Donchian Channel)突破原理的现代化交易系统,灵感来源于Curtis Faith的"海龟交易法则"(Way of the Turtle)。该策略经过特别优化,以适应全天候交易市场的高波动性和频繁虚假突破特点。系统整合了多重技术指标作为过滤条件,包括指数移动平均线(EMA)趋势确认、相对强弱指数(RSI)动量验证、自适应真实波幅(ATR)止损机制以及可选的波动率和交易量过滤器,从而构建了一个全面而灵活的交易框架。
策略原理
该策略核心原理是捕捉价格突破历史高低点后的趋势运动,同时应用多层过滤机制减少假突破和过早进场的风险。具体实现逻辑如下:
- 入场信号基于唐奇安通道(默认20周期)的突破,即当价格突破前20个周期的最高点时做多,突破最低点时做空。
- 趋势过滤使用50周期EMA,确保只在趋势方向做单 - 价格高于EMA时只做多,低于EMA时只做空。
- 动量确认通过14周期RSI实现,RSI大于50时确认多头动量,小于50时确认空头动量。
- 智能止损机制采用基于ATR的波动率动态调整,默认为1.5倍ATR距离,使止损随市场波动性自动调整。
- 出场策略结合唐奇安通道反向突破(10周期)和ATR止损双重保障,既保护利润又限制损失。
- 可选的波动率过滤器要求当前ATR高于其20周期SMA,以避免低波动区间交易。
- 可选的交易量过滤器要求当前交易量高于其20周期SMA,确保有足够的市场参与度。
策略执行时,系统会自动计算所有条件,仅在满足全部入场条件时开仓,并立即设置基于ATR的动态止损位。当价格触及反向通道或止损位时,策略自动平仓。
策略优势
深入分析该策略的代码结构和逻辑,可以总结出以下显著优势:
-
趋势适应性强: 通过唐奇安通道和EMA的组合,策略能够有效捕捉各种时间框架的趋势,并自动适应不同市场环境。
-
多层过滤机制: 整合EMA、RSI、波动率和交易量多维度过滤条件,显著减少假突破信号,提高交易质量。
-
智能风险管理: 基于ATR的动态止损机制使策略能够根据当前市场波动性自动调整止损距离,实现了风险与收益的智能平衡。
-
高度可配置性: 所有关键参数均可自定义,允许交易者根据不同市场条件和个人风险偏好灵活调整策略。
-
双重出场保障: 结合趋势反转信号(通道反向突破)和绝对止损位的双保险机制,既能有效锁定利润,又能严格控制风险。
-
适应性佣金模型: 内置现实的佣金计算(默认0.045%),确保回测结果更接近实际交易情况。
-
视觉化交易信号: 策略提供全面的图形指示,包括入场、出场信号和各种指标线,帮助交易者直观理解交易逻辑和市场状况。
策略风险
尽管该策略设计较为全面,仍存在以下潜在风险和限制:
-
区间震荡风险: 尽管有多重过滤机制,在长期横盘市场中,策略仍可能产生连续的小亏损交易。解决方法是增加波动率阈值或引入额外的市场结构判断指标。
-
参数敏感性: 不同参数组合对策略表现影响较大,特别是通道长度和EMA周期选择。建议通过历史数据回测寻找最优参数组合,并进行前向验证。
-
系统性风险暴露: 在市场剧烈波动或重大事件冲击下,价格可能跳空大幅超过止损位,导致实际损失超出预期。建议设置最大风险敞口,限制单笔交易资金比例。
-
滑点与流动性风险: 代码中未考虑滑点和流动性问题,实盘交易中,特别是在小市值资产上,可能面临执行价格偏差。建议增加滑点模拟并针对低流动性市场调整入场量。
-
优化过度风险: 过度优化参数可能导致策略仅适应历史数据而失去未来适应性。建议使用样本外测试和稳健性分析来验证参数的普适性。
策略优化方向
基于代码分析,以下是该策略可进一步优化的方向:
-
自适应参数调整: 引入自适应机制,根据市场状态(高/低波动期、趋势/震荡期)动态调整通道长度和过滤条件,提高策略在不同市场环境中的适应性。
-
多时间框架确认: 增加更高时间框架的趋势确认机制,确保交易方向与主要趋势一致,减少逆势交易风险。
-
动态仓位管理: 当前策略使用固定比例资金管理(10%),可优化为基于ATR的波动率调整仓位模型,在低波动期增加仓位,高波动期减少仓位,优化风险收益比。
-
进阶出场机制: 实现部分获利机制,如在达到一定盈利目标后分批平仓,既保证抓住大趋势,又能及时锁定部分利润。
-
市场状态分类: 引入市场状态判断机制(如波动率分析或趋势强度分析),在不同市场状态应用不同参数集,进一步减少震荡市的损失。
-
机器学习增强: 结合机器学习算法优化参数选择和入场时机判断,特别是利用模式识别技术减少假突破交易。
-
情绪指标整合: 引入交易量异常、价格波动异常等市场情绪指标,帮助识别潜在趋势转折点,提前调整持仓策略。
总结
多指标趋势突破动态止损量化交易策略是一个融合传统海龟交易法则与现代技术分析的全面交易系统。通过整合唐奇安通道突破、EMA趋势确认、RSI动量验证和ATR动态止损,该策略构建了一个既能捕捉主要趋势又能有效管理风险的交易框架。
策略最大优势在于其多层过滤机制和智能风险管理系统,显著提高了传统突破系统的可靠性。通过提供高度可配置的参数和清晰的进出场规则,该策略既适合经验丰富的交易者进行精细调整,也适合新手作为系统化交易的良好起点。
尽管任何交易策略都存在风险和局限性,但本策略提供的扎实框架和明确优化路径,为交易者在不同市场环境中构建可靠的量化交易系统提供了有力工具。通过持续优化和适应市场变化,该策略有潜力成为长期稳定盈利的交易系统。 ||
Overview
The Multi-Indicator Trend Breakout Strategy with Dynamic Stop-Loss is a modernized trading system based on Donchian Channel breakout principles, inspired by Curtis Faith's "Way of the Turtle." This strategy has been specifically optimized to adapt to the high volatility and frequent false breakouts characteristic of 24/7 trading markets. The system integrates multiple technical indicators as filtering conditions, including Exponential Moving Average (EMA) trend confirmation, Relative Strength Index (RSI) momentum verification, Adaptive True Range (ATR) stop-loss mechanism, and optional volatility and volume filters, creating a comprehensive and flexible trading framework.
Strategy Principles
The core principle of this strategy is to capture trending price movements after breakouts of historical high and low points, while applying multiple filtering mechanisms to reduce the risk of false breakouts and premature entries. The specific implementation logic is as follows:
- Entry signals are based on Donchian Channel breakouts (default 20 periods), going long when price breaks above the highest point of the previous 20 periods, and short when breaking below the lowest point.
- Trend filtering uses a 50-period EMA, ensuring trades only in the direction of the trend - only long positions when price is above the EMA, only short positions when below.
- Momentum confirmation is implemented through a 14-period RSI, confirming bullish momentum when RSI is greater than 50, and bearish momentum when less than 50.
- The intelligent stop-loss mechanism employs volatility-based dynamic adjustment using ATR, defaulting to a distance of 1.5 times ATR, allowing stop-losses to automatically adjust with market volatility.
- The exit strategy combines reverse breakouts of the Donchian Channel (10 periods) with ATR stop-losses for dual protection, both preserving profits and limiting losses.
- An optional volatility filter requires the current ATR to be above its 20-period SMA, avoiding trades in low volatility ranges.
- An optional volume filter requires the current volume to be above its 20-period SMA, ensuring sufficient market participation.
When executing the strategy, the system automatically calculates all conditions, only opening positions when all entry conditions are met, and immediately setting ATR-based dynamic stop-loss levels. The strategy automatically closes positions when the price reaches either the reverse channel or the stop-loss level.
Strategy Advantages
Through deep analysis of the strategy's code structure and logic, the following significant advantages can be summarized:
-
Strong Trend Adaptability: Through the combination of Donchian Channels and EMA, the strategy can effectively capture trends across various timeframes and automatically adapt to different market environments.
-
Multi-layer Filtering Mechanism: By integrating EMA, RSI, volatility, and volume as multi-dimensional filtering conditions, the strategy significantly reduces false breakout signals and improves trade quality.
-
Intelligent Risk Management: The ATR-based dynamic stop-loss mechanism allows the strategy to automatically adjust stop-loss distances according to current market volatility, achieving an intelligent balance between risk and reward.
-
High Configurability: All key parameters can be customized, allowing traders to flexibly adjust the strategy according to different market conditions and personal risk preferences.
-
Dual Exit Protection: The combination of trend reversal signals (channel reverse breakouts) and absolute stop-loss levels provides dual insurance, effectively locking in profits while strictly controlling risk.
-
Adaptive Commission Model: Built-in realistic commission calculation (default 0.045%) ensures backtesting results more closely approximate actual trading situations.
-
Visualized Trading Signals: The strategy provides comprehensive graphical indicators, including entry and exit signals and various indicator lines, helping traders intuitively understand trading logic and market conditions.
Strategy Risks
Despite the strategy's comprehensive design, the following potential risks and limitations exist:
-
Range-bound Market Risk: Despite multiple filtering mechanisms, in long-term sideways markets, the strategy may still produce consecutive small losing trades. The solution is to increase volatility thresholds or introduce additional market structure assessment indicators.
-
Parameter Sensitivity: Different parameter combinations significantly impact strategy performance, especially the selection of channel length and EMA periods. It is recommended to seek optimal parameter combinations through historical data backtesting and forward validation.
-
Systemic Risk Exposure: During severe market volatility or major event shocks, prices may gap significantly beyond stop-loss levels, causing actual losses to exceed expectations. It is recommended to set maximum risk exposure limits and restrict the percentage of funds per trade.
-
Slippage and Liquidity Risk: The code does not account for slippage and liquidity issues; in live trading, especially with small-cap assets, execution price deviations may occur. It is recommended to add slippage simulation and adjust entry volume for low-liquidity markets.
-
Overoptimization Risk: Excessive parameter optimization may cause the strategy to only adapt to historical data while losing future adaptability. Sample-out testing and robustness analysis are recommended to verify parameter universality.
Strategy Optimization Directions
Based on code analysis, the following are directions for further optimization of this strategy:
-
Adaptive Parameter Adjustment: Introduce adaptive mechanisms to dynamically adjust channel length and filtering conditions based on market state (high/low volatility periods, trending/ranging periods), improving the strategy's adaptability across different market environments.
-
Multi-timeframe Confirmation: Add trend confirmation mechanisms from higher timeframes to ensure trading direction aligns with the major trend, reducing counter-trend trading risk.
-
Dynamic Position Management: The current strategy uses fixed proportion fund management (10%) and could be optimized to an ATR-based volatility-adjusted position model, increasing positions during low volatility periods and decreasing during high volatility periods, optimizing the risk-reward ratio.
-
Advanced Exit Mechanisms: Implement partial profit-taking mechanisms, such as closing positions in batches when reaching certain profit targets, both capturing major trends and securing partial profits promptly.
-
Market State Classification: Introduce market state determination mechanisms (such as volatility analysis or trend strength analysis) to apply different parameter sets in different market states, further reducing losses in ranging markets.
-
Machine Learning Enhancement: Combine machine learning algorithms to optimize parameter selection and entry timing judgments, especially using pattern recognition technology to reduce false breakout trades.
-
Sentiment Indicator Integration: Introduce market sentiment indicators such as volume anomalies and price volatility anomalies to help identify potential trend turning points and adjust position strategies in advance.
Summary
The Multi-Indicator Trend Breakout Strategy with Dynamic Stop-Loss is a comprehensive trading system that fuses traditional Turtle Trading rules with modern technical analysis. By integrating Donchian Channel breakouts, EMA trend confirmation, RSI momentum verification, and ATR dynamic stop-losses, this strategy builds a trading framework that both captures major trends and effectively manages risk.
The strategy's greatest advantage lies in its multi-layer filtering mechanism and intelligent risk management system, significantly improving the reliability of traditional breakout systems. By providing highly configurable parameters and clear entry and exit rules, this strategy is suitable both for experienced traders making fine adjustments and for beginners as a good starting point for systematic trading.
Although all trading strategies have risks and limitations, the solid framework and clear optimization paths provided by this strategy offer traders a powerful tool for building reliable quantitative trading systems across different market environments. Through continuous optimization and adaptation to market changes, this strategy has the potential to become a long-term stable profitable trading system.[/trans]
Source (PineScript)
/*backtest
start: 2024-04-11 00:00:00
end: 2025-04-09 08:00:00
period: 1d
basePeriod: 1d
exchanges: [{"eid":"Futures_Binance","currency":"ETH_USDT"}]
*/

//@version=5
strategy("Donchian Breakout Strategy", overlay=true, default_qty_type=strategy.percent_of_equity, default_qty_value=10, commission_type=strategy.commission.percent, commission_value=0.045)

// === Inputs ===
entryLen = input.int(20, "Donchian Entry Length", minval=1)
exitLen = input.int(10, "Donchian Exit Length", minval=1)
atrLength = input.int(14, "ATR Length", minval=1)
atrMult = input.float(1.5, "ATR Stop Multiplier", minval=0.1)
emaLen = input.int(50, "EMA Trend Filter Length")

useLongs = input.bool(true, "Enable Longs")
useShorts = input.bool(true, "Enable Shorts")
useVolatilityFilter = input.bool(true, "Use Volatility Filter (ATR must be above SMA of ATR)")
useVolumeFilter = input.bool(false, "Use Volume Filter (Volume above SMA)")

volSmaLen = input.int(20, "Volume SMA Length")
volatilitySmaLen = input.int(20, "ATR SMA Length")

// === Time Filter for Backtest ===
startDate = timestamp("2025-01-01 00:00 +0000")
if (time < startDate)
    strategy.cancel_all()

// === Indicators ===
highestHigh = ta.highest(high, entryLen)
lowestLow = ta.lowest(low, entryLen)
exitLong = ta.lowest(low, exitLen)
exitShort = ta.highest(high, exitLen)

atr = ta.atr(atrLength)
atrSMA = ta.sma(atr, volatilitySmaLen)
volatilityPass = not useVolatilityFilter or (atr > atrSMA)

volSMA = ta.sma(volume, volSmaLen)
volumePass = not useVolumeFilter or (volume > volSMA)

ema = ta.ema(close, emaLen)

// === Entry Conditions ===
longCondition = useLongs and close > highestHigh[1] and close > ema and ta.rsi(close, 14) > 50 and volatilityPass and volumePass
shortCondition = useShorts and close < lowestLow[1] and close < ema and ta.rsi(close, 14) < 50 and volatilityPass and volumePass

// === Exit Conditions ===
longExit = close < exitLong[1]
shortExit = close > exitShort[1]

// === ATR-Based Stop Loss ===
longStop = close - atr * atrMult
shortStop = close + atr * atrMult

// === Entry Execution ===
if (longCondition)
    strategy.entry("Long", strategy.long)
    strategy.exit("Long Exit", from_entry="Long", stop=longStop)

if (shortCondition)
    strategy.entry("Short", strategy.short)
    strategy.exit("Short Exit", from_entry="Short", stop=shortStop)

// === Exit Execution ===
if (strategy.position_size > 0 and longExit)
    strategy.close("Long")

if (strategy.position_size < 0 and shortExit)
    strategy.close("Short")

// === Plotting ===
plot(highestHigh, title="Donchian High", color=color.green)
plot(lowestLow, title="Donchian Low", color=color.red)
plot(exitLong, title="Long Exit Level", color=color.orange)
plot(exitShort, title="Short Exit Level", color=color.purple)
plot(ema, title="EMA Filter", color=color.blue)

// === Visual Debug ===
plotshape(longCondition, title="Long Entry", location=location.belowbar, color=color.green, style=shape.triangleup, size=size.small)
plotshape(shortCondition, title="Short Entry", location=location.abovebar, color=color.red, style=shape.triangledown, size=size.small)
plotshape(longExit, title="Long Exit", location=location.abovebar, color=color.orange, style=shape.xcross, size=size.tiny)
plotshape(shortExit, title="Short Exit", location=location.belowbar, color=color.purple, style=shape.xcross, size=size.tiny)
Detail
https://www.fmz.com/strategy/490057
Last Modified
2025-04-11 11:01:00