
7.8 KiB
Name
多指标趋势动量交易策略基于布林带斐波那契和ATR的优化量化交易系统-Multi-Indicator-Trend-Momentum-Trading-Strategy-An-Optimized-Quantitative-Trading-System-Based-on-Bollinger-Bands-Fibonacci-and-ATR
Author
ChaoZhang
Strategy Description
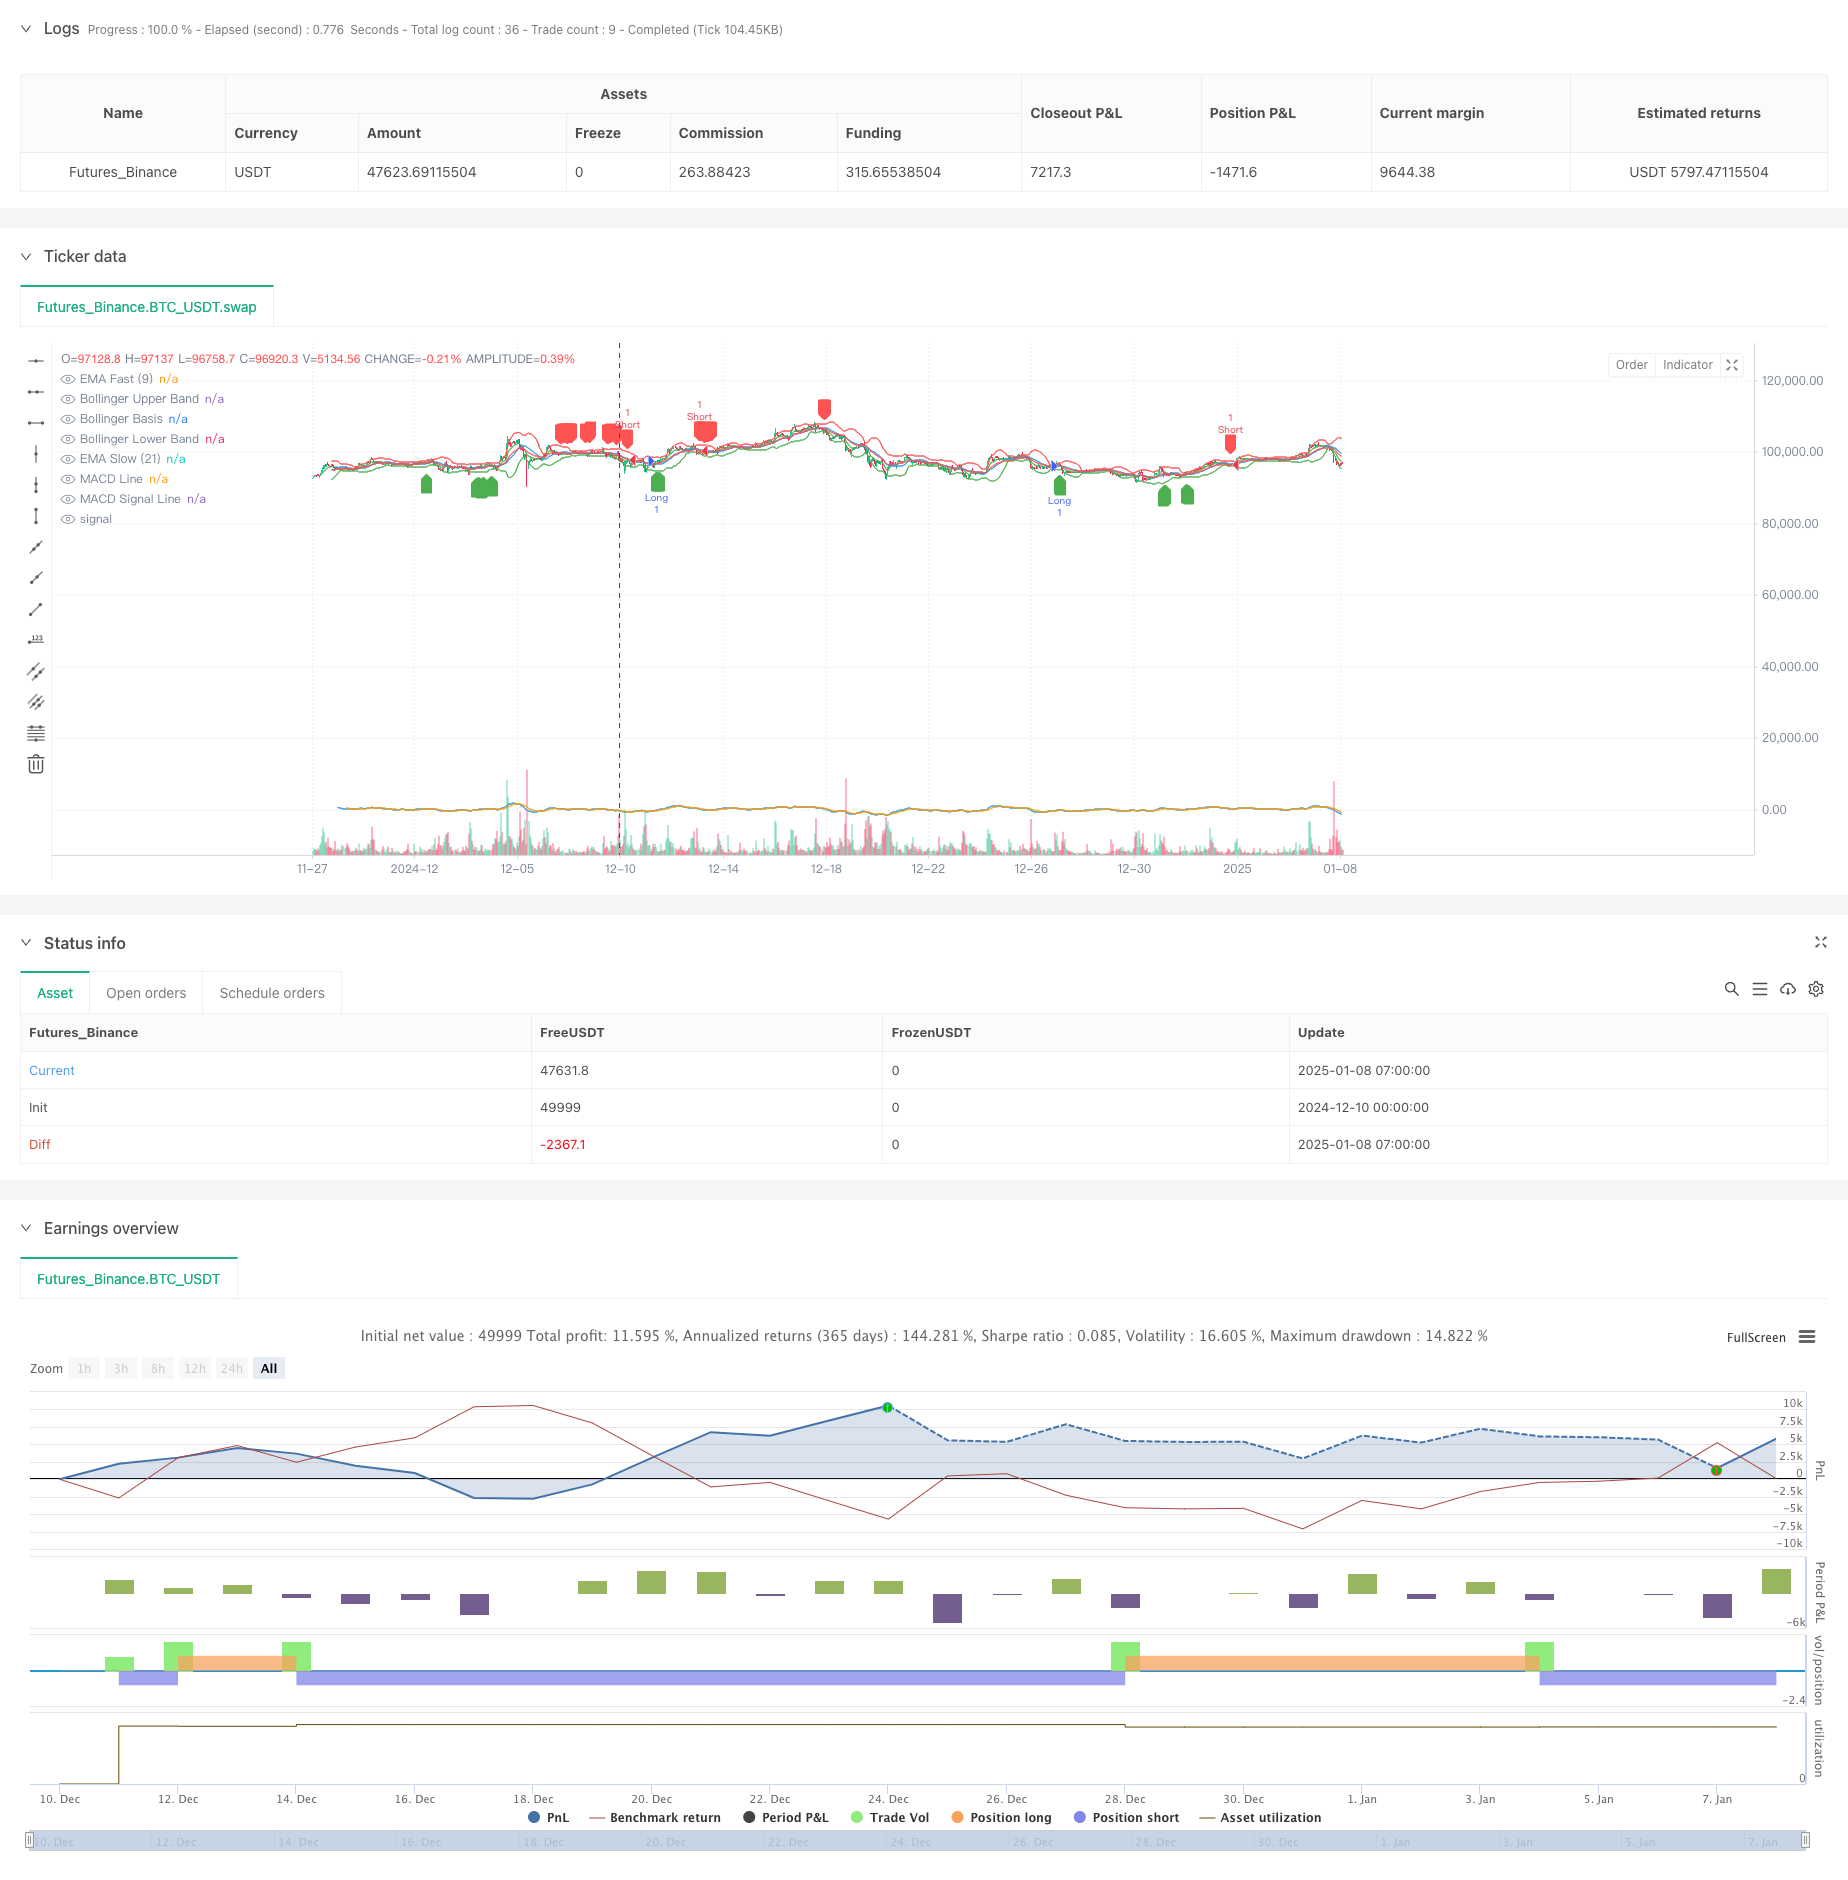
[trans]
概述
该策略是一个多维度的技术分析交易系统,结合了动量指标(RSI、MACD)、趋势指标(EMA)、波动率指标(布林带、ATR)以及价格结构指标(斐波那契回调),通过多维度信号的协同配合来捕捉市场机会。策略设计以15分钟时间周期为基准,采用ATR动态止损止盈,具有较强的风险控制能力。
策略原理
策略的核心逻辑包括以下几个维度:
- 趋势确认:使用9/21周期EMA交叉判断趋势方向
- 动量验证:结合RSI超卖超买(55/45)以及MACD柱状图来验证动量
- 波动率参考:通过布林带(20周期,2倍标准差)来衡量价格波动
- 支撑阻力:利用100周期高低点计算的斐波那契0.382/0.618/0.786水平
- 风险管理:基于14周期ATR的1.5倍止损和3倍止盈
多个维度信号协同触发后才进行交易,提高了交易的准确性。
策略优势
- 多维度信号交叉验证,显著降低虚假信号
- 动态的ATR止损止盈,适应不同市场环境
- 结合经典技术指标,易于理解和维护
- 精确的入场时机选择,提高胜率
- 风险收益比为1:2,符合专业交易标准
- 适合波动剧烈的市场环境
策略风险
- 参数优化可能导致过度拟合
- 多重信号条件可能错过部分行情
- 固定倍数止损可能在极端行情下失效
- 对计算资源要求较高
- 交易成本可能影响策略表现
策略优化方向
- 引入成交量因素验证信号强度
- 动态调整RSI阈值以适应不同市场
- 增加趋势强度过滤器
- 优化止损止盈倍数
- 加入时间过滤避免震荡市
- 考虑引入机器学习动态优化参数
总结
该策略通过多维度技术指标的协同配合,构建了一个稳健的交易系统。其核心优势在于信号的交叉验证和动态风险控制,但也需要注意参数优化和市场环境适应性的问题。后续优化方向主要集中在动态参数调整和信号质量提升上。 ||
Overview
This strategy is a multi-dimensional technical analysis trading system that combines momentum indicators (RSI, MACD), trend indicators (EMA), volatility indicators (Bollinger Bands, ATR), and price structure indicators (Fibonacci retracements) to capture market opportunities through multi-dimensional signal coordination. The strategy is optimized for 15-minute timeframes and employs ATR-based dynamic stop-loss and take-profit levels, demonstrating strong risk control capabilities.
Strategy Principles
The core logic includes the following dimensions:
- Trend Confirmation: Using 9/21 period EMA crossovers to determine trend direction
- Momentum Verification: Combining RSI overbought/oversold (55/45) and MACD histogram for momentum validation
- Volatility Reference: Using Bollinger Bands (20 periods, 2 standard deviations) to measure price volatility
- Support/Resistance: Fibonacci 0.382/0.618/0.786 levels calculated from 100-period high/low
- Risk Management: 1.5x ATR stop-loss and 3x ATR take-profit based on 14-period ATR
Trading occurs only when multiple dimensional signals align, improving trading accuracy.
Strategy Advantages
- Multi-dimensional signal cross-validation reduces false signals
- Dynamic ATR-based stop-loss and take-profit adapts to different market conditions
- Integration of classic technical indicators makes it easy to understand and maintain
- Precise entry timing improves win rate
- Risk-reward ratio of 1:2 meets professional trading standards
- Suitable for highly volatile market environments
Strategy Risks
- Parameter optimization may lead to overfitting
- Multiple signal conditions might miss some market moves
- Fixed multiplier stops may fail in extreme market conditions
- High computational resource requirements
- Trading costs may impact strategy performance
Strategy Optimization Directions
- Introduce volume factors to verify signal strength
- Dynamically adjust RSI thresholds for different markets
- Add trend strength filters
- Optimize stop-loss and take-profit multipliers
- Add time filters to avoid ranging markets
- Consider implementing machine learning for dynamic parameter optimization
Summary
This strategy builds a robust trading system through the coordination of multi-dimensional technical indicators. Its core advantages lie in signal cross-validation and dynamic risk control, but attention must be paid to parameter optimization and market environment adaptability. Future optimization should focus on dynamic parameter adjustment and signal quality improvement.[/trans]
Source (PineScript)
/*backtest
start: 2024-12-10 00:00:00
end: 2025-01-08 08:00:00
period: 1h
basePeriod: 1h
exchanges: [{"eid":"Futures_Binance","currency":"BTC_USDT","balance":49999}]
*/

//@version=5
strategy("Optimized Advanced Strategy", overlay=true)

// Bollinger Bandı
length = input(20, title="Bollinger Band Length")
src = close
mult = input.float(2.0, title="Bollinger Band Multiplier")
basis = ta.sma(src, length)
dev = mult * ta.stdev(src, length)
upper = basis + dev
lower = basis - dev

// RSI
rsi = ta.rsi(close, 14)

// MACD
[macdLine, signalLine, _] = ta.macd(close, 12, 26, 9)

// EMA
emaFast = ta.ema(close, 9)
emaSlow = ta.ema(close, 21)

// ATR
atr = ta.atr(14)

// Fibonacci Seviyeleri
lookback = input(100, title="Fibonacci Lookback Period")
highPrice = ta.highest(high, lookback)
lowPrice = ta.lowest(low, lookback)
fiboLevel618 = lowPrice + (highPrice - lowPrice) * 0.618
fiboLevel382 = lowPrice + (highPrice - lowPrice) * 0.382
fiboLevel786 = lowPrice + (highPrice - lowPrice) * 0.786

// Kullanıcı Ayarlı Stop-Loss ve Take-Profit
stopLossATR = atr * 1.5
takeProfitATR = atr * 3

// İşlem Koşulları
longCondition = (rsi < 55) and (macdLine > signalLine) and (emaFast > emaSlow) and (close >= fiboLevel382 and close <= fiboLevel618)
shortCondition = (rsi > 45) and (macdLine < signalLine) and (emaFast < emaSlow) and (close >= fiboLevel618 and close <= fiboLevel786)

// İşlem Girişleri
if (longCondition)
    strategy.entry("Long", strategy.long, stop=close - stopLossATR, limit=close + takeProfitATR, comment="LONG SIGNAL")

if (shortCondition)
    strategy.entry("Short", strategy.short, stop=close + stopLossATR, limit=close - takeProfitATR, comment="SHORT SIGNAL")

// Bollinger Bandını Çizdir
plot(upper, color=color.red, title="Bollinger Upper Band")
plot(basis, color=color.blue, title="Bollinger Basis")
plot(lower, color=color.green, title="Bollinger Lower Band")

// Fibonacci Seviyelerini Çizdir
// line.new(x1=bar_index[1], y1=fiboLevel382, x2=bar_index, y2=fiboLevel382, color=color.blue, width=1, style=line.style_dotted)
// line.new(x1=bar_index[1], y1=fiboLevel618, x2=bar_index, y2=fiboLevel618, color=color.orange, width=1, style=line.style_dotted)
// line.new(x1=bar_index[1], y1=fiboLevel786, x2=bar_index, y2=fiboLevel786, color=color.purple, width=1, style=line.style_dotted)

// Göstergeleri Görselleştir
plot(macdLine, color=color.blue, title="MACD Line")
plot(signalLine, color=color.orange, title="MACD Signal Line")
plot(emaFast, color=color.green, title="EMA Fast (9)")
plot(emaSlow, color=color.red, title="EMA Slow (21)")

// İşlem İşaretleri
plotshape(series=longCondition, location=location.belowbar, color=color.green, style=shape.labelup, title="Long Entry")
plotshape(series=shortCondition, location=location.abovebar, color=color.red, style=shape.labeldown, title="Short Entry")
Detail
https://www.fmz.com/strategy/477972
Last Modified
2025-01-10 16:22:55