
18 KiB
Name
多指标融合自动化交易系统SuperTrend-ATR-RSI动态风控策略-Multi-Indicator-Fusion-Automated-Trading-System-SuperTrend-ATR-RSI-Dynamic-Risk-Control-Strategy
Author
ianzeng123
Strategy Description
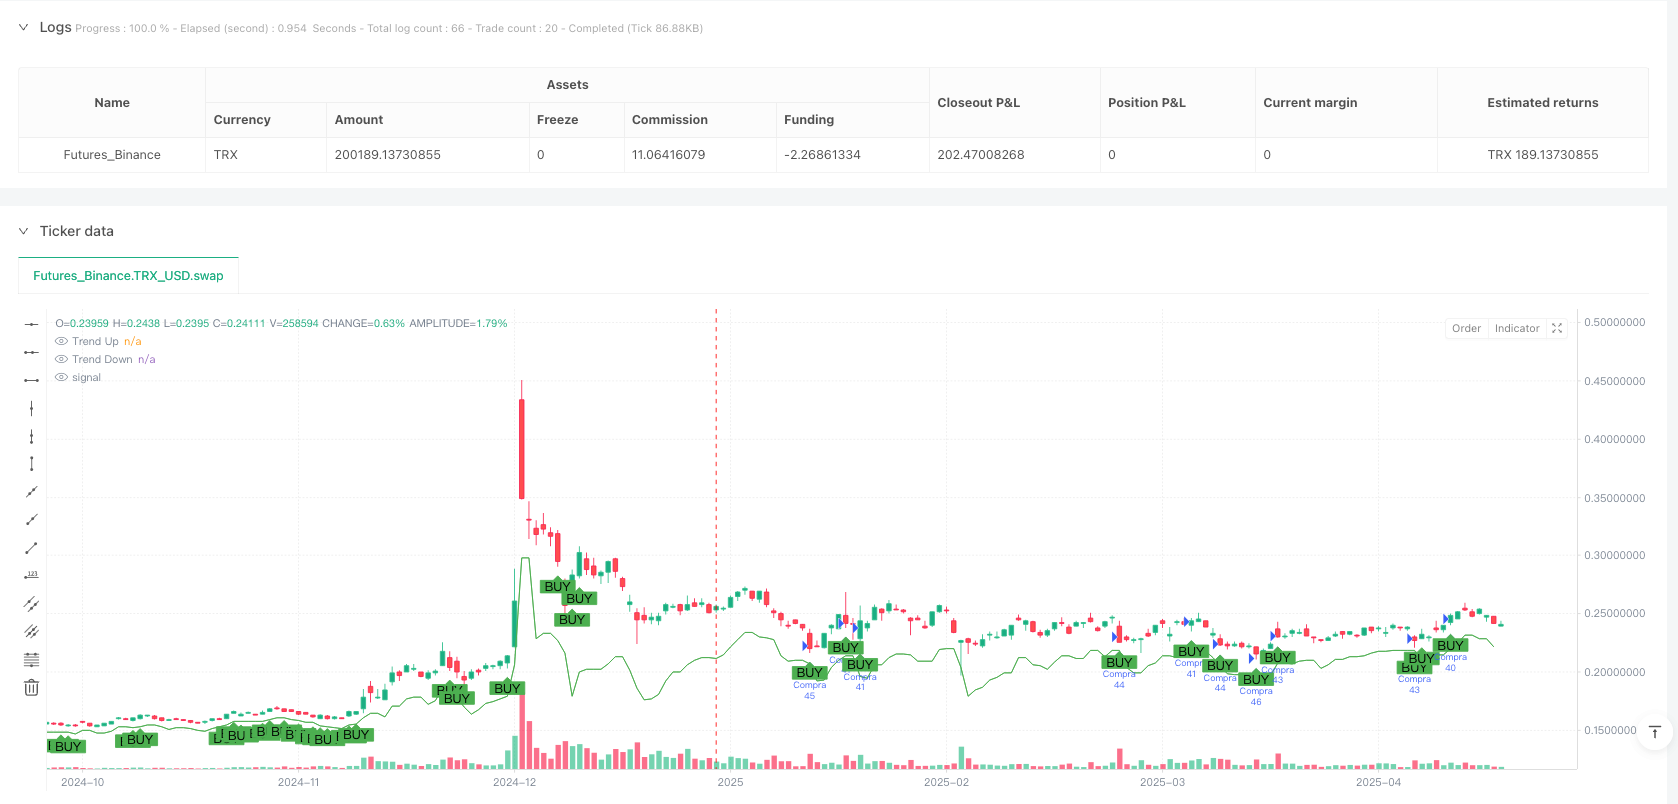
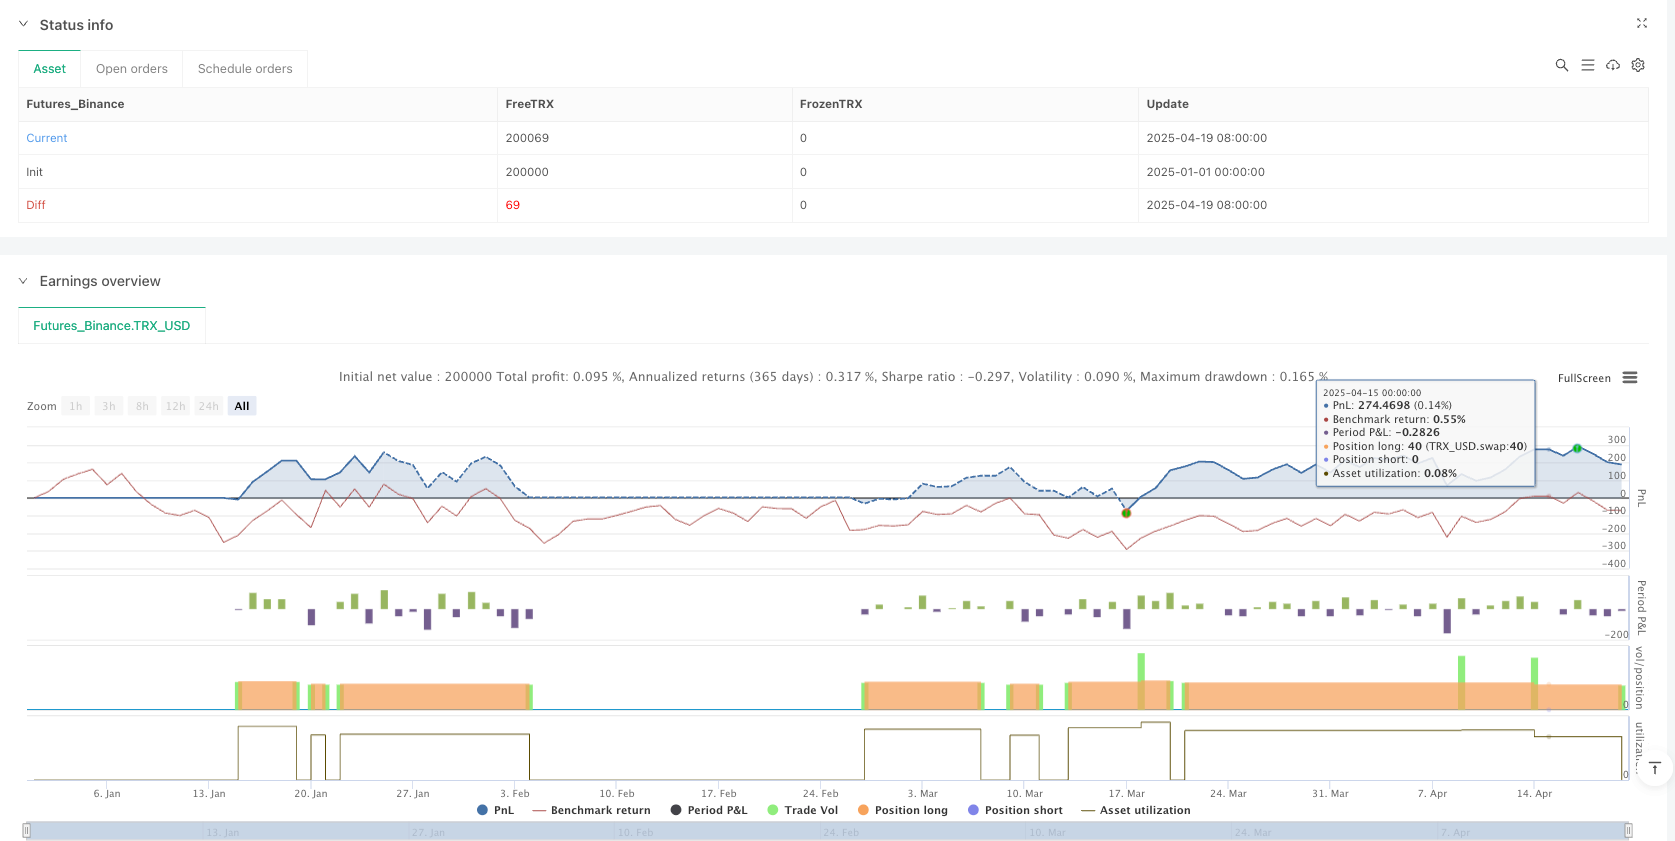
[trans]
概述
该策略是一个基于SuperTrend指标的自动化交易系统,结合了RSI(相对强弱指数)、交易量和ATR(平均真实范围)多重指标进行交易决策。它通过识别市场趋势方向,同时利用多重过滤条件来确保交易质量,实现了一套完整的交易系统。该策略最大的特点是将技术分析与风险管理紧密结合,每笔交易都基于市场波动率自动调整止损和获利目标,形成了动态的风险控制机制。
策略原理
该策略的核心逻辑围绕以下几个主要组成部分展开:
-
趋势判断:利用SuperTrend指标作为基础,构建上下轨道线。当价格突破上轨时,认为市场处于上升趋势;突破下轨时,则处于下降趋势。这是交易方向的主要依据。
-
交易量确认:策略要求当前交易量必须高于20周期交易量均值的特定倍数(可通过volumeMultiplier参数调整)。这确保了只在流动性充足的情况下进行交易。
-
蜡烛体强度验证:计算当前蜡烛实体大小(收盘价与开盘价之差的绝对值),并与ATR值进行比较。只有当蜡烛体达到ATR的特定比例(bodyPctOfATR参数控制)时,才认为价格走势具有足够强度。
-
RSI过滤:使用RSI指标避免在过度买入或过度卖出区域进行交易。买入信号要求RSI低于超买水平(默认70),卖出信号要求RSI高于超卖水平(默认30)。
-
自动止盈止损:每笔交易的止损设置为一个ATR距离,而止盈则设置为止损的倍数(由riskRewardRatio参数控制),实现了基于市场实际波动率的动态风险管理。
通过上述五个方面的综合判断,策略形成了买入和卖出的条件:
- 买入条件:处于上升趋势,交易量足够,蜡烛体足够强,RSI未超买
- 卖出条件:处于下降趋势,交易量足够,蜡烛体足够强,RSI未超卖
策略优势
分析该策略的代码实现,可以总结出以下显著优势:
-
多维度确认机制:通过SuperTrend、RSI、交易量和蜡烛体强度的多重确认,大大减少了虚假信号,提高了交易的准确性。尤其在剧烈波动的市场中,这种多维度的确认机制可以避免许多不必要的交易。
-
自适应风险管理:基于ATR的动态止损和止盈设置,使策略能够根据不同市场阶段的波动率自动调整风险参数,避免了固定止损带来的不适应性问题。
-
资金管理集成:策略内置了资金管理功能,通过capitalPerTrade参数可以根据账户规模和风险偏好调整每笔交易的资金量,实现了风险控制与交易策略的一体化。
-
交易自动化程度高:从入场信号、资金分配到止盈止损全部实现了自动化,降低了手动操作的心理压力和错误概率。
-
警报系统完善:策略配置了详细的JSON格式警报,包含交易方向、资金量、止损和止盈价格等关键信息,便于与外部系统集成或通知用户。
策略风险
尽管该策略在设计上考虑了多方面因素,但仍然存在以下潜在风险:
-
参数敏感性:策略的性能高度依赖于参数设置,如ATR周期、RSI阈值、交易量乘数等。不当的参数可能导致过度交易或错过重要机会。解决方法是通过回测在不同市场环境下找到最优参数组合。
-
趋势转折点的滞后:SuperTrend作为趋势跟踪指标,在趋势转折点通常有滞后性,可能导致入场较晚或止损较大。可通过缩短ATR周期或调整ATR乘数来减轻这一问题。
-
极端市场风险:在市场gap或闪崩情况下,预设的止损可能无法有效执行,导致超预期损失。建议配合使用其他风控措施,如总体头寸控制或设置最大损失限制。
-
资金效率问题:固定资金分配方式可能导致资金使用效率不高。可以考虑实现基于波动率或账户净值的动态头寸调整。
-
单一时间框架限制:当前策略仅基于单一时间框架的信号,缺乏多时间框架确认,可能会在某些市场条件下产生错误信号。
策略优化方向
针对上述风险和限制,该策略可在以下方向进行优化:
-
多时间框架分析集成:引入更高时间框架的趋势确认,只在主要趋势方向上交易,可以显著提高策略的稳定性。这可以通过TradingView的security函数实现跨时间框架数据访问。
-
动态参数自适应:可以根据市场波动率自动调整ATR乘数、RSI阈值等参数,使策略更好地适应不同市场环境。例如,在高波动市场中增加ATR乘数,减少虚假突破。
-
优化资金管理算法:引入基于凯利公式或固定比例风险模型的动态资金管理,根据历史胜率和盈亏比自动调整每笔交易的资金分配,提高长期收益的稳定性。
-
增加市场状态识别:加入对市场状态(趋势、盘整、高波动、低波动)的判断逻辑,在不同市场状态下应用不同的交易规则或参数,提高适应性。
-
整合机器学习模型:可以考虑使用机器学习算法预测最优的入场时机或参数组合,特别是在确定ATR乘数、交易量阈值等关键参数时,机器学习可以提供更精确的自适应能力。
总结
SuperTrend-ATR-RSI动态风控策略是一个将趋势跟踪与动态风险管理相结合的量化交易系统。通过SuperTrend指标识别市场趋势,并结合RSI、交易量和蜡烛体强度等多重过滤机制,大大提高了交易信号的质量。策略的核心优势在于其自适应的风险管理框架,通过基于ATR的动态止损和止盈设置,使风险控制能够随市场波动率自动调整。
该策略适合波动性较大且趋势明显的市场环境,特别是在中长期趋势形成的阶段。然而,用户在实际应用中应注意参数优化和市场环境匹配,并考虑本文提出的优化方向,如多时间框架分析、动态参数调整和高级资金管理方法等,以进一步提升策略的稳健性和适应性。
通过合理的参数设置和充分的回测验证,这一策略有潜力成为一个可靠的自动化交易工具,为投资者提供系统化的交易执行和风险控制解决方案。 ||
Overview
This strategy is an automated trading system based on the SuperTrend indicator, integrating multiple indicators including RSI (Relative Strength Index), volume, and ATR (Average True Range) for trading decisions. It identifies market trend direction while utilizing multiple filtering conditions to ensure trading quality, creating a comprehensive trading system. The strategy's most distinctive feature is its tight integration of technical analysis with risk management, automatically adjusting stop-loss and take-profit targets for each trade based on market volatility, forming a dynamic risk control mechanism.
Strategy Principles
The core logic of this strategy revolves around the following main components:
-
Trend Determination: Using the SuperTrend indicator as a foundation to construct upper and lower bands. When price breaks through the upper band, the market is considered to be in an uptrend; when it breaks through the lower band, it's in a downtrend. This serves as the primary basis for trading direction.
-
Volume Confirmation: The strategy requires current trading volume to be higher than a specific multiple of the 20-period volume average (adjustable via the volumeMultiplier parameter). This ensures trades only occur when there is sufficient liquidity.
-
Candle Body Strength Verification: Calculates the current candle's body size (absolute difference between closing and opening prices) and compares it with the ATR value. Only when the candle body reaches a specific proportion of ATR (controlled by the bodyPctOfATR parameter) is the price movement considered to have sufficient strength.
-
RSI Filtering: Uses the RSI indicator to avoid trading in overbought or oversold areas. Buy signals require RSI below the overbought level (default 70), while sell signals require RSI above the oversold level (default 30).
-
Automatic Take-Profit and Stop-Loss: Each trade's stop-loss is set at one ATR distance, while the take-profit is set as a multiple of the stop-loss (controlled by the riskRewardRatio parameter), implementing dynamic risk management based on actual market volatility.
Through the comprehensive judgment of the above five aspects, the strategy forms buy and sell conditions:
- Buy condition: Uptrend, sufficient volume, strong enough candle body, RSI not overbought
- Sell condition: Downtrend, sufficient volume, strong enough candle body, RSI not oversold
Strategy Advantages
Analyzing the code implementation of this strategy, the following significant advantages can be summarized:
-
Multi-dimensional Confirmation Mechanism: Through multiple confirmations from SuperTrend, RSI, volume, and candle body strength, false signals are greatly reduced, improving trading accuracy. Especially in volatile markets, this multi-dimensional confirmation mechanism can avoid many unnecessary trades.
-
Adaptive Risk Management: Dynamic stop-loss and take-profit settings based on ATR allow the strategy to automatically adjust risk parameters according to volatility in different market phases, avoiding the inflexibility problems of fixed stop-losses.
-
Integrated Capital Management: The strategy has built-in capital management functionality, allowing adjustment of capital amount per trade through the capitalPerTrade parameter based on account size and risk preference, achieving integration of risk control and trading strategy.
-
High Degree of Trade Automation: Everything from entry signals to capital allocation to take-profit and stop-loss is fully automated, reducing the psychological pressure and error probability of manual operations.
-
Comprehensive Alert System: The strategy is configured with detailed JSON format alerts, containing key information such as trading direction, capital amount, stop-loss and take-profit prices, facilitating integration with external systems or user notifications.
Strategy Risks
Despite considering multiple factors in its design, the strategy still has the following potential risks:
-
Parameter Sensitivity: The strategy's performance is highly dependent on parameter settings, such as ATR period, RSI thresholds, volume multiplier, etc. Inappropriate parameters may lead to overtrading or missing important opportunities. The solution is to find optimal parameter combinations for different market environments through backtesting.
-
Lag at Trend Turning Points: As a trend-following indicator, SuperTrend typically has a lag at trend turning points, potentially resulting in late entries or larger stop-losses. This can be mitigated by shortening the ATR period or adjusting the ATR multiplier.
-
Extreme Market Risk: In market gaps or flash crashes, preset stop-losses may not execute effectively, leading to losses beyond expectations. It's recommended to use other risk control measures, such as overall position control or maximum loss limits.
-
Capital Efficiency Issues: Fixed capital allocation methods may lead to inefficient use of capital. Consider implementing dynamic position adjustment based on volatility or account equity.
-
Single Timeframe Limitation: The current strategy is based solely on signals from a single timeframe, lacking multi-timeframe confirmation, which may generate erroneous signals under certain market conditions.
Strategy Optimization Directions
Addressing the above risks and limitations, the strategy can be optimized in the following directions:
-
Multi-Timeframe Analysis Integration: Introducing trend confirmation from higher timeframes, trading only in the direction of the major trend, can significantly improve strategy stability. This can be implemented through TradingView's security function for cross-timeframe data access.
-
Dynamic Parameter Adaptation: Automatically adjusting parameters such as ATR multiplier and RSI thresholds based on market volatility helps the strategy better adapt to different market environments. For example, increasing the ATR multiplier in highly volatile markets to reduce false breakouts.
-
Optimized Capital Management Algorithm: Introducing dynamic capital management based on the Kelly formula or fixed-proportion risk model, automatically adjusting capital allocation for each trade based on historical win rates and profit/loss ratios, enhancing long-term return stability.
-
Enhanced Market State Recognition: Adding logic to identify market states (trending, ranging, high volatility, low volatility) and applying different trading rules or parameters in different market states improves adaptability.
-
Machine Learning Integration: Consider using machine learning algorithms to predict optimal entry timing or parameter combinations, especially for determining key parameters like ATR multiplier and volume thresholds. Machine learning can provide more precise adaptive capabilities.
Summary
The SuperTrend-ATR-RSI Dynamic Risk Control Strategy is a quantitative trading system that combines trend following with dynamic risk management. By identifying market trends through the SuperTrend indicator and incorporating multiple filtering mechanisms including RSI, volume, and candle body strength, it greatly improves the quality of trading signals. The core advantage lies in its adaptive risk management framework, which automatically adjusts risk control according to market volatility through ATR-based dynamic stop-loss and take-profit settings.
This strategy is suitable for market environments with significant volatility and clear trends, especially during the formation of medium to long-term trends. However, users should pay attention to parameter optimization and market environment matching in practical application, and consider the optimization directions proposed in this article, such as multi-timeframe analysis, dynamic parameter adjustment, and advanced capital management methods, to further enhance the strategy's robustness and adaptability.
With reasonable parameter settings and thorough backtesting validation, this strategy has the potential to become a reliable automated trading tool, providing investors with a systematic solution for trade execution and risk control.[/trans]
Source (PineScript)
/*backtest
start: 2025-01-01 00:00:00
end: 2025-04-20 00:00:00
period: 1d
basePeriod: 1d
exchanges: [{"eid":"Futures_Binance","currency":"TRX_USD"}]
*/

//@version=5
strategy("Supertrend Hombrok Bot", overlay=true, default_qty_type=strategy.cash, default_qty_value=1000)

// INPUTS
atrPeriod = input.int(10, title="ATR Period")
atrMult = input.float(3.0, title="ATR Multiplier")
rsiPeriod = input.int(14, title="RSI Period")
rsiOverbought = input.int(70, title="RSI Overbought")
rsiOversold = input.int(30, title="RSI Oversold")
volumeMultiplier = input.float(1.2, title="Volume Multiplier")
bodyPctOfATR = input.float(0.3, title="Candle Body % of ATR (min strength)")
riskRewardRatio = input.float(2.0, title="R:R (Take Profit / Stop Loss)")
capitalPerTrade = input.float(10, title="Capital por operação ($)")

// ATR e Supertrend
atr = ta.atr(atrPeriod)
upperBand = hl2 - (atrMult * atr)
lowerBand = hl2 + (atrMult * atr)
prevUpper = nz(upperBand[1], upperBand)
prevLower = nz(lowerBand[1], lowerBand)

trendUp = close[1] > prevUpper ? math.max(upperBand, prevUpper) : upperBand
trendDown = close[1] < prevLower ? math.min(lowerBand, prevLower) : lowerBand

trend = 1
trend := nz(trend[1], trend)
trend := trend == -1 and close > trendDown ? 1 : trend == 1 and close < trendUp ? -1 : trend

isUpTrend = trend == 1
isDownTrend = trend == -1

// Filtros
volAverage = ta.sma(volume, 20)
volOk = volume > volAverage * volumeMultiplier

bodySize = math.abs(close - open)
bodyOk = bodySize > (atr * bodyPctOfATR)

rsi = ta.rsi(close, rsiPeriod)
rsiBuyOk = rsi < rsiOverbought
rsiSellOk = rsi > rsiOversold

// Condições
buyCond = isUpTrend and volOk and bodyOk and rsiBuyOk
sellCond = isDownTrend and volOk and bodyOk and rsiSellOk

// TP e SL
longSL = close - atr
longTP = close + (atr * riskRewardRatio)
shortSL = close + atr
shortTP = close - (atr * riskRewardRatio)

// Estratégia de entrada e saída
if buyCond
    strategy.entry("Compra", strategy.long, qty=capitalPerTrade / close)
    strategy.exit("TP/SL Compra", from_entry="Compra", stop=longSL, limit=longTP)

if sellCond
    strategy.entry("Venda", strategy.short, qty=capitalPerTrade / close)
    strategy.exit("TP/SL Venda", from_entry="Venda", stop=shortSL, limit=shortTP)

// ALERTAS + LABELS
alertLong = '{"side":"buy", "capital":' + str.tostring(capitalPerTrade) + ', "sl":' + str.tostring(longSL) + ', "tp":' + str.tostring(longTP) + '}'
alertShort = '{"side":"sell", "capital":' + str.tostring(capitalPerTrade) + ', "sl":' + str.tostring(shortSL) + ', "tp":' + str.tostring(shortTP) + '}'

if buyCond
    label.new(bar_index, low, "BUY", style=label.style_label_up, color=color.green, textcolor=color.white)
    alert(alertLong, alert.freq_once_per_bar_close)

if sellCond
    label.new(bar_index, high, "SELL", style=label.style_label_down, color=color.red, textcolor=color.white)
    alert(alertShort, alert.freq_once_per_bar_close)

// VISUAL
plotshape(buyCond, title="Buy Signal", location=location.belowbar, color=color.green, style=shape.labelup, text="BUY")
plotshape(sellCond, title="Sell Signal", location=location.abovebar, color=color.red, style=shape.labeldown, text="SELL")

plot(trend == 1 ? trendUp : na, title="Trend Up", color=color.green, linewidth=1)
plot(trend == -1 ? trendDown : na, title="Trend Down", color=color.red, linewidth=1)
Detail
https://www.fmz.com/strategy/491511
Last Modified
2025-04-21 16:15:37