
15 KiB
Name
多指标融合支撑阻力过滤量化交易策略-Multi-Indicator-Fusion-Support-Resistance-Volume-Filtered-Quantitative-Trading-Strategy
Author
ianzeng123
Strategy Description
[trans]
概述
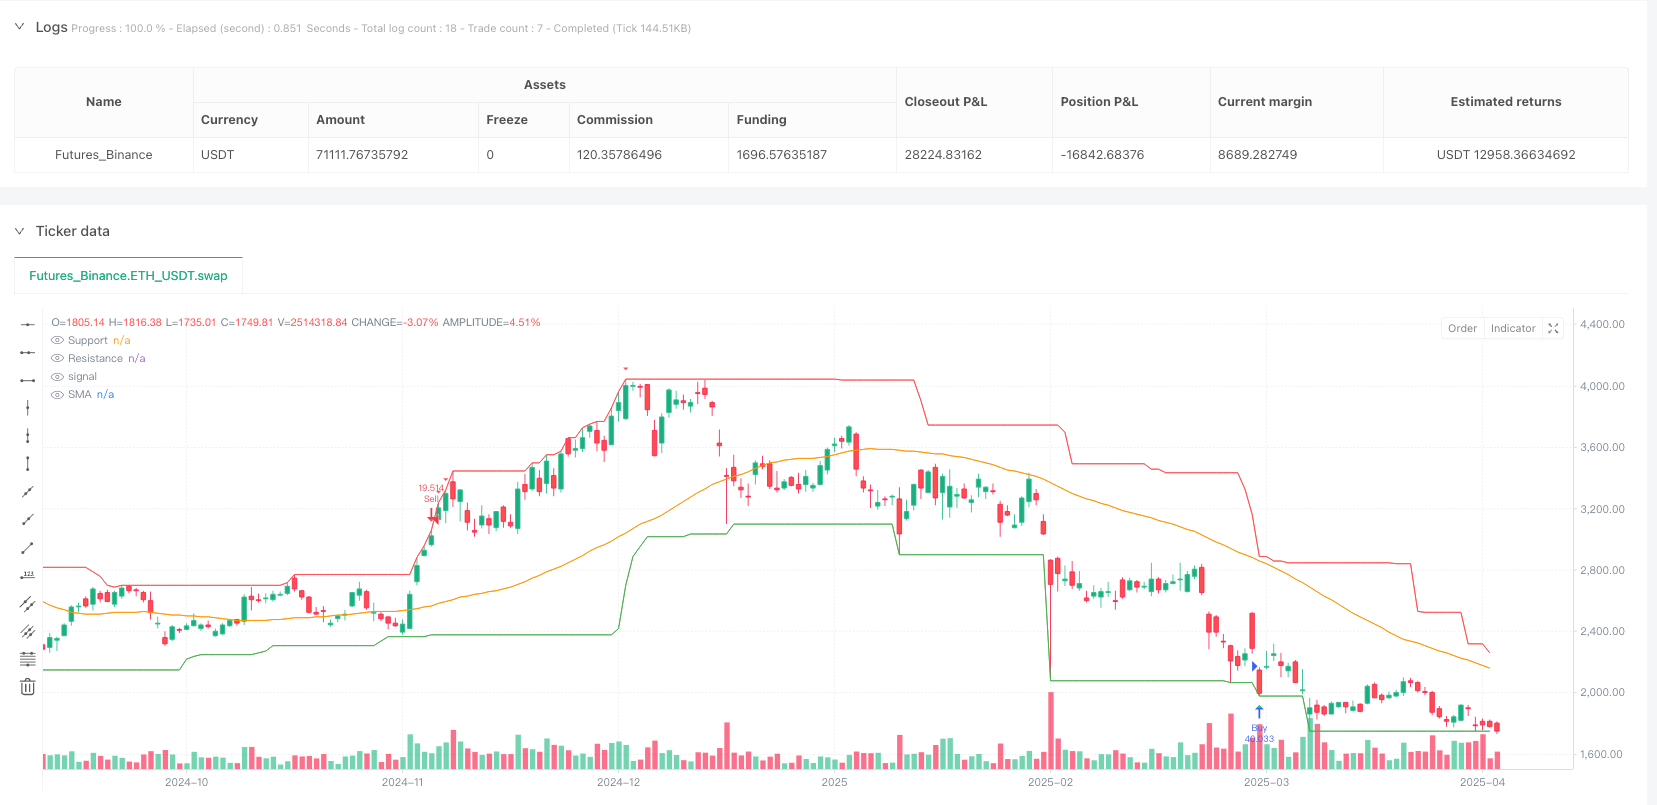
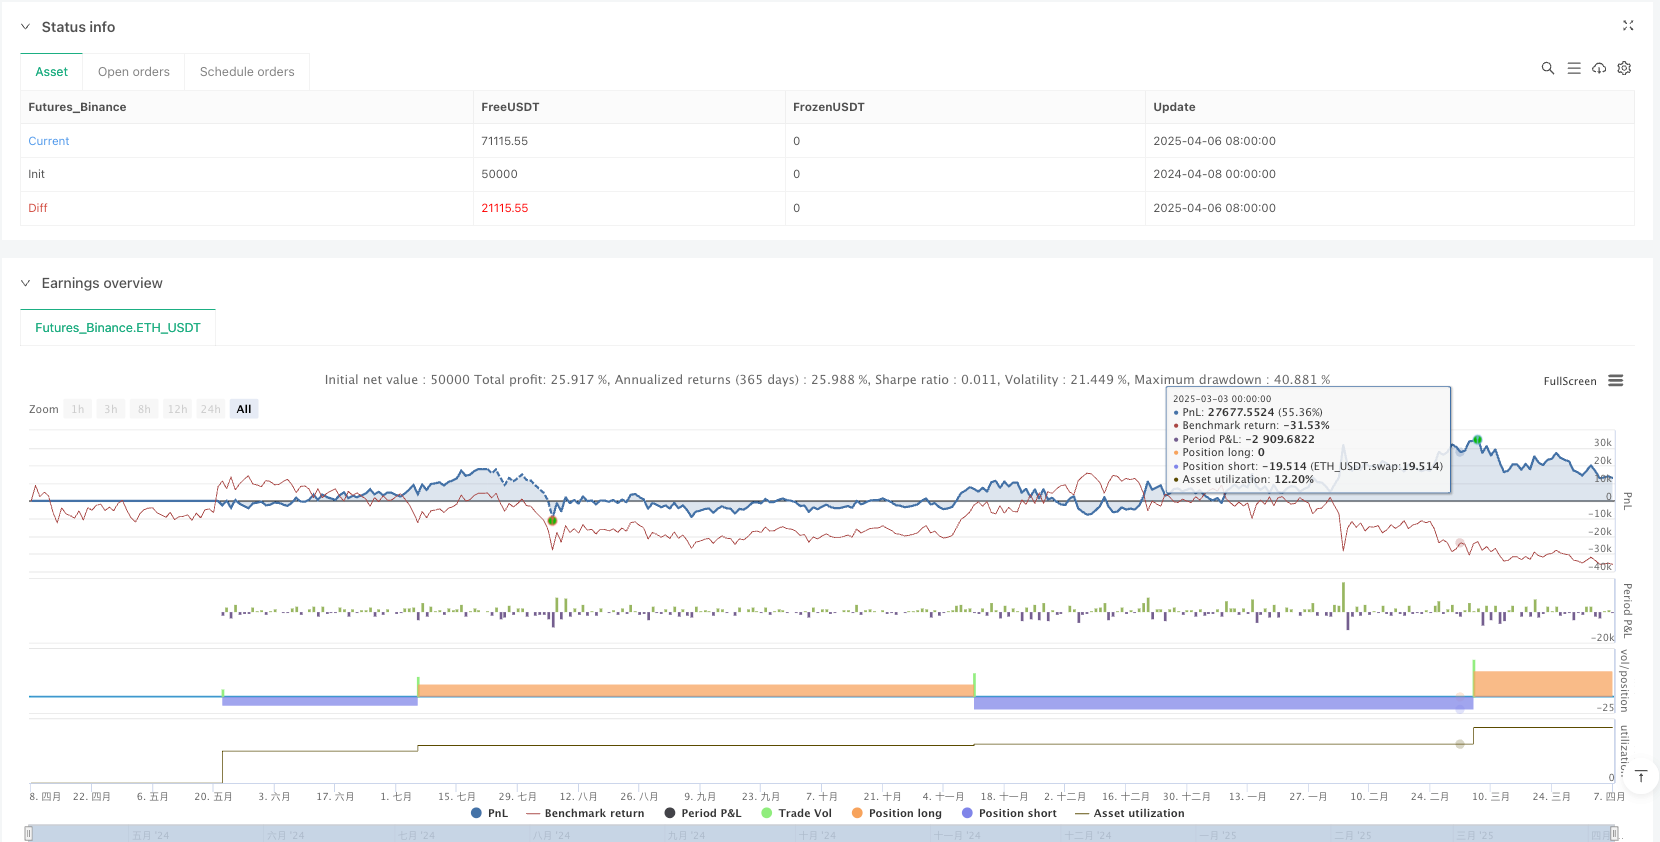
该策略是一种多指标融合的量化交易系统,结合了简单移动平均线(SMA)、相对强弱指数(RSI)和支撑/阻力水平来生成交易信号。该策略还加入了时间过滤和交易量过滤机制,以提高交易的有效性。策略的核心思想是在价格接近支撑位且RSI显示超卖时买入,在价格接近阻力位且RSI显示超买时卖出。此外,它只在指定的时间范围内执行交易,并且可以选择性地只在交易量高于平均水平时进行操作,这有助于确保交易的流动性和有效性。
策略原理
该策略基于几个经典的技术分析概念和指标:
-
简单移动平均线(SMA):使用50周期的SMA来识别市场趋势的总体方向。SMA作为价格的平滑指标,帮助减少噪音并显示更明确的趋势。
-
相对强弱指数(RSI):使用14周期的RSI来检测市场的超买和超卖条件。当RSI低于30时被视为超卖信号,高于70时被视为超买信号。
-
支撑和阻力水平:通过30个周期的窗口计算,分别取这个期间内的最低价和最高价。这些水平代表了价格可能反转的关键区域。
-
交易逻辑:
- 买入信号:当价格接近支撑位(不超过支撑位的1.02倍)且RSI低于30(超卖)时触发
- 卖出信号:当价格接近阻力位(不低于阻力位的0.98倍)且RSI高于70(超买)时触发
-
过滤条件:
- 时间过滤:只在用户指定的日期范围内交易
- 交易量过滤:可选择只在交易量高于20周期平均交易量时进行交易
这种方法结合了趋势跟踪和反转交易的元素,试图在价格达到极端水平并显示潜在反转信号时捕捉交易机会。
策略优势
-
多维信号确认:通过结合多个指标(SMA、RSI、支撑/阻力),策略降低了假信号的风险,只有当多个条件同时满足时才生成交易信号。
-
动态支撑与阻力:策略使用滚动窗口计算支撑和阻力水平,使这些关键价格水平能够随着市场条件变化而自动调整。
-
灵活的过滤机制:
- 时间过滤允许在特定时间段内交易,避开可能不稳定或低效的市场时期
- 交易量过滤确保只在流动性充足的条件下交易,减少滑点和执行问题
-
明确的进场条件:策略有清晰的入场规则,结合价格接近关键水平和超买/超卖条件,这有助于在潜在的反转点捕捉机会。
-
可视化辅助:策略包含了SMA、支撑和阻力线的绘制,以及买卖信号的可视化标记,使交易者能够直观地理解市场状况和策略信号。
-
警报功能:内置的警报条件使交易者能够在产生新信号时得到通知,便于实时监控和交易执行。
策略风险
-
假突破风险:价格临近支撑或阻力位时可能出现假突破,随后迅速反转,导致错误信号。可以考虑增加确认机制,如等待价格在支撑/阻力位附近停留一定时间或增加额外的确认指标。
-
过度交易风险:在横盘市场或高波动市场中,RSI可能频繁穿越超买超卖水平,导致过多交易信号。可以通过调整RSI的阈值或增加信号过滤条件来减少这种情况。
-
参数敏感性:策略表现高度依赖于所选参数(SMA周期、RSI周期、支撑/阻力窗口等)。不同市场和时间框架可能需要不同的参数设置,建议进行稳健的回测和优化。
-
单一头寸管理:当前策略缺乏止损和获利策略,可能导致在市场剧烈波动时承受过大损失。建议加入止损策略和头寸规模管理功能。
-
时间过滤的限制:固定的日期范围可能导致错过日期范围外的良好交易机会。考虑使用更动态的时间过滤方法,如基于市场状况的自适应过滤。
策略优化方向
-
加入止损和获利目标:
- 实现基于ATR(平均真实范围)的动态止损
- 添加基于支撑/阻力水平的获利目标
- 这些改进将提高风险管理能力,保护资本并锁定利润
-
优化参数自适应:
- 实现参数的动态调整,根据市场波动性自动调整SMA、RSI周期和支撑/阻力窗口
- 这将使策略更好地适应不同市场条件和资产类别
-
增强过滤机制:
- 加入趋势过滤,如只在价格高于SMA时做多,低于SMA时做空
- 加入波动性过滤,避免在极端波动期间交易
- 这些过滤器将提高交易质量并减少假信号
-
添加仓位管理:
- 基于波动性和信号强度动态调整仓位大小
- 实现分步进场和出场策略,减少市场噪音影响
- 这将优化资本利用率并控制每次交易的风险
-
整合市场情绪指标:
- 加入其他市场情绪指标,如MACD或布林带
- 分析多个时间框架的信号一致性
- 这将提供更全面的市场视角,提高信号质量
总结
多指标融合支撑阻力过滤量化交易策略是一个结合了SMA、RSI和动态支撑/阻力水平的综合交易系统。通过融合多种技术指标并加入时间和交易量过滤,该策略试图在潜在的市场反转点捕捉交易机会,同时减少假信号和不必要的交易。
策略的最大优势在于其多维信号确认和灵活的过滤机制,这提高了交易信号的质量。然而,它也面临假突破风险和参数敏感性等挑战。通过加入止损机制、优化参数自适应性、增强过滤器和改进仓位管理,该策略可以进一步优化以提高性能和稳定性。
对于希望在技术分析基础上构建稳健交易系统的交易者,这个策略提供了一个坚实的起点。通过深入理解其原理并根据特定市场需求进行个性化调整,交易者可以开发出更加适合自己交易风格和风险偏好的系统。 ||
Overview
This strategy is a multi-indicator fusion quantitative trading system that combines Simple Moving Average (SMA), Relative Strength Index (RSI), and Support/Resistance levels to generate trading signals. The strategy also incorporates time filtering and volume filtering mechanisms to enhance trading effectiveness. The core concept is to buy when the price approaches support levels and RSI indicates oversold conditions, and to sell when the price approaches resistance levels and RSI indicates overbought conditions. Additionally, it only executes trades within a specified time range and can optionally operate only when volume is above average levels, which helps ensure liquidity and effectiveness of trades.
Strategy Principles
The strategy is based on several classic technical analysis concepts and indicators:
-
Simple Moving Average (SMA): Uses a 50-period SMA to identify the overall direction of market trends. SMA serves as a smoothing indicator for price, helping to reduce noise and display clearer trends.
-
Relative Strength Index (RSI): Uses a 14-period RSI to detect overbought and oversold market conditions. RSI below 30 is considered an oversold signal, while above 70 is considered overbought.
-
Support and Resistance Levels: Calculated through a 30-period window, taking the lowest price and highest price during this period respectively. These levels represent key areas where price may reverse.
-
Trading Logic:
- Buy Signal: Triggered when price approaches support (not exceeding 1.02 times the support) and RSI is below 30 (oversold)
- Sell Signal: Triggered when price approaches resistance (not below 0.98 times the resistance) and RSI is above 70 (overbought)
-
Filtering Conditions:
- Time Filter: Only trades within a user-specified date range
- Volume Filter: Can choose to trade only when volume is higher than the 20-period average volume
This approach combines elements of trend following and reversal trading, attempting to capture trading opportunities when prices reach extreme levels and show potential reversal signals.
Strategy Advantages
-
Multi-dimensional Signal Confirmation: By combining multiple indicators (SMA, RSI, Support/Resistance), the strategy reduces the risk of false signals, generating trading signals only when multiple conditions are simultaneously met.
-
Dynamic Support and Resistance: The strategy uses a rolling window to calculate support and resistance levels, allowing these key price levels to automatically adjust as market conditions change.
-
Flexible Filtering Mechanisms:
- Time filtering allows trading during specific time periods, avoiding potentially unstable or inefficient market periods
- Volume filtering ensures trading only under conditions of sufficient liquidity, reducing slippage and execution issues
-
Clear Entry Conditions: The strategy has clear entry rules, combining price proximity to key levels and overbought/oversold conditions, which helps capture opportunities at potential reversal points.
-
Visual Assistance: The strategy includes plotting of SMA, support and resistance lines, and visualization of buy and sell signals, allowing traders to intuitively understand market conditions and strategy signals.
-
Alert Functionality: Built-in alert conditions enable traders to be notified when new signals are generated, facilitating real-time monitoring and trade execution.
Strategy Risks
-
False Breakout Risk: When price approaches support or resistance levels, false breakouts may occur, followed by quick reversals, leading to incorrect signals. Consider adding confirmation mechanisms, such as waiting for price to remain near support/resistance for a certain time or adding additional confirmation indicators.
-
Overtrading Risk: In ranging markets or highly volatile markets, RSI may frequently cross overbought and oversold levels, resulting in too many trading signals. This can be reduced by adjusting RSI thresholds or adding signal filtering conditions.
-
Parameter Sensitivity: Strategy performance is highly dependent on selected parameters (SMA period, RSI period, support/resistance window, etc.). Different markets and timeframes may require different parameter settings; robust backtesting and optimization are recommended.
-
Single Position Management: The current strategy lacks stop-loss and profit-taking strategies, which may lead to excessive losses during sharp market fluctuations. Adding stop-loss strategies and position sizing management is recommended.
-
Limitations of Time Filtering: Fixed date ranges may cause missed trading opportunities outside the date range. Consider using more dynamic time filtering methods, such as adaptive filtering based on market conditions.
Strategy Optimization Directions
-
Add Stop-Loss and Profit Targets:
- Implement dynamic stop-losses based on ATR (Average True Range)
- Add profit targets based on support/resistance levels
- These improvements will enhance risk management capabilities, protect capital, and lock in profits
-
Optimize Parameter Adaptability:
- Implement dynamic adjustment of parameters, automatically adjusting SMA, RSI periods, and support/resistance windows based on market volatility
- This will make the strategy better adapt to different market conditions and asset classes
-
Enhance Filtering Mechanisms:
- Add trend filtering, such as only going long when price is above SMA, and short when below SMA
- Add volatility filtering to avoid trading during periods of extreme volatility
- These filters will improve trading quality and reduce false signals
-
Add Position Management:
- Dynamically adjust position size based on volatility and signal strength
- Implement stepped entry and exit strategies to reduce market noise impact
- This will optimize capital utilization and control risk for each trade
-
Integrate Market Sentiment Indicators:
- Add other market sentiment indicators such as MACD or Bollinger Bands
- Analyze signal consistency across multiple timeframes
- This will provide a more comprehensive market perspective and improve signal quality
Summary
The Multi-Indicator Fusion Support-Resistance Volume-Filtered Quantitative Trading Strategy is a comprehensive trading system that combines SMA, RSI, and dynamic support/resistance levels. By integrating multiple technical indicators and adding time and volume filtering, the strategy attempts to capture trading opportunities at potential market reversal points while reducing false signals and unnecessary trades.
The strategy's greatest advantages lie in its multi-dimensional signal confirmation and flexible filtering mechanisms, which improve the quality of trading signals. However, it also faces challenges such as false breakout risks and parameter sensitivity. By adding stop-loss mechanisms, optimizing parameter adaptability, enhancing filters, and improving position management, the strategy can be further optimized to improve performance and stability.
For traders looking to build robust trading systems based on technical analysis, this strategy provides a solid starting point. By deeply understanding its principles and customizing it according to specific market needs, traders can develop systems that better suit their trading style and risk preferences.[/trans]
Source (PineScript)
/*backtest
start: 2024-04-08 00:00:00
end: 2025-04-07 00:00:00
period: 1d
basePeriod: 1d
exchanges: [{"eid":"Futures_Binance","currency":"ETH_USDT"}]
*/

//@version=5
strategy("SMA + RSI + S/R Strategy with Filters", overlay=true, default_qty_type=strategy.percent_of_equity, default_qty_value=100)

// === Input Settings ===
smaPeriod = input.int(50, title="SMA Period")
rsiPeriod = input.int(14, title="RSI Period")
srWindow = input.int(30, title="Support/Resistance Window")
volumeFilter = input.bool(true, title="Enable Volume Filter")
tradeOnlyAboveVolume = input.bool(true, title="Only trade when volume > avg")

// === Indicators ===
sma = ta.sma(close, smaPeriod)
rsi = ta.rsi(close, rsiPeriod)
support = ta.lowest(low, srWindow)
resistance = ta.highest(high, srWindow)
avgVolume = ta.sma(volume, 20)

// === Volume Filter ===
volumeCondition = not volumeFilter or (volume > avgVolume)

// === Signals ===
buySignal = (close <= support * 1.02) and (rsi < 30) and volumeCondition
sellSignal = (close >= resistance * 0.98) and (rsi > 70) and volumeCondition

// === Strategy Backtest ===
if buySignal
    strategy.entry("Buy", strategy.long)
if sellSignal
    strategy.entry("Sell", strategy.short)

// === Plot Lines ===
plot(sma, title="SMA", color=color.orange)
plot(support, title="Support", color=color.green)
plot(resistance, title="Resistance", color=color.red)

// === Plot Signals ===
plotshape(buySignal, title="Buy Signal", location=location.belowbar, color=color.lime, style=shape.triangleup, size=size.small)
plotshape(sellSignal, title="Sell Signal", location=location.abovebar, color=color.red, style=shape.triangledown, size=size.small)

// === Alerts ===
alertcondition(buySignal, title="Buy Alert", message="Buy Signal Triggered!")
alertcondition(sellSignal, title="Sell Alert", message="Sell Signal Triggered!")
Detail
https://www.fmz.com/strategy/489731
Last Modified
2025-04-08 09:46:04