
17 KiB
Name
多指标联动趋势突破量化交易策略-Multi-Indicator-Momentum-Breakout-Quantitative-Trading-Strategy
Author
ianzeng123
Strategy Description
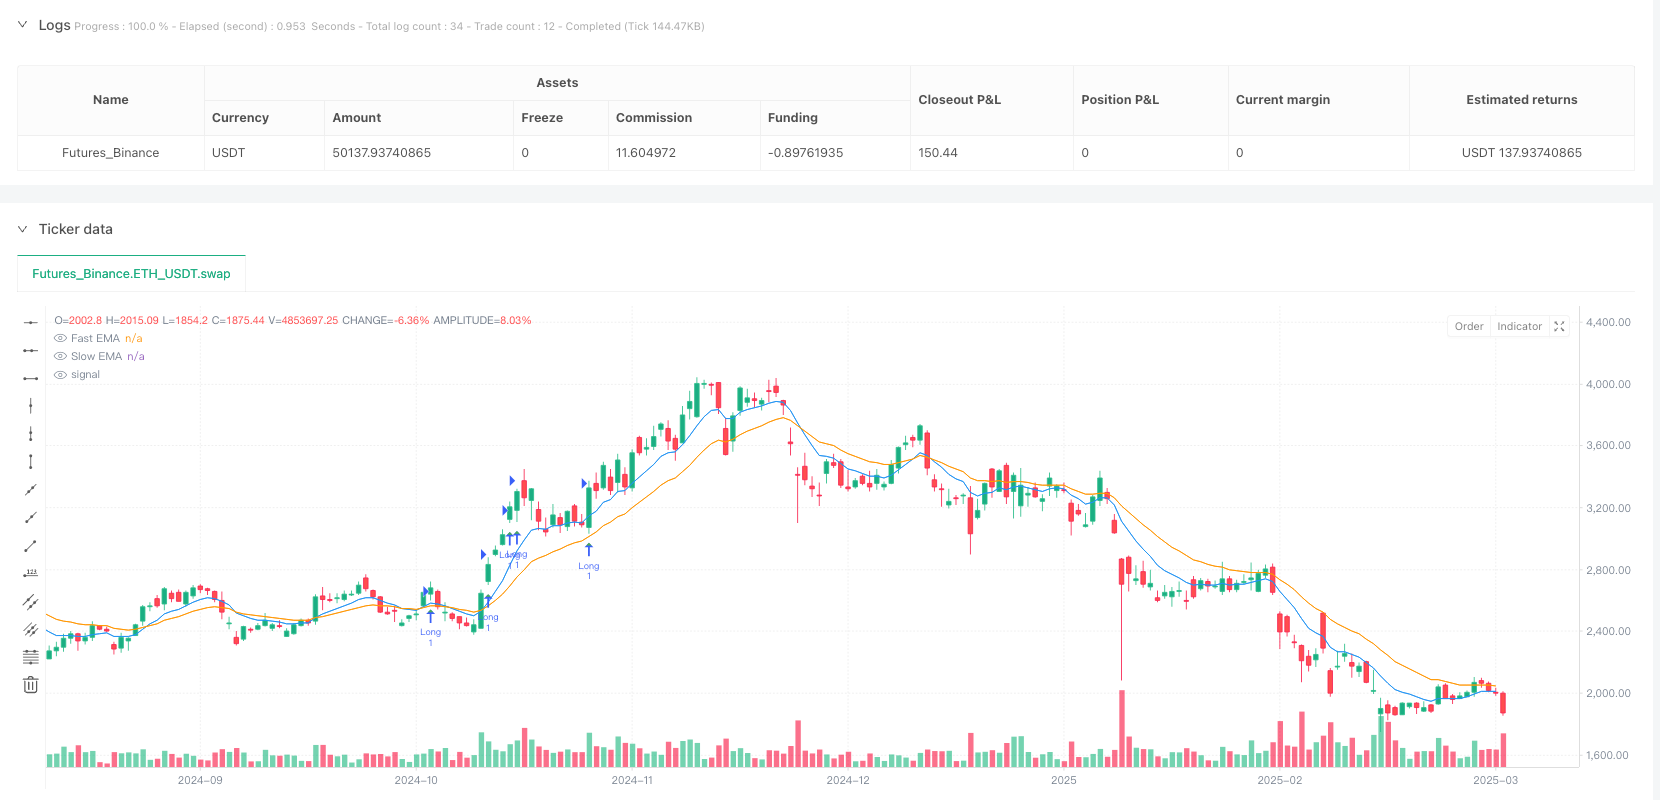
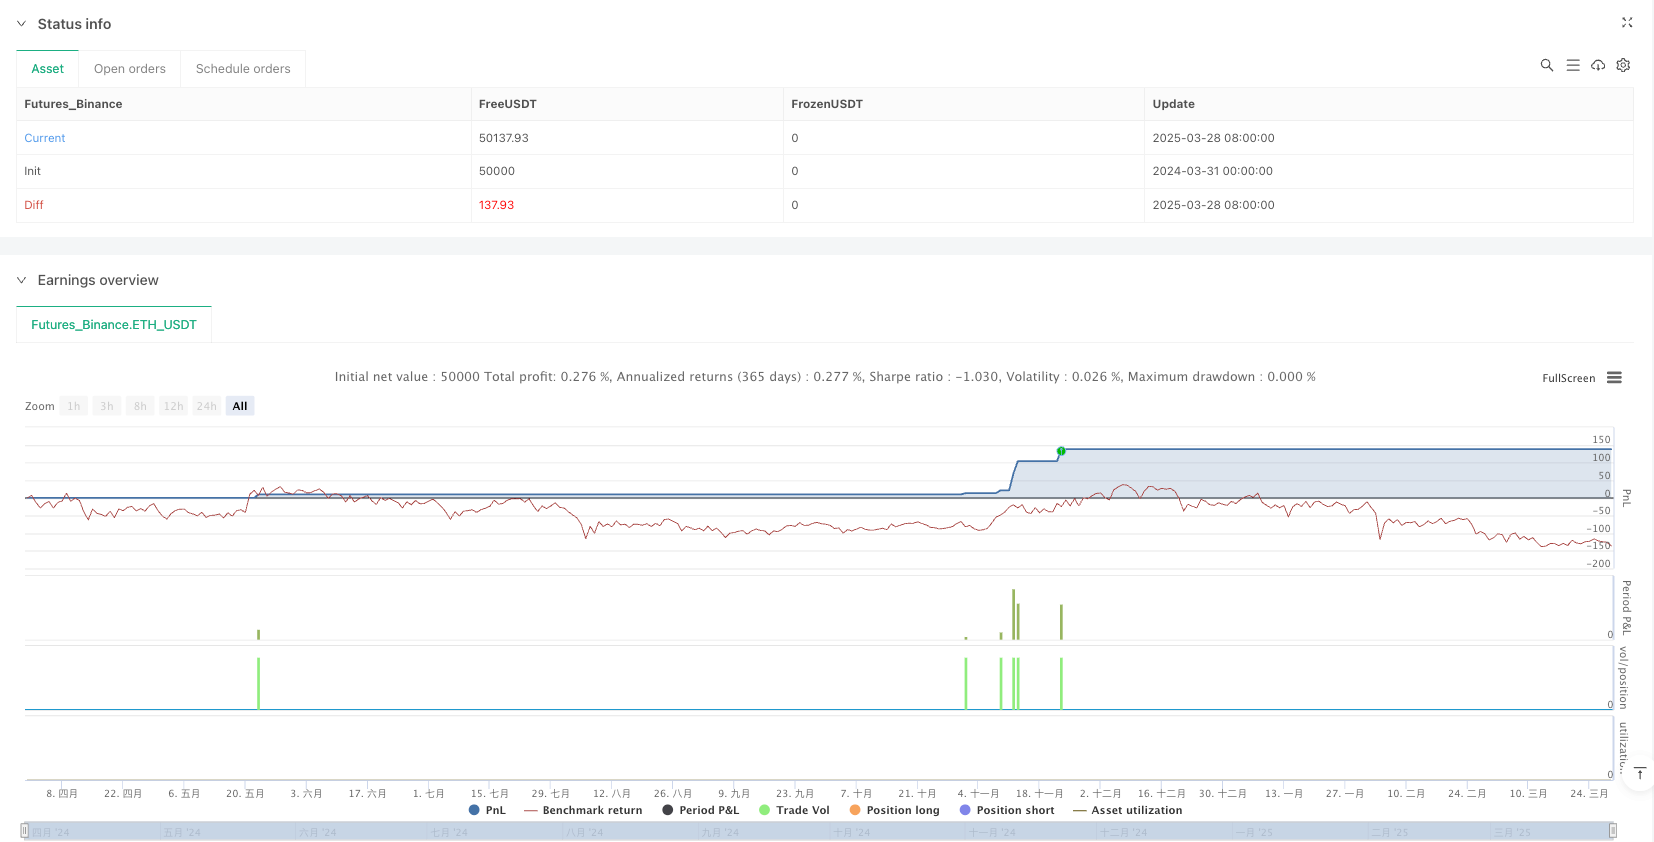
[trans]
概述
本策略是一种结合多指标联动的趋势突破量化交易策略,专为高波动性市场设计。该策略巧妙地整合了指数移动平均线(EMA)、相对强弱指标(RSI)、交易量确认和基于真实波动幅度(ATR)的跟踪止损,以捕捉强势突破行情,同时有效规避虚假信号。核心思路是在确认上升趋势基础上,寻找突破前期高点且成交量显著放大的机会,并通过动态止损和跟踪退出机制保护资金并锁定利润。
策略原理
该策略运行机制建立在四个关键支柱上:
-
EMA趋势确认:使用9周期和20周期的EMA来确认价格处于强势上涨趋势中。当快速EMA(9)位于慢速EMA(20)上方且呈上升趋势时,被视为有效的看涨信号。
-
价格突破确认:策略要求当前收盘价必须突破前一周期的最高价,同时保持在快速EMA之上,这表明价格动能足够强劲。
-
成交量确认:为避免低流动性虚假突破,策略仅在成交量超过20周期平均成交量的1.5倍时才考虑入场,确保突破得到足够的市场参与度支持。
-
RSI动能过滤与背离避免:除了基本的RSI动能过滤(要求RSI>50),策略还检测潜在的RSI看跌背离,通过比较当前5周期和前5周期的RSI最低值与对应价格最低点,有效避免在趋势可能逆转时入场。
-
基于ATR的动态止损与跟踪退出:策略利用14周期ATR设置动态止损位(前一周期最低价减去0.5ATR),并在价格保持在快速EMA之上时启用跟踪止损(2ATR),优化资金管理并最大化盈利能力。
入场条件需同时满足:有效突破、成交量确认、趋势确认和没有RSI看跌背离。这种多层过滤机制显著提高了交易信号的可靠性。
策略优势
-
高精度捕捉爆发性行情:通过要求价格突破、趋势确认和成交量放大的三重验证,策略能够精准捕捉具有持续动能的爆发行情,而非短暂的价格波动。
-
有效过滤横盘和弱势趋势:EMA趋势过滤机制确保策略只在明确的上升趋势中运行,避免在市场横盘或趋势不明确时产生过多交易信号。
-
智能风险管理系统:基于ATR的动态止损为每笔交易提供了针对市场波动性量身定制的保护,而非使用固定数值,使策略在不同波动环境中都能保持适应性。
-
背离检测避免假突破:集成的RSI背离检测是策略的关键优势,帮助避免在价格创新高但动能已开始减弱时入场,有效规避了许多潜在的亏损交易。
-
跟踪止损锁定利润:策略不仅专注于入场点,还集成了基于ATR的跟踪止损机制,在保持足够宽松让利润增长的同时,能够有效锁定已有收益。
策略风险
-
高波动性市场风险:尽管策略设计用于捕捉高波动性资产的动量,但极端波动可能导致止损被迅速触发,特别是在市场跳空或流动性突然枯竭的情况下。解决方法:考虑在高波动预期时调整ATR乘数,或避开重大新闻或事件前的交易。
-
过度交易风险:在特定市场条件下,策略可能生成过多的交易信号,增加交易成本并稀释整体效果。解决方法:考虑增加额外的趋势强度过滤器或延长持仓时间来减少交易频率。
-
背离检测的局限性:尽管背离检测有助于避免某些虚假突破,但它本身也可能产生假信号,特别是在横盘市场中。解决方法:考虑结合其他确认指标或增加背离检测的敏感度调整参数。
-
参数敏感性:策略使用多个参数(如EMA周期、ATR乘数等),其最优值可能因市场条件变化而不同。解决方法:定期对策略进行回测和优化,甚至考虑实施自适应参数体系。
-
缺乏市场结构考量:策略主要基于技术指标而非市场结构(如支撑/阻力位),可能在重要价格水平附近表现不佳。解决方法:考虑整合关键价格水平或市场结构分析作为额外的过滤器。
策略优化方向
-
自适应参数系统:当前策略使用固定的EMA、RSI和ATR参数,可以考虑实现自适应参数系统,根据市场波动性或交易时段自动调整这些参数。这样的优化将提高策略在不同市场环境中的适应性,减少过拟合风险。
-
增强成交量分析:虽然当前策略已包含基本的成交量确认,但可以考虑添加更复杂的成交量分析,如成交量趋势一致性检查或成交量加权移动平均线。这将提高对真实市场参与度的判断准确性。
-
多时间框架分析:策略可以通过整合更高时间框架的趋势确认来提高胜率。例如,只在日线趋势向上时才在5分钟图上寻找看涨突破信号,这将有效滤除逆大趋势的弱势信号。
-
考虑市场波动周期:市场通常在波动和盘整阶段之间交替。策略可以增加一个波动性指标(如历史波动率或布林带宽度)来判断当前市场阶段,并相应调整入场标准和仓位大小。
-
动态仓位管理:当前策略使用固定的资金管理方式,可以考虑实现基于市场波动性、趋势强度或历史胜率的动态仓位管理系统,在信号更强时增加仓位,反之则减少,优化风险回报比。
-
整合机器学习模型:通过使用基于历史数据训练的机器学习模型来预测信号成功概率,可以进一步筛选高概率交易机会,提高策略的整体表现。
总结
多指标联动趋势突破量化交易策略是一个设计精良的交易系统,通过整合多层技术指标确认(EMA趋势、价格突破、成交量确认和RSI分析)有效捕捉高动能市场中的突破机会。策略的突出特点在于其全面的风险管理体系,包括背离检测以避免假突破和基于ATR的动态止损与跟踪退出机制。
虽然策略在捕捉强势突破方面表现出色,但仍存在参数敏感性和市场环境适应性等方面的挑战。通过实施建议的优化方向,如自适应参数系统、增强的成交量分析、多时间框架确认和动态仓位管理,该策略有潜力进一步提升其稳健性和盈利能力。
对于寻求在高波动性市场中捕捉趋势突破机会的交易者而言,这一策略提供了一个结构化的框架,平衡了积极捕捉机会和审慎风险管理之间的关系。然而,与任何交易策略一样,在实盘交易前进行充分的回测和参数优化至关重要。 ||
Overview
This strategy is a multi-indicator momentum breakout quantitative trading system designed specifically for high-volatility markets. It cleverly integrates Exponential Moving Averages (EMA), Relative Strength Index (RSI), volume confirmation, and Average True Range (ATR)-based trailing stops to capture strong breakout movements while effectively avoiding false signals. The core concept is to seek opportunities that break above previous highs with significantly increased volume on a confirmed uptrend, while implementing dynamic stop-loss and trailing exit mechanisms to protect capital and lock in profits.
Strategy Principles
The strategy's operational mechanism is built on four key pillars:
-
EMA Trend Confirmation: Utilizes 9-period and 20-period EMAs to confirm the price is in a strong upward trend. When the fast EMA (9) is positioned above the slow EMA (20) and trending upward, it's considered a valid bullish signal.
-
Price Breakout Confirmation: The strategy requires the current closing price to break above the previous period's high while maintaining position above the fast EMA, indicating sufficient price momentum.
-
Volume Confirmation: To avoid low-liquidity false breakouts, the strategy only considers entry when volume exceeds 1.5 times the 20-period average volume, ensuring the breakout is supported by adequate market participation.
-
RSI Momentum Filtering and Divergence Avoidance: Beyond basic RSI momentum filtering (requiring RSI > 50), the strategy detects potential RSI bearish divergences by comparing current 5-period and previous 5-period RSI lows with corresponding price lows, effectively avoiding entry when the trend might reverse.
-
ATR-Based Dynamic Stop-Loss and Trailing Exit: The strategy employs a 14-period ATR to set dynamic stop-loss levels (previous period low minus 0.5ATR) and enables trailing stops (2ATR) when price maintains above the fast EMA, optimizing capital management and maximizing profitability.
Entry conditions must simultaneously satisfy: valid breakout, volume confirmation, trend confirmation, and no RSI bearish divergence. This multi-layered filtering mechanism significantly enhances the reliability of trading signals.
Strategy Advantages
-
High-Precision Capture of Explosive Movements: Through the triple verification of price breakout, trend confirmation, and volume increase, the strategy can precisely capture explosive movements with sustained momentum, rather than temporary price fluctuations.
-
Effective Filtering of Sideways and Weak Trends: The EMA trend filtering mechanism ensures the strategy only operates in clear uptrends, avoiding excessive trading signals during sideways markets or unclear trends.
-
Intelligent Risk Management System: ATR-based dynamic stop-losses provide customized protection for each trade based on market volatility, rather than using fixed values, allowing the strategy to maintain adaptability in different volatility environments.
-
Divergence Detection Avoids False Breakouts: The integrated RSI divergence detection is a key advantage, helping to avoid entry when price makes new highs but momentum has begun to weaken, effectively preventing many potential losing trades.
-
Trailing Stops Lock in Profits: The strategy not only focuses on entry points but also integrates an ATR-based trailing stop mechanism, which effectively locks in existing gains while remaining sufficiently loose to allow profits to grow.
Strategy Risks
-
High-Volatility Market Risk: Although the strategy is designed to capture momentum in high-volatility assets, extreme volatility may cause stop-losses to be quickly triggered, especially in cases of market gaps or sudden liquidity droughts. Solution: Consider adjusting ATR multipliers during high volatility expectations, or avoiding trading before major news or events.
-
Overtrading Risk: Under certain market conditions, the strategy may generate excessive trading signals, increasing trading costs and diluting overall effectiveness. Solution: Consider adding additional trend strength filters or extending holding periods to reduce trading frequency.
-
Limitations of Divergence Detection: While divergence detection helps avoid some false breakouts, it can itself generate false signals, especially in sideways markets. Solution: Consider combining other confirmation indicators or adding sensitivity adjustment parameters for divergence detection.
-
Parameter Sensitivity: The strategy uses multiple parameters (such as EMA periods, ATR multipliers, etc.), whose optimal values may vary with changing market conditions. Solution: Regularly backtest and optimize the strategy, or even implement an adaptive parameter system.
-
Lack of Market Structure Consideration: The strategy is primarily based on technical indicators rather than market structure (such as support/resistance levels), and may perform poorly near important price levels. Solution: Consider integrating key price levels or market structure analysis as additional filters.
Strategy Optimization Directions
-
Adaptive Parameter System: The current strategy uses fixed EMA, RSI, and ATR parameters; consider implementing an adaptive parameter system that automatically adjusts these parameters based on market volatility or trading sessions. Such optimization would enhance the strategy's adaptability in different market environments and reduce overfitting risk.
-
Enhanced Volume Analysis: Although the current strategy includes basic volume confirmation, consider adding more sophisticated volume analysis, such as volume trend consistency checks or volume-weighted moving averages. This would improve the accuracy of judging real market participation.
-
Multi-Timeframe Analysis: The strategy can improve win rates by integrating higher timeframe trend confirmation. For example, only looking for bullish breakout signals on a 5-minute chart when the daily trend is up would effectively filter out weak signals against the larger trend.
-
Consider Market Volatility Cycles: Markets typically alternate between volatile and consolidation phases. The strategy could add a volatility indicator (such as historical volatility or Bollinger Band width) to determine the current market phase and adjust entry criteria and position size accordingly.
-
Dynamic Position Management: The current strategy uses a fixed money management approach; consider implementing a dynamic position management system based on market volatility, trend strength, or historical win rates, increasing position size when signals are stronger and vice versa, optimizing the risk-reward ratio.
-
Integrate Machine Learning Models: By using machine learning models trained on historical data to predict signal success probability, the strategy can further screen for high-probability trading opportunities, improving overall performance.
Summary
The Multi-Indicator Momentum Breakout Quantitative Trading Strategy is a well-designed trading system that effectively captures breakout opportunities in high-momentum markets through multiple layers of technical indicator confirmation (EMA trend, price breakout, volume confirmation, and RSI analysis). The strategy's standout feature is its comprehensive risk management system, including divergence detection to avoid false breakouts and ATR-based dynamic stop-loss and trailing exit mechanisms.
While the strategy excels at capturing strong breakouts, challenges remain in parameter sensitivity and market environment adaptability. By implementing the suggested optimization directions, such as adaptive parameter systems, enhanced volume analysis, multi-timeframe confirmation, and dynamic position management, this strategy has the potential to further enhance its robustness and profitability.
For traders seeking to capture trend breakout opportunities in high-volatility markets, this strategy provides a structured framework that balances aggressive opportunity capture with prudent risk management. However, as with any trading strategy, thorough backtesting and parameter optimization before live trading are essential.[/trans]
Source (PineScript)
/*backtest
start: 2024-03-31 00:00:00
end: 2025-03-29 08:00:00
period: 1d
basePeriod: 1d
exchanges: [{"eid":"Futures_Binance","currency":"ETH_USDT"}]
*/

//@version=6
strategy("Enhanced First High Break Strategy v3", overlay=true, margin_long=100, margin_short=100)

// Input Parameters
emaFastLength = input.int(9, "Fast EMA Length")
emaSlowLength = input.int(20, "Slow EMA Length")
rsiLength = input.int(14, "RSI Length")
volumeAvgLength = input.int(20, "Volume Average Length")
atrLength = input.int(14, "ATR Length")

// Calculate Indicators
emaFast = ta.ema(close, emaFastLength)
emaSlow = ta.ema(close, emaSlowLength)
rsi = ta.rsi(close, rsiLength)
volAvg = ta.sma(volume, volumeAvgLength)
atr = ta.atr(atrLength)

// Pre-calculate lowest values (FIXED)
rsiLowCurrent = ta.lowest(rsi, 5)
rsiLowPrevious = ta.lowest(rsi[5], 5)
lowLowPrevious = ta.lowest(low[5], 5)

// Trend Conditions
bullishTrend = emaFast > emaSlow and emaFast > emaFast[1]
bearishDivergence = rsiLowCurrent > rsiLowPrevious and low < lowLowPrevious

// Entry Conditions
validBreakout = close > high[1] and close > emaFast
volumeConfirmation = volume > volAvg * 1.5
trendConfirmed = close > emaSlow and close[1] > emaSlow
rsiConfirmation = rsi > 50 and not bearishDivergence

// Final Entry Signal
entryCondition = validBreakout and volumeConfirmation and trendConfirmed

// Exit Conditions
stopLossPrice = low[1] - (atr * 0.50)
trailOffset = atr * 2

// Strategy Execution
if (entryCondition)
    strategy.entry("Long", strategy.long)
    strategy.exit("Exit", "Long", stop=stopLossPrice,trail_points=close > emaFast ? trailOffset : na,trail_offset=trailOffset)

// Plotting
plot(emaFast, "Fast EMA", color.new(color.blue, 0))
plot(emaSlow, "Slow EMA", color.new(color.orange, 0))
plotshape(entryCondition, style=shape.triangleup, color=color.green, location=location.belowbar)
Detail
https://www.fmz.com/strategy/488846
Last Modified
2025-03-31 11:11:28