
22 KiB
Name
多指标联动反转点捕捉交易策略-Multi-Indicator-Reversal-Point-Capture-Trading-Strategy
Author
ianzeng123
Strategy Description
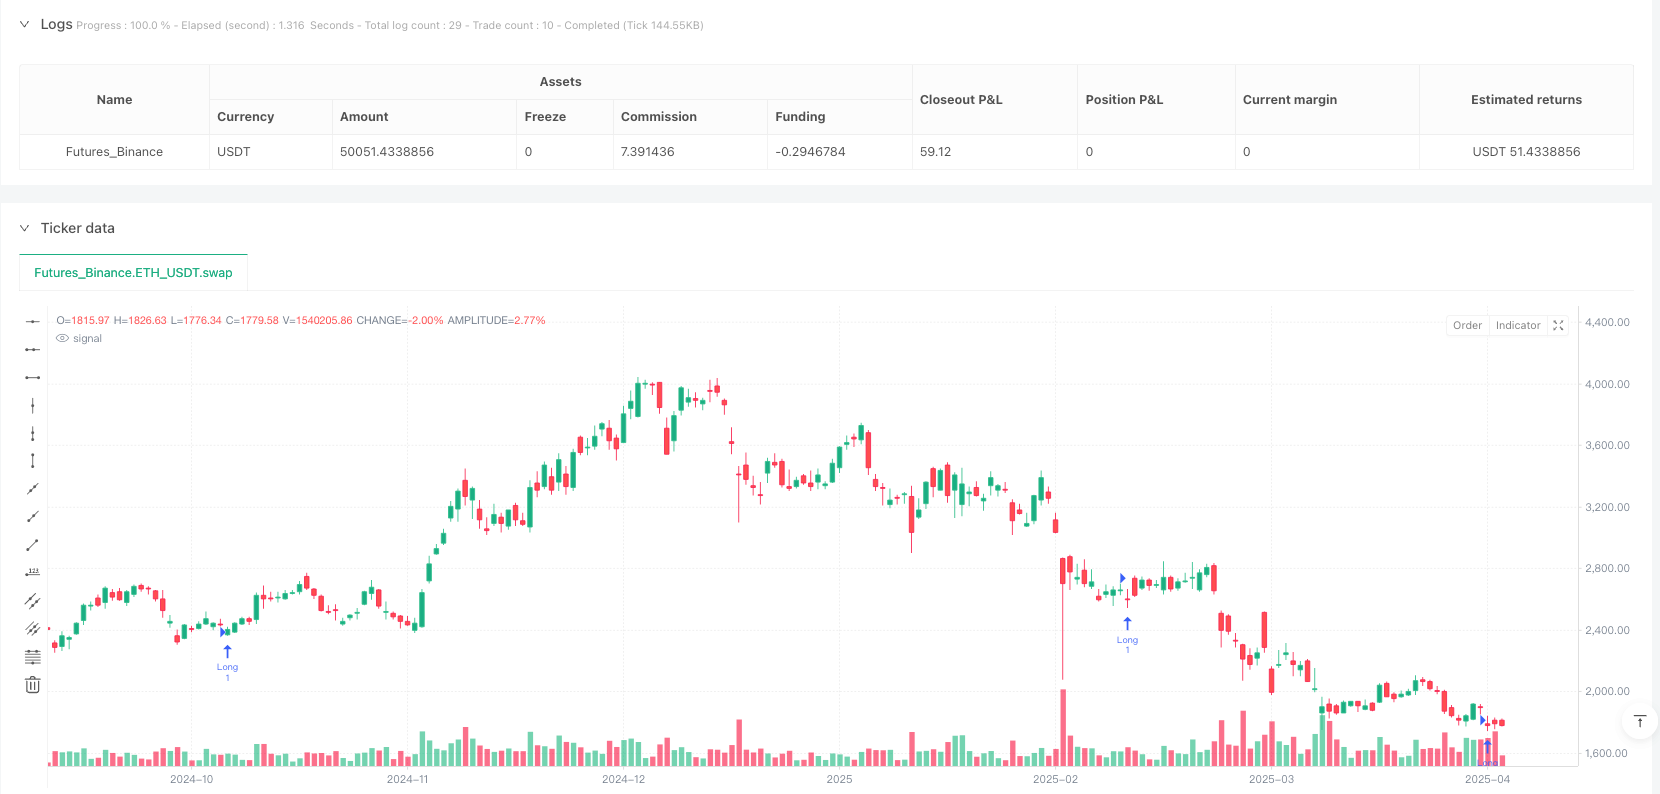
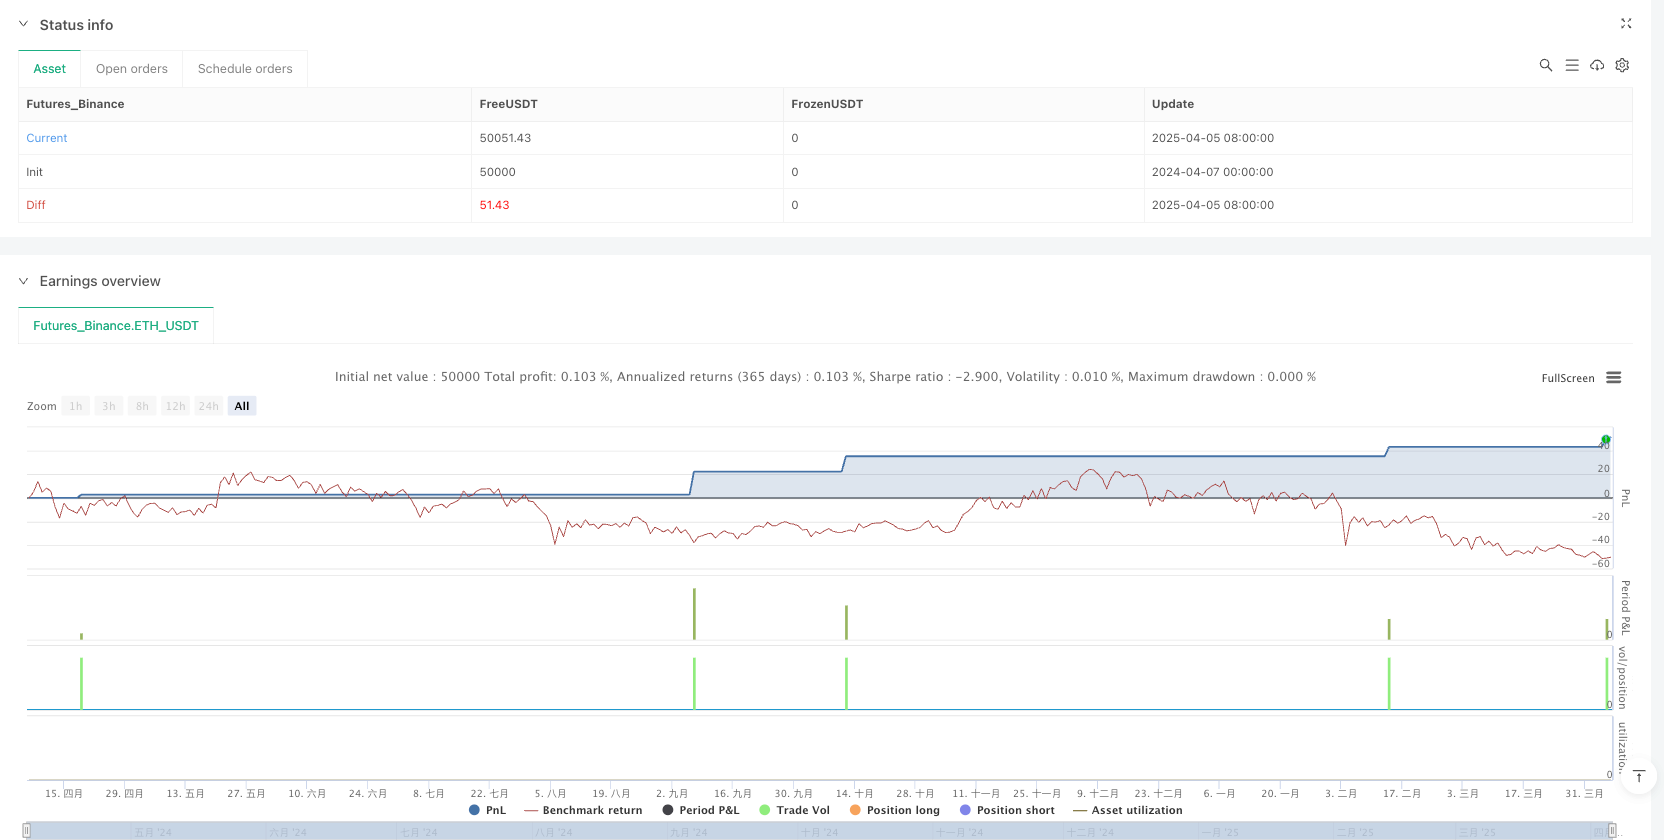
[trans]
概述
多指标联动反转点捕捉交易策略是一种专为捕捉市场潜在反转点而设计的量化交易策略。该策略巧妙地结合了动量指标、波动率指标和趋势一致性过滤器,通过多层技术指标的协同分析来识别看涨和看跌的反转信号。策略核心在于要求多个市场条件同时满足才能进入交易,确保信号的可靠性。策略集成了RSI指标用于背离检测、布林带用于波动率度量、ADX和DMI用于趋势强度确认、ATR用于风险控制以及成交量SMA用于交易量确认。通过这些指标的有机结合,策略能够在不同市场环境下识别具有统计学优势的交易机会。
策略原理
该策略的工作原理基于多维市场分析框架,主要通过以下技术指标协同工作:
-
RSI (相对强弱指数): 设置为8周期,主要用于检测价格与动量之间的背离情况。当价格创新低而RSI不创新低时,可能预示着看涨反转;反之,价格创新高而RSI不创新高,则可能预示着看跌反转。
-
布林带(BB): 设置为20周期,标准差乘数为2。用于衡量市场波动性并识别统计学上的极端价格水平。价格突破上轨或下轨可能预示着趋势变化。
-
ADX(平均方向指数)和DMI(方向运动指数): 用于量化趋势强度,ADX阈值设定为20。额外的过滤器检查方向指标(DI+和DI-)的对齐情况,以确认趋势方向。
-
ATR(真实波幅均值): 提供波动率测量,用于设置止损水平和通过追踪止损确定风险。
-
成交量SMA(成交量简单移动平均线): 通过比较当前成交量与20周期平均线,帮助确认交易信号强度。
交易入场条件设计严格,要求多重确认:
-
看涨入场:需要RSI出现背离(价格创新低而RSI不创新低),价格需高于指定的布林带水平,成交量和趋势条件满足,并通过风险回报比检验。
-
看跌入场:使用看涨入场的镜像逻辑,检查看跌背离,确保价格低于适当的布林带水平,并确认成交量、趋势强度和风险回报标准。
交易执行和退出策略同样精心设计:
- 动态止损:使用ATR值动态设置止损位置。
- 追踪止损:实施为收盘价的百分比(0.5%)。
- 多重退出条件:可基于RSI背离、均值回归(通过布林带中线)或ADX跌破阈值指示趋势减弱而触发提前平仓。
策略优势
-
多维信号确认:该策略最显著的优势在于要求多个不同类型的指标同时确认才会生成交易信号,大大减少了假信号概率。通过结合动量(RSI)、波动率(布林带)和趋势强度(ADX)指标,策略能够识别具有高概率成功的反转点。
-
灵活的过滤器系统:策略提供多个可选过滤器,使交易者能够根据不同市场环境调整策略严格程度。例如,成交量过滤器、ADX趋势对齐过滤器、布林带确认过滤器等,这些开关使策略具有高度可定制性。
-
全面的风险管理:策略集成了多层风险控制机制,包括ATR基础的止损、收盘价比例的追踪止损以及风险回报过滤器(确保潜在收益至少是风险的两倍)。这种全面的风险管理方法有助于在不利市场条件下保护资本。
-
自适应性强:由于使用了布林带和ATR等动态指标,策略能够根据当前市场波动性自动调整,无需手动干预。这使得策略在不同波动率环境下均能保持一致性。
-
多重退出条件:策略不仅关注入场点,还设计了多种智能退出机制,包括技术背离退出、均值回归退出和趋势转弱退出。这种多层次退出策略旨在锁定收益或在市场出现意外反转时最小化损失。
-
适合算法自动化:策略逻辑清晰,条件明确,非常适合编程实现和高频自动化交易。通过与交易机器人集成,可以实时执行交易,减少手动执行延迟,抓住快速市场机会。
策略风险
-
过度优化风险:策略使用多个参数和过滤器,可能存在过度优化(过拟合)的风险。如果参数选择过于针对特定历史数据,策略在实盘交易中可能表现不佳。解决方法是在多个时间周期和不同市场环境下进行回测,确保策略的稳健性。
-
虚假信号风险:尽管策略设计了多重过滤器,但在某些市场条件下,如高波动性或低流动性环境,仍可能产生虚假信号。建议使用模拟账户验证策略在实时市场中的表现,并根据需要调整过滤器设置。
-
延迟执行风险:策略依赖多个技术指标,可能导致信号确认时已错过最佳入场点。这在快速移动的市场中尤为明显。可以通过缩短某些指标的周期或优化信号触发逻辑来减轻这一风险。
-
市场环境依赖性:该策略在趋势明确的市场中表现最佳,但在横盘震荡或快速转向的市场中可能效果不佳。建议结合市场环境过滤器,在不适合的市场条件下暂停交易。
-
止损滑点风险:在波动性剧烈的市场中,ATR基础的止损可能因滑点而无法按预期执行。建议增加额外的风险控制措施,如最大损失限制或采用更保守的头寸规模管理。
-
技术依赖性风险:作为一个完全基于技术分析的策略,它忽略了基本面因素,这在重大新闻或经济事件发布期间可能导致错误信号。建议避免在重要经济数据发布前后交易,或结合基本面过滤器。
策略优化方向
-
动态参数调整:现有策略使用固定的参数设置(如RSI长度为8,布林带长度为20)。优化方向可以是实施动态参数调整机制,根据市场波动性自动调整这些参数。这样策略可以更好地适应变化的市场条件,例如在低波动市场可使用较短的布林带周期,高波动市场则使用较长周期。
-
市场环境分类:引入市场环境分类系统,自动识别当前市场是处于趋势、震荡还是过渡状态。根据不同的市场类型,策略可以自动启用或禁用特定过滤器,或调整风险管理参数。这将显著提高策略的自适应能力。
-
机器学习增强:集成机器学习算法来优化入场和出场决策。例如,可以使用监督学习模型预测信号的成功概率,或使用强化学习优化参数选择和风险管理策略。这有助于捕捉策略中可能未被明确编码的复杂模式。
-
多时间框架分析:增加多时间框架确认机制,例如要求更高时间框架的趋势方向与交易方向一致。这可以减少逆势交易的风险,提高入场点的质量。
-
自适应止损机制:当前策略使用固定的ATR倍数作为止损。可以实现更智能的止损机制,如基于市场波动率的动态ATR倍数,或基于支撑/阻力水平的止损位置设定。
-
整合情绪指标:在现有技术指标基础上,添加市场情绪指标,如VIX(波动率指数)或加密货币市场的恐惧与贪婪指数作为额外过滤器。这有助于避免在极端情绪市场中产生错误信号。
-
头寸规模优化:实施更复杂的头寸规模算法,基于信号强度、市场波动性和当前账户绩效动态调整交易规模。这可以在强信号时增加风险敞口,在不确定时减少风险。
总结
多指标联动反转点捕捉交易策略是一个设计精良的量化交易系统,通过整合多种技术指标来识别具有统计学优势的市场反转点。其核心优势在于多维信号确认、灵活的过滤系统和全面的风险管理,使其能够在各种市场环境中保持稳定性。
策略面临的主要挑战包括参数优化、虚假信号和市场适应性问题,但这些风险可以通过建议的优化方向得到缓解。通过引入动态参数调整、市场环境分类、机器学习增强和多时间框架分析等高级功能,策略的性能和适应性可以进一步提升。
总体而言,该策略为交易者提供了一个强大的框架,特别适合与交易机器人集成实现自动化执行。通过持续监控和优化,这个策略可以成为投资组合中的有价值工具,尤其在捕捉市场反转点和管理交易风险方面。对于有经验的交易者和量化分析师来说,这提供了一个坚实的基础,可以根据个人风险偏好和市场观点进行进一步定制。 ||
Overview
The Multi-Indicator Reversal Point Capture Trading Strategy is a quantitative trading approach designed specifically to identify potential market reversal points. This strategy cleverly combines momentum indicators, volatility measures, and trend alignment filters through multi-layered technical analysis to identify both bullish and bearish reversal signals. The core principle requires multiple market conditions to be simultaneously satisfied before entering a trade, ensuring signal reliability. The strategy integrates RSI for divergence detection, Bollinger Bands for volatility measurement, ADX and DMI for trend strength confirmation, ATR for risk control, and Volume SMA for trade volume confirmation. Through this organic combination of indicators, the strategy can identify trading opportunities with statistical advantages across different market environments.
Strategy Principles
The strategy operates on a multidimensional market analysis framework, primarily through the collaborative work of these technical indicators:
-
RSI (Relative Strength Index): Set to an 8-period length, primarily used to detect divergences between price and momentum. When price makes a new low while RSI doesn't, it may indicate a bullish reversal; conversely, when price makes a new high while RSI doesn't, it may signal a bearish reversal.
-
Bollinger Bands (BB): Set to a 20-period length with a standard deviation multiplier of 2. Used to measure market volatility and identify statistically extreme price levels. Price breaking above the upper band or below the lower band may indicate trend changes.
-
ADX (Average Directional Index) and DMI (Directional Movement Index): Used to quantify trend strength, with an ADX threshold set at 20. Additional filters check the alignment of directional indicators (DI+ and DI-) to confirm trend direction.
-
ATR (Average True Range): Provides volatility measurement used to set stop-loss levels and determine risk through trailing stops.
-
Volume SMA (Simple Moving Average of Volume): Helps confirm signal strength by comparing current volume with a 20-period average.
Trade entry conditions are designed with strict requirements for multiple confirmations:
-
Bullish Entry: Requires RSI divergence (price making a new low while RSI doesn't), price needs to be above the specified Bollinger Band level, volume and trend conditions must be met, and it must pass the risk-reward ratio test.
-
Bearish Entry: Uses mirror logic of the bullish entry, checking for bearish divergence, ensuring price is below the appropriate Bollinger Band level, and confirming volume, trend strength, and risk-reward criteria.
Trade execution and exit strategy are equally well-designed:
- Dynamic Stop-Loss: Uses ATR value to dynamically set stop-loss positions.
- Trailing Stops: Implemented as a percentage of closing price (0.5%).
- Multiple Exit Conditions: Can trigger early position closures based on RSI divergence, mean reversion (via Bollinger Band middle line), or ADX falling below threshold indicating weakening trend.
Strategy Advantages
-
Multidimensional Signal Confirmation: The most significant advantage of this strategy is requiring multiple different types of indicators to simultaneously confirm before generating a trade signal, greatly reducing the probability of false signals. By combining momentum (RSI), volatility (Bollinger Bands), and trend strength (ADX) indicators, the strategy can identify reversal points with a high probability of success.
-
Flexible Filter System: The strategy offers multiple optional filters, allowing traders to adjust the strategy's strictness according to different market environments. For example, volume filters, ADX trend alignment filters, Bollinger Band confirmation filters, etc., these toggles make the strategy highly customizable.
-
Comprehensive Risk Management: The strategy integrates multi-layered risk control mechanisms, including ATR-based stop-losses, closing price ratio trailing stops, and a risk-reward filter (ensuring potential reward is at least twice the risk). This comprehensive risk management approach helps protect capital under adverse market conditions.
-
Strong Adaptability: Due to the use of dynamic indicators such as Bollinger Bands and ATR, the strategy can automatically adjust according to current market volatility without manual intervention. This allows the strategy to maintain consistency across different volatility environments.
-
Multiple Exit Conditions: The strategy not only focuses on entry points but also designs multiple intelligent exit mechanisms, including technical divergence exits, mean reversion exits, and trend weakening exits. This multi-tiered exit strategy aims to lock in profits or minimize losses when the market unexpectedly reverses.
-
Suitable for Algorithmic Automation: The strategy logic is clear, conditions are explicit, making it very suitable for programming implementation and high-frequency automated trading. By integrating with trading bots, trades can be executed in real-time, reducing manual execution delays and capturing fast market opportunities.
Strategy Risks
-
Over-Optimization Risk: The strategy uses multiple parameters and filters, potentially risking over-optimization (overfitting). If parameter selection is too specific to historical data, the strategy may perform poorly in live trading. The solution is to backtest across multiple time periods and different market environments to ensure strategy robustness.
-
False Signal Risk: Despite the design of multiple filters, false signals may still occur under certain market conditions, such as high volatility or low liquidity environments. It is recommended to verify strategy performance in real-time markets using demo accounts and adjust filter settings as needed.
-
Delayed Execution Risk: The strategy relies on multiple technical indicators, which may result in signal confirmation after missing the optimal entry point. This is particularly evident in fast-moving markets. This risk can be mitigated by shortening certain indicator periods or optimizing signal triggering logic.
-
Market Environment Dependency: This strategy performs best in markets with clear trends but may be less effective in ranging or rapidly shifting markets. It is recommended to incorporate market environment filters and pause trading under unsuitable market conditions.
-
Stop-Loss Slippage Risk: In highly volatile markets, ATR-based stop-losses may not execute as expected due to slippage. It is recommended to add additional risk control measures, such as maximum loss limits or adopting more conservative position sizing management.
-
Technical Dependency Risk: As a strategy completely based on technical analysis, it ignores fundamental factors, which may lead to erroneous signals during major news or economic event releases. It is advisable to avoid trading before and after important economic data releases or incorporate fundamental filters.
Strategy Optimization Directions
-
Dynamic Parameter Adjustment: The existing strategy uses fixed parameter settings (such as RSI length of 8, Bollinger Band length of 20). An optimization direction could be implementing a dynamic parameter adjustment mechanism that automatically adjusts these parameters based on market volatility. This way, the strategy can better adapt to changing market conditions, for example using shorter Bollinger Band periods in low-volatility markets and longer periods in high-volatility markets.
-
Market Environment Classification: Introduce a market environment classification system that automatically identifies whether the current market is in a trending, ranging, or transitional state. Based on different market types, the strategy can automatically enable or disable specific filters or adjust risk management parameters. This would significantly enhance the strategy's adaptive capabilities.
-
Machine Learning Enhancement: Integrate machine learning algorithms to optimize entry and exit decisions. For example, supervised learning models can be used to predict the success probability of signals, or reinforcement learning to optimize parameter selection and risk management strategies. This helps capture complex patterns that may not be explicitly coded in the strategy.
-
Multi-Timeframe Analysis: Add multi-timeframe confirmation mechanisms, such as requiring the trend direction of higher timeframes to be consistent with the trading direction. This can reduce the risk of counter-trend trading and improve the quality of entry points.
-
Adaptive Stop-Loss Mechanism: The current strategy uses a fixed ATR multiplier as a stop-loss. More intelligent stop-loss mechanisms can be implemented, such as dynamic ATR multipliers based on market volatility, or stop-loss positions based on support/resistance levels.
-
Integration of Sentiment Indicators: Building on existing technical indicators, add market sentiment indicators such as VIX (Volatility Index) or the Fear and Greed Index for cryptocurrency markets as additional filters. This helps avoid generating erroneous signals in extreme sentiment markets.
-
Position Size Optimization: Implement more sophisticated position sizing algorithms that dynamically adjust trading size based on signal strength, market volatility, and current account performance. This can increase risk exposure on strong signals and reduce risk during uncertainty.
Summary
The Multi-Indicator Reversal Point Capture Trading Strategy is a well-designed quantitative trading system that integrates multiple technical indicators to identify market reversal points with statistical advantages. Its core strengths lie in multidimensional signal confirmation, flexible filtering systems, and comprehensive risk management, enabling it to maintain stability across various market environments.
The main challenges faced by the strategy include parameter optimization, false signals, and market adaptability issues, but these risks can be mitigated through the suggested optimization directions. By introducing advanced features such as dynamic parameter adjustment, market environment classification, machine learning enhancement, and multi-timeframe analysis, the strategy's performance and adaptability can be further improved.
Overall, this strategy provides traders with a powerful framework particularly suitable for integration with trading bots for automated execution. Through continuous monitoring and optimization, this strategy can become a valuable tool in investment portfolios, especially for capturing market reversal points and managing trading risks. For experienced traders and quantitative analysts, this provides a solid foundation that can be further customized according to individual risk preferences and market views.[/trans]
Source (PineScript)
/*backtest
start: 2024-04-07 00:00:00
end: 2025-04-06 00:00:00
period: 1d
basePeriod: 1d
exchanges: [{"eid":"Futures_Binance","currency":"ETH_USDT"}]
*/

//@version=6
strategy("Reversal Trading Bot Strategy[BullByte]", overlay=true, margin_long=100, margin_short=100)

// Inputs
rsiLength = input(8)
bbLength = input(20)
adxThreshold = input(20)

// Toggle Filters
volumeFilter = input.bool(false, "Volume Filter (2x SMA)")
adxAlignmentFilter = input.bool(false, "ADX Trend Alignment")
bbConfirmationFilter = input.bool(false, "BB Close Confirmation")
rsiDivergenceExit = input.bool(false, "RSI Divergence Exit")
bbMeanReversionExit = input.bool(false, "BB Mean Reversion Exit")
riskRewardFilter = input.bool(false, "Risk/Reward 2:1")
candlePatternFilter = input.bool(false, "Candle Movement(2%)")
adxTrendExit = input.bool(false, "ADX Trend Exit")

// Indicators
rsi = ta.rsi(close, rsiLength)
[diPlus, diMinus, adx] = ta.dmi(14, 14)
[upperBB, middleBB, lowerBB] = ta.bb(close, bbLength, 2)
atr = ta.atr(14)
volumeSma = ta.sma(volume, 20)

// Bullish Conditions
bullishDiv = ta.lowest(close, 5) < ta.lowest(close, 5)[1] and rsi > ta.lowest(rsi, 5)[1]
bullishBB = bbConfirmationFilter ? close > upperBB : close > lowerBB
volumeConditionBullish = volumeFilter ? volume >= 2 * volumeSma : volume > volumeSma
adxBullish = adxAlignmentFilter ? diPlus > diMinus : true
bullishCandle = candlePatternFilter ? (close - open)/open >= 0.02 : true
riskRewardBullish = riskRewardFilter ? (upperBB - close) >= 2 * atr : true

bullishEntry = bullishDiv and bullishBB and volumeConditionBullish and adx > adxThreshold and adxBullish and bullishCandle and riskRewardBullish

// Bearish Conditions
bearishDiv = ta.highest(close, 5) > ta.highest(close, 5)[1] and rsi < ta.highest(rsi, 5)[1]
bearishBB = bbConfirmationFilter ? close < lowerBB : close < upperBB
volumeConditionBearish = volumeFilter ? volume >= 2 * volumeSma : volume > volumeSma
adxBearish = adxAlignmentFilter ? diMinus > diPlus : true
bearishCandle = candlePatternFilter ? (open - close)/close >= 0.02 : true
riskRewardBearish = riskRewardFilter ? (close - lowerBB) >= 2 * atr : true

bearishEntry = bearishDiv and bearishBB and volumeConditionBearish and adx > adxThreshold and adxBearish and bearishCandle and riskRewardBearish

// Execute Trades
if (bullishEntry)
    strategy.entry("Long", strategy.long)
    strategy.exit("Exit Long", "Long", stop=low - atr, trail_points=close*0.005, trail_offset=close*0.005)

if (bearishEntry)
    strategy.entry("Short", strategy.short)
    strategy.exit("Exit Short", "Short", stop=high + atr, trail_points=close*0.005, trail_offset=close*0.005)

// Exit Conditions
if (strategy.position_size > 0)
    if (rsiDivergenceExit and rsi < rsi[1] and close > close[1])
        strategy.close("Long", "RSI Div Exit")
    if (bbMeanReversionExit and close < middleBB)
        strategy.close("Long", "BB Mean Rev Exit")
    if (adxTrendExit and adx < adxThreshold and diPlus < diMinus)
        strategy.close("Long", "ADX Trend Exit")

if (strategy.position_size < 0)
    if (rsiDivergenceExit and rsi > rsi[1] and close < close[1])
        strategy.close("Short", "RSI Div Exit")
    if (bbMeanReversionExit and close > middleBB)
        strategy.close("Short", "BB Mean Rev Exit")
    if (adxTrendExit and adx < adxThreshold and diMinus < diPlus)
        strategy.close("Short", "ADX Trend Exit")
Detail
https://www.fmz.com/strategy/489652
Last Modified
2025-04-07 13:32:55