
19 KiB
Name
多指标综合订单流交易自动化均衡策略系统-Multi-Indicator-Integrated-Order-Flow-Trading-Automation-Equilibrium-Strategy-System
Author
ianzeng123
Strategy Description
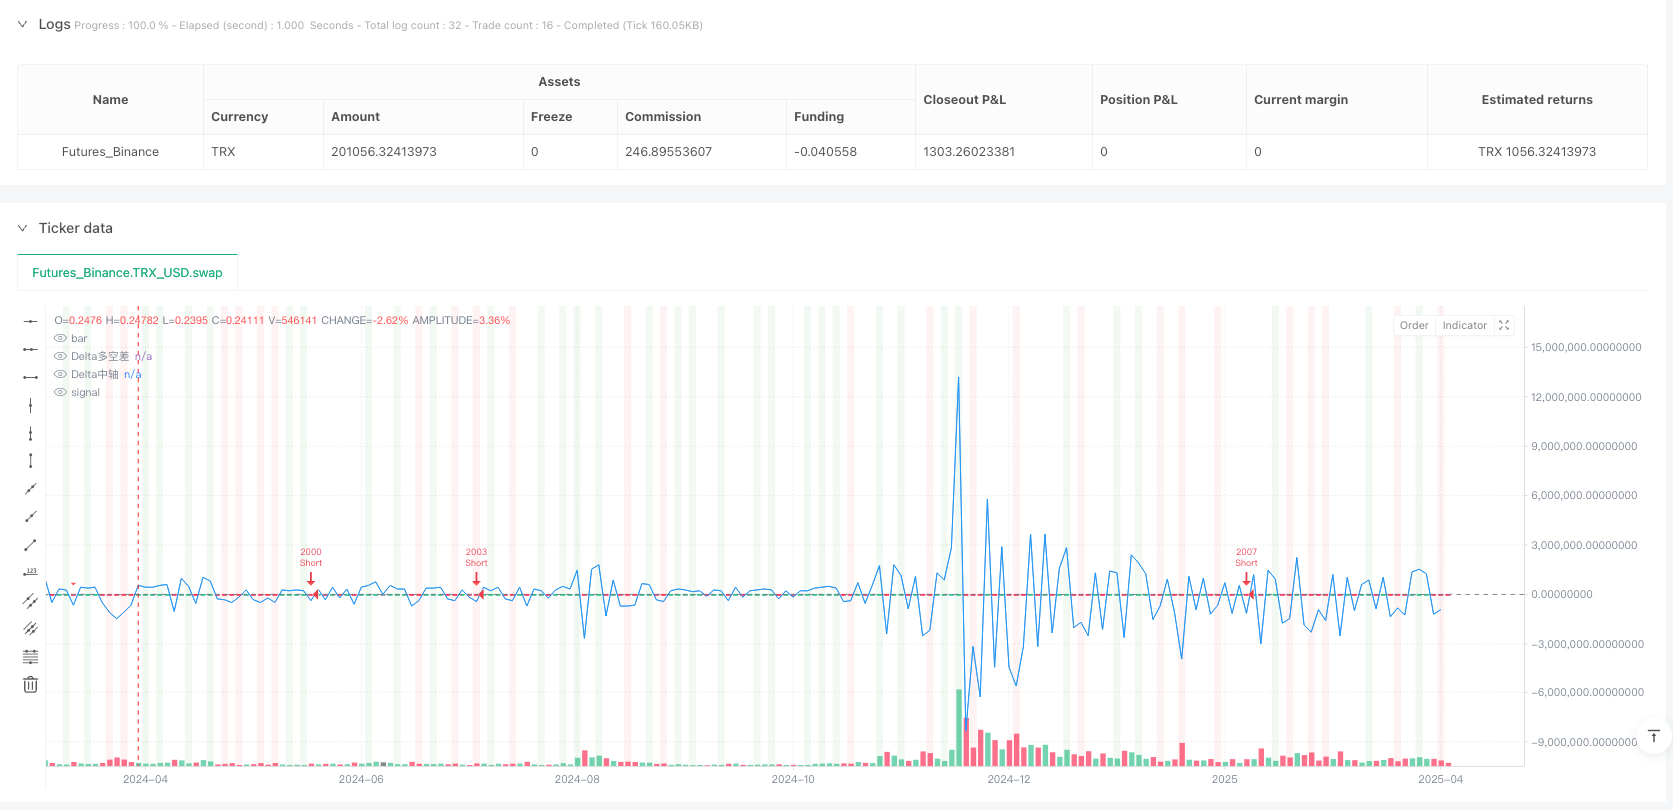
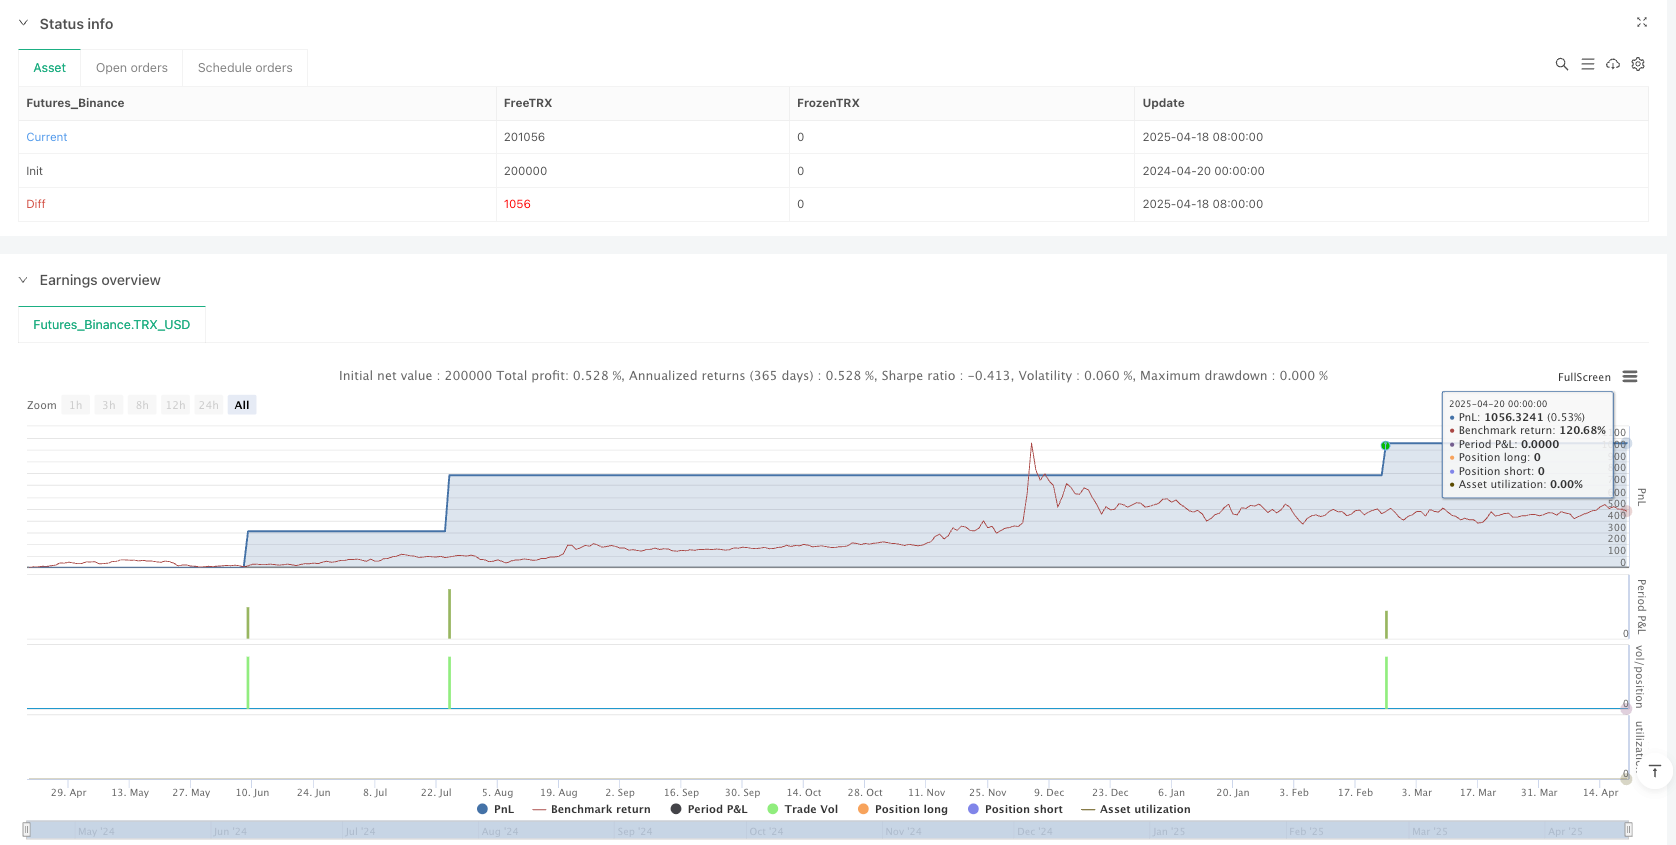
[trans]
概述
订单流交易策略系统是一种基于市场微观结构分析的量化交易方法,通过深入分析每个价位的主动买卖单量,捕捉市场供需力量的动态变化。该策略整合了订单流的核心元素,包括Delta多空差值、POC成交量最大价位、供需失衡比率以及量能变化特征,构建了一套全面的交易系统。本策略通过识别市场中的失衡堆积、微单反转和吸收突破等高胜率信号,结合精确的风险控制机制,旨在捕捉趋势初期和反转点位,实现稳定的交易收益。
策略原理
该策略的核心原理是通过解析市场内部的供需结构,识别多空力量转换的关键时刻。具体实现机制如下:
-
订单流指标计算:
- 模拟主动买卖量的计算,使用涨跌K线对应的成交量作为简化替代
- Delta值计算:上升成交量(upVol)与下降成交量(downVol)的差值
- POC(成交量最大价位):通过回溯指定周期内的最大成交量来确定
- 供需失衡判定:当买入量与卖出量比例超过设定阈值(如3:1)时,判定为失衡
- 堆积失衡计算:连续多个K线出现同向失衡时,形成堆积失衡区域
-
交易信号生成:
- 微单反转信号:通过识别短期内成交量最低点与Delta方向组合判断
- 失衡堆积支撑/阻力:当连续多个K线形成同向失衡时形成
- 吸收与突破信号:区间震荡后成交量显著放大,预示方向性突破
-
入场逻辑:
- 多单条件:失衡堆积支撑+微单买入反转+Delta正向放大,或者吸收后Delta放大
- 空单条件:失衡堆积阻力+微单卖出反转+Delta负向放大,或者吸收后Delta负向放大
-
风险管理:
- 基于最小波动单位(MinTick)设置止损和止盈
- 采用百分比仓位管理,控制单笔风险敞口
策略优势
-
微观市场解析能力:通过分析订单流内部结构,能够识别传统K线图无法显示的价格内部博弈细节,提前捕捉市场转折点。
-
实时性强:直接基于当前市场行为做出判断,而非依赖滞后指标,能够及时响应市场变化。
-
多维信号确认:结合多个订单流指标(Delta、失衡、POC、微单、堆积)形成多重确认机制,提高信号可靠性。
-
自适应市场结构:不依赖固定价格水平,而是根据实时供需动态变化识别支撑阻力,适应性更强。
-
精确的风险控制:基于市场微观结构设定止损位置,避免随意止损,提高资金效率。
-
可视化反馈系统:通过绘制Delta曲线、信号标记和背景色变化,直观展示策略运行状态和市场结构。
-
参数可调整性:提供多个可自定义参数(Delta阈值、失衡比率、堆积数等),可根据不同市场特性进行优化。
策略风险
-
数据依赖性风险:
- 策略使用K线模拟订单流数据,而非真实Level2逐笔数据,可能存在一定偏差
- 解决方法:在具备条件时接入真实逐笔交易数据,提高数据准确性
-
市场环境适应性风险:
- 在极低波动或极端单向行情中,订单流信号可能失效或产生假信号
- 解决方法:增加市场环境过滤条件,在不适合的市场环境下自动停止交易
-
参数敏感性风险:
- 不同参数组合可能对策略表现产生显著影响,过度拟合历史数据风险
- 解决方法:采用前向验证和稳健参数设置,避免过度优化
-
信号时效性风险:
- 订单流信号通常需要及时执行,延迟执行可能导致效果大打折扣
- 解决方法:优化执行系统,确保信号生成后快速执行
-
流动性风险:
- 策略在低流动性市场表现可能不佳,成交量不足影响订单流分析
- 解决方法:限制交易在流动性充足的时段和品种中进行
策略优化方向
-
订单流数据精确度提升:
- 接入真实Level2逐笔数据,替代当前的K线模拟方法
- 优化原因:提高订单流分析的准确性,捕捉更细微的市场结构变化
-
多时间周期协同分析:
- 整合多个时间周期的订单流信号,形成时间框架协同确认机制
- 优化原因:减少单一时间周期可能产生的假信号,提高交易确定性
-
机器学习模型增强:
- 引入机器学习算法,自动识别最有效的订单流模式和参数组合
- 优化原因:挖掘更复杂的订单流模式,提升模型适应能力和预测准确性
-
市场波动性自适应机制:
- 根据市场波动性动态调整Delta阈值和失衡比率等参数
- 优化原因:适应不同市场条件,保持策略在各种环境下的稳定性
-
微单识别算法改进:
- 开发更精确的微单识别算法,区分真实的量能萎缩与随机波动
- 优化原因:提高微单反转信号的准确率,减少假信号
-
复合信号权重系统:
- 建立各类订单流信号的动态权重系统,根据历史表现调整信号重要性
- 优化原因:优化多信号组合效果,重点关注当前市场环境下最有效的信号类型
总结
多指标综合订单流交易自动化均衡策略系统通过深入分析市场微观结构,实现了对传统技术分析的有效补充与突破。该策略不仅关注价格变动,更关注价格背后的供需力量对比,能够识别市场情绪转变和主力资金动向。通过整合Delta多空差、POC成交量最大价位、失衡比率、堆积失衡和微单反转等多维指标,构建了一套全面的交易决策系统。
策略的核心优势在于对市场微观结构的解析能力和实时性,能够捕捉传统图表难以发现的交易机会。同时,通过严格的风险控制和精确的入场出场机制,在稳健基础上追求较高的盈亏比。虽然存在数据依赖性和参数敏感性等风险,但通过持续优化和完善,特别是在订单流数据质量、多周期协同和自适应参数等方面的改进,能够进一步提升策略的稳定性和适应性。
总的来说,该策略代表了一种从市场微观结构出发的交易思路,通过"看透"价格表象,直接分析市场内部供需力量,为量化交易提供了一个独特而有效的方法论。 ||
Overview
The Order Flow Trading Strategy System is a quantitative trading approach based on market microstructure analysis, which captures the dynamic changes in market supply and demand forces by analyzing active buy and sell volumes at each price level. This strategy integrates core elements of order flow, including Delta (difference between buying and selling pressure), POC (Point of Control), supply-demand imbalance ratio, and volume characteristic changes to build a comprehensive trading system. By identifying high-probability signals such as stacked imbalances, micro order reversals, and absorption breakouts, combined with precise risk control mechanisms, this strategy aims to capture trend initiations and reversal points to achieve stable trading returns.
Strategy Principles
The core principle of this strategy is to decode the internal supply-demand structure of the market and identify key moments of power shifts between buyers and sellers. The implementation mechanisms are as follows:
-
Order Flow Indicator Calculation:
- Simulation of active buy/sell volumes using the volume of rising/falling candles as a simplified substitute
- Delta value calculation: Difference between up volume (upVol) and down volume (downVol)
- POC (Point of Control): Determined by identifying maximum volume over a specified lookback period
- Supply-demand imbalance determination: When the ratio of buy to sell volume exceeds a set threshold (e.g., 3:1)
- Stacked imbalance calculation: Formation of stacked imbalance zones when multiple consecutive candles show imbalances in the same direction
-
Trading Signal Generation:
- Micro order reversal signals: Identified by combining the lowest volume point in the short term with Delta direction
- Stacked imbalance support/resistance: Formed when multiple consecutive candles create imbalances in the same direction
- Absorption and breakout signals: Significant volume expansion after range consolidation, indicating directional breakouts
-
Entry Logic:
- Long conditions: Stacked imbalance support + micro buy reversal + positive Delta expansion, or absorption followed by Delta expansion
- Short conditions: Stacked imbalance resistance + micro sell reversal + negative Delta expansion, or absorption followed by negative Delta expansion
-
Risk Management:
- Stop-loss and take-profit based on minimum tick movement (MinTick)
- Percentage-based position sizing to control single-trade risk exposure
Strategy Advantages
-
Microstructure Analysis Capability: By analyzing the internal structure of order flow, the strategy can identify battle details within price that traditional candlestick charts cannot display, capturing market turning points in advance.
-
Strong Real-time Response: Makes judgments directly based on current market behavior rather than relying on lagging indicators, enabling timely responses to market changes.
-
Multi-dimensional Signal Confirmation: Combines multiple order flow indicators (Delta, imbalance, POC, micro orders, stacking) to form a multi-confirmation mechanism, improving signal reliability.
-
Adaptive Market Structure Recognition: Does not rely on fixed price levels, but identifies support and resistance based on real-time supply-demand dynamics, providing greater adaptability.
-
Precise Risk Control: Sets stop-loss positions based on market microstructure, avoiding arbitrary stops and improving capital efficiency.
-
Visual Feedback System: Provides intuitive display of strategy operation status and market structure through Delta curve plotting, signal marking, and background color changes.
-
Parameter Adjustability: Offers multiple customizable parameters (Delta threshold, imbalance ratio, stacking count, etc.) that can be optimized according to different market characteristics.
Strategy Risks
-
Data Dependency Risk:
- The strategy uses candlestick data to simulate order flow rather than real Level 2 tick-by-tick data, which may introduce certain biases
- Solution: Connect to real tick-by-tick trading data when conditions permit to improve data accuracy
-
Market Environment Adaptability Risk:
- Order flow signals may fail or generate false signals in extremely low volatility or one-sided market conditions
- Solution: Add market environment filtering conditions to automatically stop trading in unsuitable market environments
-
Parameter Sensitivity Risk:
- Different parameter combinations may significantly impact strategy performance, risking overfitting to historical data
- Solution: Use forward validation and robust parameter settings to avoid over-optimization
-
Signal Timeliness Risk:
- Order flow signals typically require prompt execution; delayed execution may significantly reduce effectiveness
- Solution: Optimize the execution system to ensure rapid execution after signal generation
-
Liquidity Risk:
- Strategy performance may be poor in low-liquidity markets where insufficient volume affects order flow analysis
- Solution: Restrict trading to time periods and instruments with sufficient liquidity
Strategy Optimization Directions
-
Order Flow Data Precision Improvement:
- Connect to real Level 2 tick data to replace the current candlestick simulation method
- Optimization rationale: Improve the accuracy of order flow analysis to capture more subtle market structure changes
-
Multi-timeframe Collaborative Analysis:
- Integrate order flow signals from multiple timeframes to form a time-frame collaborative confirmation mechanism
- Optimization rationale: Reduce false signals that may be generated by a single timeframe and increase trading certainty
-
Machine Learning Enhancement:
- Introduce machine learning algorithms to automatically identify the most effective order flow patterns and parameter combinations
- Optimization rationale: Discover more complex order flow patterns and improve model adaptability and prediction accuracy
-
Market Volatility Adaptive Mechanism:
- Dynamically adjust parameters such as Delta threshold and imbalance ratio based on market volatility
- Optimization rationale: Adapt to different market conditions and maintain strategy stability across various environments
-
Micro Order Identification Algorithm Improvement:
- Develop more precise micro order identification algorithms to distinguish between genuine volume exhaustion and random fluctuations
- Optimization rationale: Improve the accuracy of micro order reversal signals and reduce false signals
-
Composite Signal Weighting System:
- Establish a dynamic weighting system for various order flow signals, adjusting signal importance based on historical performance
- Optimization rationale: Optimize multi-signal combination effects and focus on the most effective signal types in the current market environment
Summary
The Multi-Indicator Integrated Order Flow Trading Automation Equilibrium Strategy System provides an effective supplement and breakthrough to traditional technical analysis by deeply analyzing market microstructure. The strategy focuses not only on price movements but also on the supply-demand power balance behind prices, enabling it to identify market sentiment shifts and institutional money flow. By integrating multi-dimensional indicators such as Delta, POC, imbalance ratio, stacked imbalances, and micro order reversals, it builds a comprehensive trading decision system.
The core advantages of the strategy lie in its ability to decode market microstructure and its real-time nature, capturing trading opportunities that traditional charts may miss. Meanwhile, through strict risk control and precise entry and exit mechanisms, it pursues a high reward-to-risk ratio on a solid foundation. Although there are risks such as data dependency and parameter sensitivity, through continuous optimization and improvement, especially in areas like order flow data quality, multi-timeframe collaboration, and adaptive parameters, the strategy's stability and adaptability can be further enhanced.
In summary, this strategy represents a trading approach that starts from market microstructure, "seeing through" price appearances to directly analyze the internal supply-demand forces in the market, providing a unique and effective methodology for quantitative trading.[/trans]
Source (PineScript)
/*backtest
start: 2024-04-20 00:00:00
end: 2025-04-20 00:00:00
period: 2d
basePeriod: 2d
exchanges: [{"eid":"Futures_Binance","currency":"TRX_USD"}]
*/

//@version=5
strategy("订单流轨迹自动交易脚本", overlay=true, margin_long=100, margin_short=100, default_qty_type=strategy.percent_of_equity, default_qty_value=10)

// === 参数设置 ===
deltaThreshold = input.int(100, "Delta阈值(多空失衡)", minval=1)
imbalanceRatio = input.float(3.0, "失衡比率(如3:1)", minval=1)
stackedImbalanceBars = input.int(2, "连续失衡堆积数", minval=1)
lookback = input.int(20, "POC&支撑阻力回溯K线数", minval=5)
stoplossTicks = input.int(2, "止损跳数", minval=1)
takeprofitTicks = input.int(4, "止盈跳数", minval=1)

// === 订单流核心指标 ===
// 模拟主动买卖量(真实逐笔需Level2数据,此处用tick替代)
upVol = volume * (close > open ? 1 : 0)
downVol = volume * (close < open ? 1 : 0)
delta = upVol - downVol

// 计算POC(本K线最大成交量价位,简化为收盘价附近最大成交量)
var float poc = na
if bar_index > lookback
    poc := ta.highestbars(volume, lookback) == 0 ? close : na

// 失衡判定
imbalance = upVol > downVol * imbalanceRatio ? 1 : downVol > upVol * imbalanceRatio ? -1 : 0

// 堆积失衡(连续多K线同一方向失衡)
var int stackedImbalance = 0
if imbalance != 0
    stackedImbalance := imbalance == nz(stackedImbalance[1]) ? stackedImbalance + imbalance : imbalance
else
    stackedImbalance := 0

// === 交易信号 ===
// 顶部/底部微单(趋势末端量能萎缩,反转信号)
microBuy = ta.lowest(volume, 3) == volume and delta < 0
microSell = ta.highest(volume, 3) == volume and delta > 0

// 失衡堆积支撑/阻力
longSupport = stackedImbalance >= stackedImbalanceBars and imbalance == 1
shortResistance = stackedImbalance <= -stackedImbalanceBars and imbalance == -1

// 吸收与主动出击(区间震荡后放量突破)
absorption = ta.lowest(volume, lookback) == volume[1] and volume > volume[1] * 2

// === 交易逻辑 ===
// 多单:失衡堆积支撑+微单反转+delta放大
enterLong = (longSupport and microBuy and delta > deltaThreshold) or (absorption and delta > deltaThreshold)
if enterLong
    strategy.entry("Long", strategy.long)
    strategy.exit("Long Exit", "Long", stop=close-stoplossTicks*syminfo.mintick, limit=close+takeprofitTicks*syminfo.mintick)

// 空单:失衡堆积阻力+微单反转+delta放大
enterShort = (shortResistance and microSell and delta < -deltaThreshold) or (absorption and delta < -deltaThreshold)
if enterShort
    strategy.entry("Short", strategy.short)
    strategy.exit("Short Exit", "Short", stop=close+stoplossTicks*syminfo.mintick, limit=close-takeprofitTicks*syminfo.mintick)

// === 画图可视化 ===
plotshape(enterLong, title="多单信号", location=location.belowbar, color=color.green, style=shape.triangleup, size=size.small)
plotshape(enterShort, title="空单信号", location=location.abovebar, color=color.red, style=shape.triangledown, size=size.small)
plot(delta, color=color.blue, title="Delta多空差")
hline(0, "Delta中轴", color=color.gray)
bgcolor(longSupport ? color.new(color.green, 90) : na)
bgcolor(shortResistance ? color.new(color.red, 90) : na)

// === 说明提示 ===
var table info = table.new(position.top_right, 1, 7, border_width=1)
if bar_index % 10 == 0
    table.cell(info, 0, 0, "订单流轨迹自动交易脚本", bgcolor=color.yellow)
    table.cell(info, 0, 1, "Delta: " + str.tostring(delta))
    table.cell(info, 0, 2, "POC: " + str.tostring(poc))
    table.cell(info, 0, 3, "失衡: " + str.tostring(imbalance))
    table.cell(info, 0, 4, "堆积失衡: " + str.tostring(stackedImbalance))
    table.cell(info, 0, 5, "微单反转: " + str.tostring(microBuy ? "多" : microSell ? "空" : "无"))
    table.cell(info, 0, 6, "吸收突破: " + str.tostring(absorption ? "是" : "否"))
Detail
https://www.fmz.com/strategy/491509
Last Modified
2025-04-21 16:05:15