
14 KiB
Name
多指标综合型动态交易策略-Multi-Indicator-Dynamic-Trading-Strategy
Author
ChaoZhang
Strategy Description
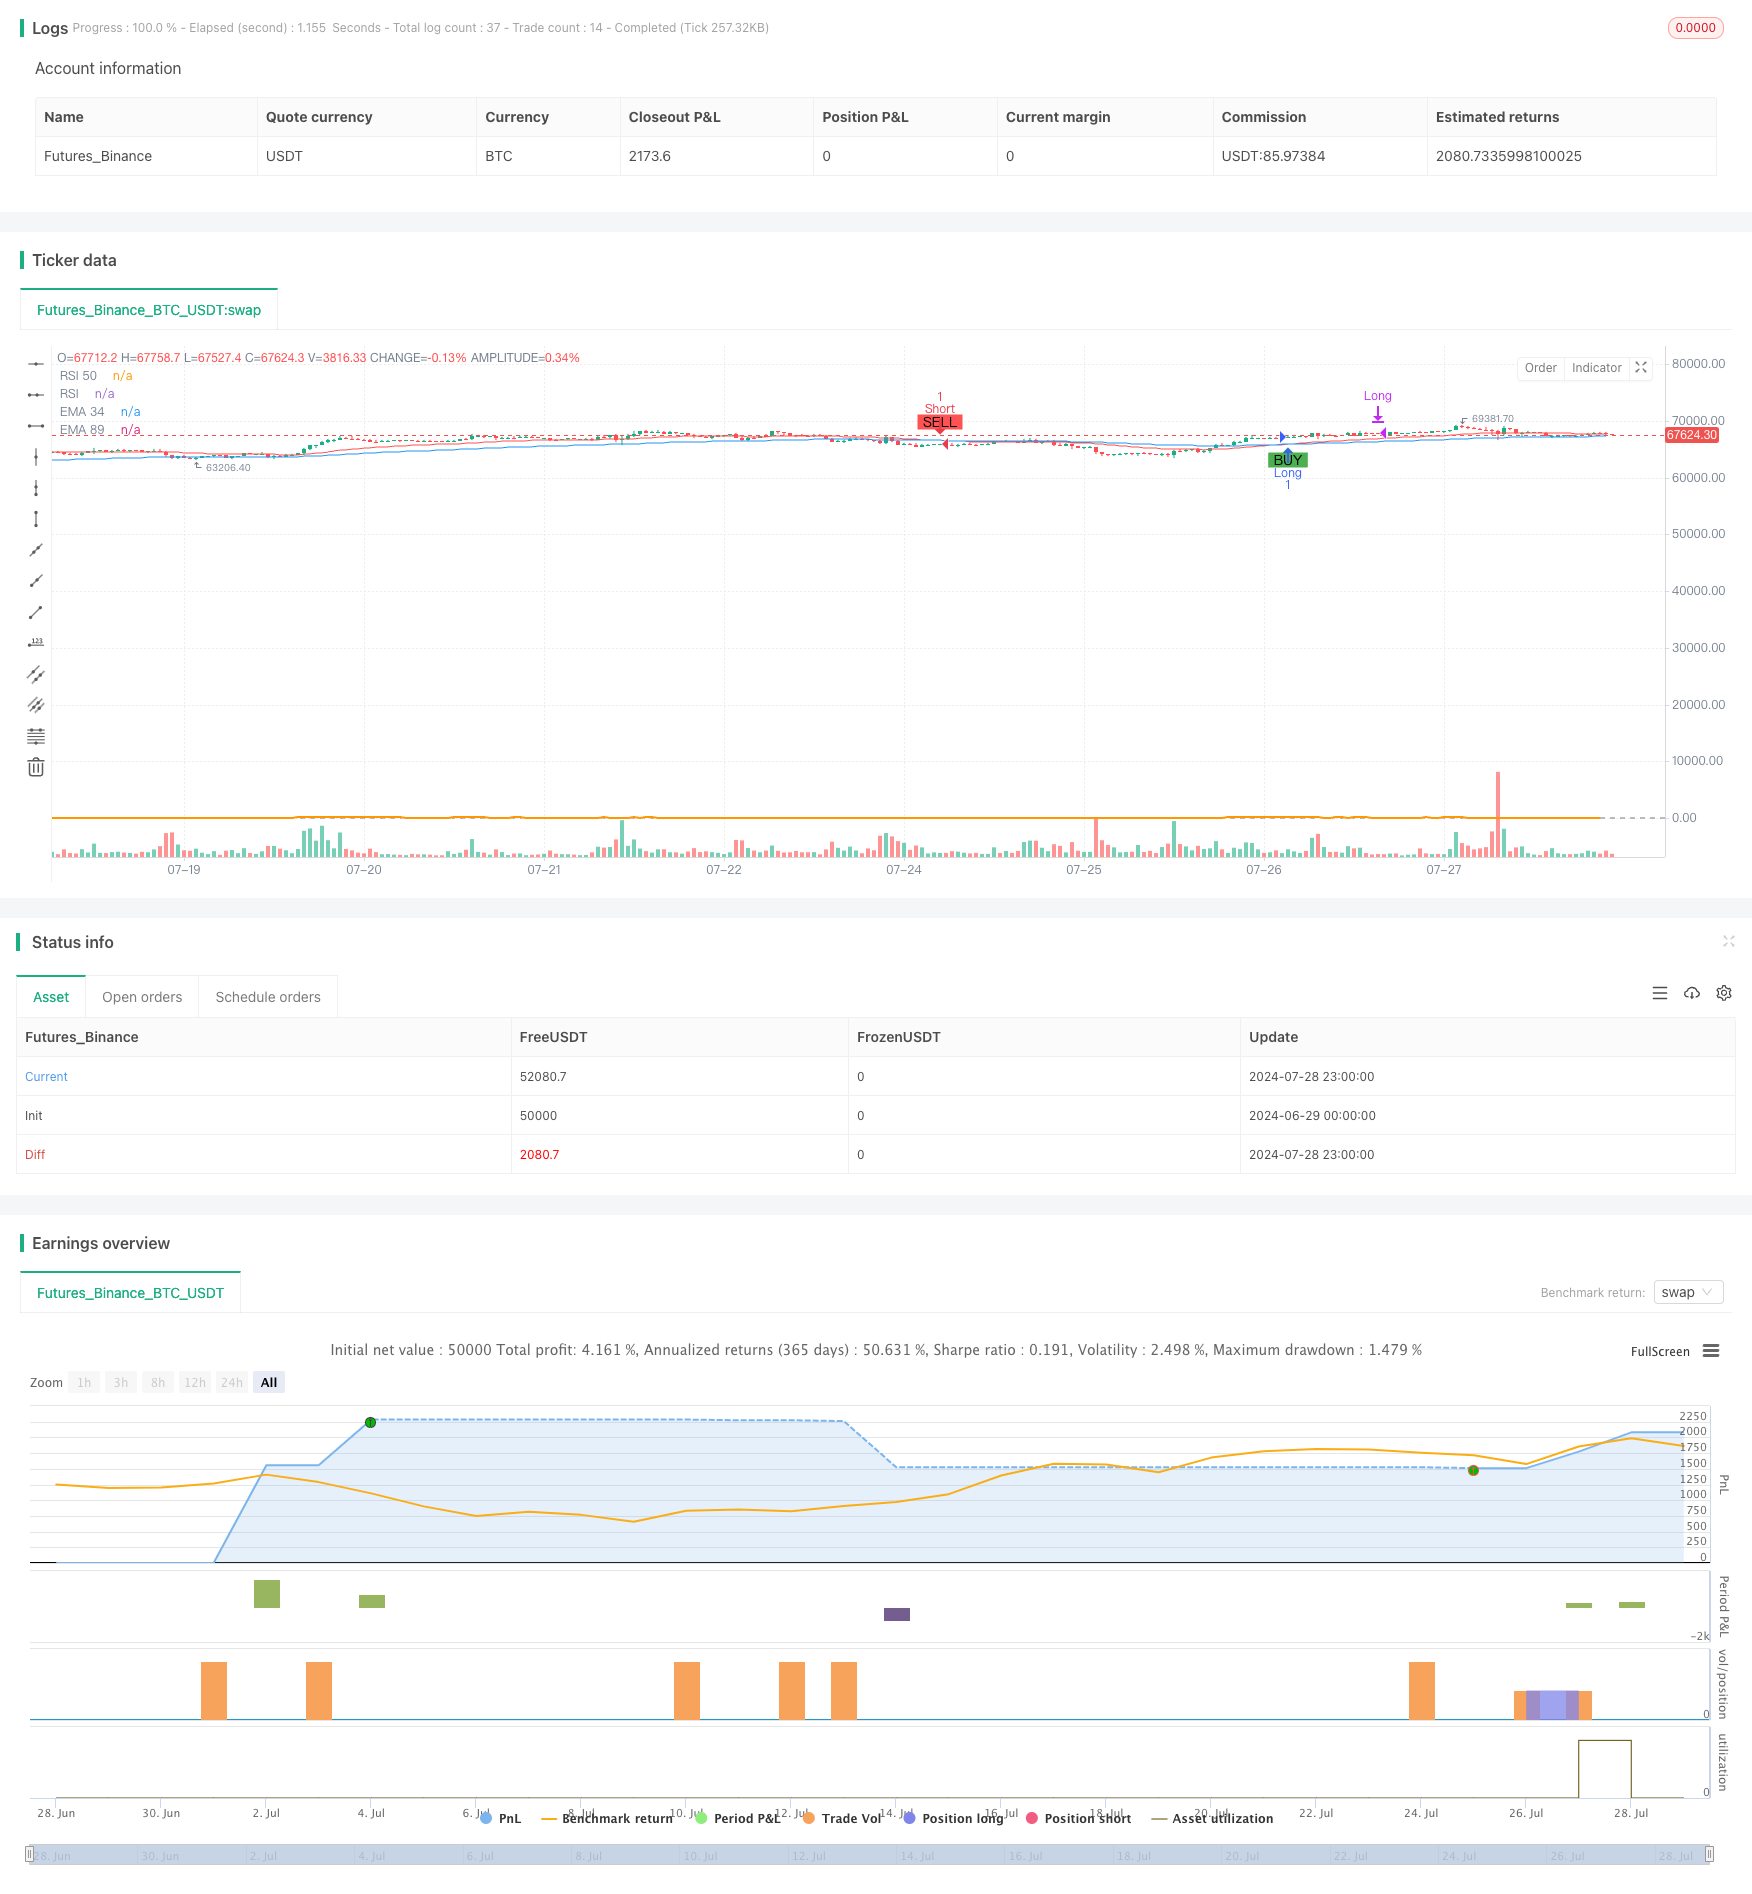
[trans]
概述
这个策略是一个基于多个技术指标的综合交易系统,主要利用指数移动平均线(EMA)、相对强弱指数(RSI)和交易量来生成交易信号并管理仓位。该策略通过EMA交叉来确定市场趋势,同时使用RSI指标来判断超买超卖情况,并结合交易量来确认信号强度。此外,策略还包含了动态止盈止损机制和固定持仓时间限制,以控制风险和优化交易表现。
策略原理
-
交易信号生成:
- 多头入场:EMA34上穿EMA89,且RSI大于30
- 空头入场:EMA34下穿EMA89,且RSI小于70
-
动态止盈止损:
- 当交易量大于20根K线平均交易量的3倍时,更新止盈止损价格
- 止盈止损价格设置为高交易量出现时的收盘价
-
固定持仓时间:
- 无论盈亏,在开仓后15根K线强制平仓
-
EMA止损:
- 使用EMA34作为动态止损线
-
交易量确认:
- 使用高交易量条件来确认信号强度和更新止盈止损价格
策略优势
-
多指标协同:结合EMA、RSI和交易量,全面分析市场情况,提高信号可靠性。
-
动态风险管理:根据市场波动实时调整止盈止损,适应不同市场环境。
-
固定持仓时间:避免长期持仓带来的风险,控制每笔交易的暴露时间。
-
EMA动态止损:利用均线作为动态支撑阻力,提供更灵活的止损保护。
-
交易量确认:利用交易量突破来确认信号强度,提高交易的准确性。
-
可视化辅助:在图表上标注买卖信号和关键价格水平,便于分析和决策。
策略风险
-
震荡市风险:在横盘震荡市场中,EMA交叉可能产生频繁的虚假信号。
-
RSI阈值固定:固定的RSI阈值可能不适用于所有市场环境。
-
交易量阈值敏感性:3倍平均交易量的阈值可能过高或过低,需要根据具体市场调整。
-
固定持仓时间限制:15根K线的固定平仓时间可能导致过早结束盈利交易。
-
止盈止损价格设置:以高交易量出现时的收盘价作为止盈止损价格可能不够优化。
策略优化方向
-
动态RSI阈值:根据市场波动性自动调整RSI的超买超卖阈值。
-
优化交易量阈值:引入自适应机制,根据历史数据动态调整交易量突破倍数。
-
改进持仓时间管理:结合趋势强度和盈利情况,动态调整最大持仓时间。
-
优化止盈止损设置:考虑引入ATR指标,根据市场波动性动态设置止盈止损价格。
-
增加趋势过滤器:引入长周期EMA或趋势指标,避免在主要趋势相反的方向交易。
-
引入价格行为分析:结合K线形态和支撑阻力水平,提高入场和出场的精确度。
-
考虑加入回撤控制:设置最大回撤限制,在达到特定回撤水平时强制平仓。
总结
这个多指标综合型动态交易策略通过结合EMA、RSI和交易量,创建了一个全面的交易系统。它不仅能够捕捉市场趋势,还能通过动态止盈止损和固定持仓时间来管理风险。策略的优势在于其多维度分析和灵活的风险管理,但同时也面临着市场环境变化带来的挑战。通过进一步优化RSI阈值、交易量判断标准、持仓时间管理以及止盈止损设置,该策略有潜力在不同市场环境中取得更好的表现。最终,这个策略为交易者提供了一个可靠的框架,可以根据个人交易风格和市场特点进行定制和改进。
||
Overview
This strategy is a comprehensive trading system based on multiple technical indicators, primarily utilizing Exponential Moving Averages (EMA), Relative Strength Index (RSI), and trading volume to generate trading signals and manage positions. The strategy determines market trends through EMA crossovers, uses the RSI indicator to judge overbought and oversold conditions, and combines trading volume to confirm signal strength. Additionally, the strategy includes dynamic take-profit and stop-loss mechanisms, as well as a fixed holding time limit to control risk and optimize trading performance.
Strategy Principles
-
Trade Signal Generation:
- Long Entry: EMA34 crosses above EMA89, and RSI is greater than 30
- Short Entry: EMA34 crosses below EMA89, and RSI is less than 70
-
Dynamic Take-Profit and Stop-Loss:
- Updates take-profit and stop-loss prices when trading volume is greater than 3 times the average volume of the last 20 candles
- Sets take-profit and stop-loss prices to the closing price when high volume occurs
-
Fixed Holding Time:
- Forces position closure after 15 candles, regardless of profit or loss
-
EMA Stop-Loss:
- Uses EMA34 as a dynamic stop-loss line
-
Volume Confirmation:
- Uses high volume conditions to confirm signal strength and update take-profit and stop-loss prices
Strategy Advantages
-
Multi-Indicator Synergy: Combines EMA, RSI, and volume for comprehensive market analysis, improving signal reliability.
-
Dynamic Risk Management: Adjusts take-profit and stop-loss in real-time based on market volatility, adapting to different market environments.
-
Fixed Holding Time: Avoids risks associated with long-term holdings, controlling exposure time for each trade.
-
EMA Dynamic Stop-Loss: Utilizes moving averages as dynamic support and resistance, providing more flexible stop-loss protection.
-
Volume Confirmation: Uses volume breakouts to confirm signal strength, increasing trade accuracy.
-
Visual Aids: Annotates buy/sell signals and key price levels on the chart, facilitating analysis and decision-making.
Strategy Risks
-
Choppy Market Risk: EMA crossovers may produce frequent false signals in sideways, volatile markets.
-
Fixed RSI Thresholds: The set RSI thresholds may not be suitable for all market conditions.
-
Volume Threshold Sensitivity: The 3x average volume threshold may be too high or low, requiring adjustment for specific markets.
-
Fixed Holding Time Limitation: The 15-candle fixed closing time may prematurely end profitable trades.
-
Take-Profit and Stop-Loss Price Setting: Using the closing price at high volume occurrence for take-profit and stop-loss may not be optimal.
Strategy Optimization Directions
-
Dynamic RSI Thresholds: Automatically adjust RSI overbought/oversold thresholds based on market volatility.
-
Optimize Volume Thresholds: Introduce an adaptive mechanism to dynamically adjust volume breakout multipliers based on historical data.
-
Improve Holding Time Management: Dynamically adjust maximum holding time based on trend strength and profitability.
-
Enhance Take-Profit and Stop-Loss Settings: Consider incorporating the ATR indicator to dynamically set take-profit and stop-loss prices based on market volatility.
-
Add Trend Filters: Introduce long-term EMAs or trend indicators to avoid trading against the primary trend.
-
Incorporate Price Action Analysis: Combine candlestick patterns and support/resistance levels to improve entry and exit precision.
-
Consider Drawdown Control: Set maximum drawdown limits, forcing position closure when specific drawdown levels are reached.
Summary
This multi-indicator dynamic trading strategy creates a comprehensive trading system by combining EMA, RSI, and volume. It not only captures market trends but also manages risk through dynamic take-profit/stop-loss and fixed holding times. The strategy's strengths lie in its multidimensional analysis and flexible risk management, but it also faces challenges from changing market environments. By further optimizing RSI thresholds, volume judgment criteria, holding time management, and take-profit/stop-loss settings, this strategy has the potential to perform better in various market conditions. Ultimately, this strategy provides traders with a reliable framework that can be customized and improved according to individual trading styles and market characteristics.
[/trans]
Source (PineScript)
/*backtest
start: 2024-06-29 00:00:00
end: 2024-07-29 00:00:00
period: 1h
basePeriod: 15m
exchanges: [{"eid":"Futures_Binance","currency":"BTC_USDT"}]
*/

//@version=5
strategy("EMA & RSI Strategy", overlay=true)

// Install indicators
ema34 = ta.ema(close, 34)
ema89 = ta.ema(close, 89)
ema54 = ta.ema(close, 54)
ema150 = ta.ema(close, 150)
rsi = ta.rsi(close, 14)

// Draw indicator
plot(ema34, color=color.red, title="EMA 34")
plot(ema89, color=color.blue, title="EMA 89")
//plot(ema54, color=color.green, title="EMA 54")
//plot(ema150, color=color.yellow, title="EMA 150")
hline(50, "RSI 50", color=color.gray)
plot(rsi, title="RSI", color=color.orange, linewidth=2, offset=-1)

// condition long or short
longCondition = ta.crossover(ema34, ema89) and rsi > 30
shortCondition = ta.crossunder(ema34, ema89) and rsi < 70

// Add strategy long
if (longCondition)
    strategy.entry("Long", strategy.long)

// Add strategy short
if (shortCondition)
    strategy.entry("Short", strategy.short)

// Calculate the average volume of previous candles
length = 20 // Number of candles to calculate average volume
avgVolume = ta.sma(volume, length)
highVolumeCondition = volume > 3 * avgVolume

// Determine take profit and stop loss prices when there is high volume
var float takeProfitPriceLong = na
var float stopLossPriceLong = na
var float takeProfitPriceShort = na
var float stopLossPriceShort = na

if (longCondition)
    takeProfitPriceLong := na
    stopLossPriceLong := na

if (shortCondition)
    takeProfitPriceShort := na
    stopLossPriceShort := na

// Update take profit and stop loss prices when volume is high
if (strategy.opentrades.entry_id(0) == "Long" and highVolumeCondition)
    takeProfitPriceLong := close
    stopLossPriceLong := close

if (strategy.opentrades.entry_id(0) == "Short" and highVolumeCondition)
    takeProfitPriceShort := close
    stopLossPriceShort := close

// Execute exit orders for buy and sell orders when there is high volume
if (not na(takeProfitPriceLong))
    strategy.exit("Take Profit Long", from_entry="Long", limit=takeProfitPriceLong, stop=stopLossPriceLong)

if (not na(takeProfitPriceShort))
    strategy.exit("Take Profit Short", from_entry="Short", limit=takeProfitPriceShort, stop=stopLossPriceShort)

// Track the number of candles since the order was opened
var int barsSinceEntryLong = na
var int barsSinceEntryShort = na
var bool longPositionClosed = false
var bool shortPositionClosed = false

if (longCondition)
    barsSinceEntryLong := 0
    longPositionClosed := false
if (shortCondition)
    barsSinceEntryShort := 0
    shortPositionClosed := false

if (strategy.opentrades.entry_id(0) == "Long")
    barsSinceEntryLong := barsSinceEntryLong + 1

if (strategy.opentrades.entry_id(0) == "Short")
    barsSinceEntryShort := barsSinceEntryShort + 1

// Check the conditions to close the order at the 15th candle
if (strategy.opentrades.entry_id(0) == "Long" and barsSinceEntryLong >= 15 and not longPositionClosed)
    strategy.close("Long")
    longPositionClosed := true

if (strategy.opentrades.entry_id(0) == "Short" and barsSinceEntryShort >= 15 and not shortPositionClosed)
    strategy.close("Short")
    shortPositionClosed := true

// Thêm stop loss theo EMA34
if (strategy.opentrades.entry_id(0) == "Long")
    strategy.exit("Stop Loss Long", from_entry="Long", stop=ema34)
if (strategy.opentrades.entry_id(0) == "Short")
    strategy.exit("Stop Loss Short", from_entry="Short", stop=ema34)

// Displays buy/sell signals and price levels on the chart
plotshape(series=longCondition, location=location.belowbar, color=color.green, style=shape.labelup, text="BUY")
plotshape(series=shortCondition, location=location.abovebar, color=color.red, style=shape.labeldown, text="SELL")

// Displays take profit and stop loss prices on the chart
// var line takeProfitLineLong = na
// var line stopLossLineLong = na
// var line takeProfitLineShort = na
// var line stopLossLineShort = na

// if (not na(takeProfitPriceLong))
//     if na(takeProfitLineLong)
//         takeProfitLineLong := line.new(x1=bar_index, y1=takeProfitPriceLong, x2=bar_index + 1, y2=takeProfitPriceLong, color=color.blue, width=1, style=line.style_dashed)
//     else
//         line.set_xy1(takeProfitLineLong, x=bar_index, y=takeProfitPriceLong)
//         line.set_xy2(takeProfitLineLong, x=bar_index + 1, y=takeProfitPriceLong)

// if (not na(stopLossPriceLong))
//     if na(stopLossLineLong)
//         stopLossLineLong := line.new(x1=bar_index, y1=stopLossPriceLong, x2=bar_index + 1, y2=stopLossPriceLong, color=color.red, width=1, style=line.style_dashed)
//     else
//         line.set_xy1(stopLossLineLong, x=bar_index, y=stopLossPriceLong)
//         line.set_xy2(stopLossLineLong, x=bar_index + 1, y=stopLossPriceLong)

// if (not na(takeProfitPriceShort))
//     if na(takeProfitLineShort)
//         takeProfitLineShort := line.new(x1=bar_index, y1=takeProfitPriceShort, x2=bar_index + 1, y2=takeProfitPriceShort, color=color.blue, width=1, style=line.style_dashed)
//     else
//         line.set_xy1(takeProfitLineShort, x=bar_index, y=takeProfitPriceShort)
//         line.set_xy2(takeProfitLineShort, x=bar_index + 1, y=takeProfitPriceShort)

// if (not na(stopLossPriceShort))
//     if na(stopLossLineShort)
//         stopLossLineShort := line.new(x1=bar_index, y1=stopLossPriceShort, x2=bar_index + 1, y2=stopLossPriceShort, color=color.red, width=1, style=line.style_dashed)
//     else
//         line.set_xy1(stopLossLineShort, x=bar_index, y=stopLossPriceShort)
//         line.set_xy2(stopLossLineShort, x=bar_index + 1, y=stopLossPriceShort)

// // Shows annotations for take profit and stop loss prices
// if (not na(takeProfitPriceLong))
//     label.new(x=bar_index, y=takeProfitPriceLong, text="TP Long", style=label.style_label_down, color=color.blue, textcolor=color.white)
// if (not na(stopLossPriceLong))
//     label.new(x=bar_index, y=stopLossPriceLong, text="SL Long", style=label.style_label_up, color=color.red, textcolor=color.white)
// if (not na(takeProfitPriceShort))
//     label.new(x=bar_index, y=takeProfitPriceShort, text="TP Short", style=label.style_label_up, color=color.blue, textcolor=color.white)
// if (not na(stopLossPriceShort))
//     label.new(x=bar_index, y=stopLossPriceShort, text="SL Short", style=label.style_label_down, color=color.red, textcolor=color.white)
Detail
https://www.fmz.com/strategy/458204
Last Modified
2024-07-30 17:29:59