
20 KiB
Name
多指标综合分析量化交易策略趋势动量与波动性协同预测模型-Multi-Indicator-Comprehensive-Analysis-Quantitative-Trading-Strategy-Trend-Momentum-and-Volatility-Collaborative-Prediction-Model
Author
ianzeng123
Strategy Description
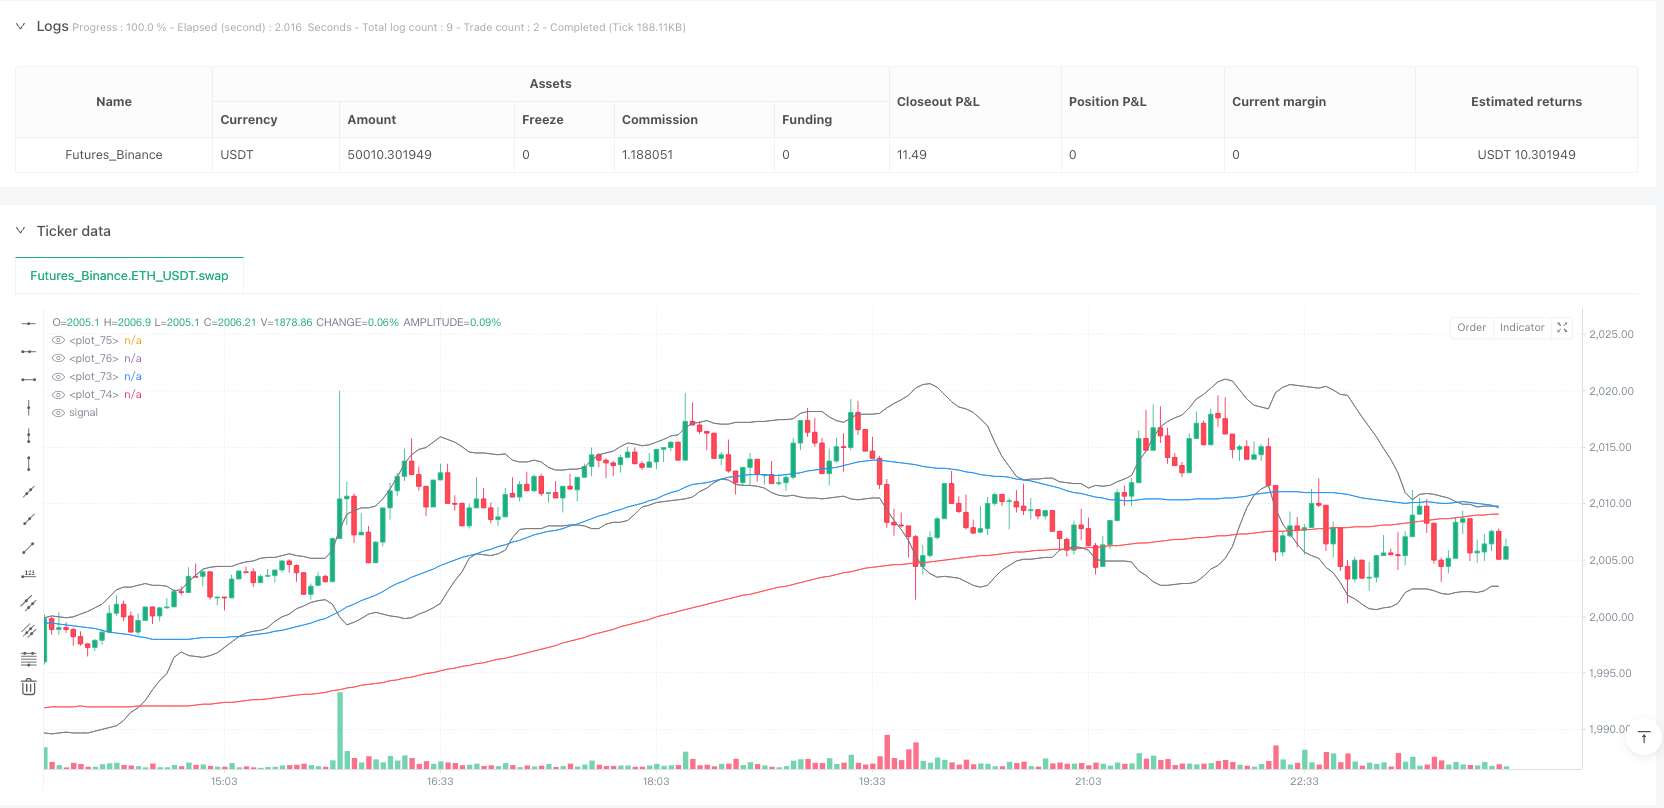
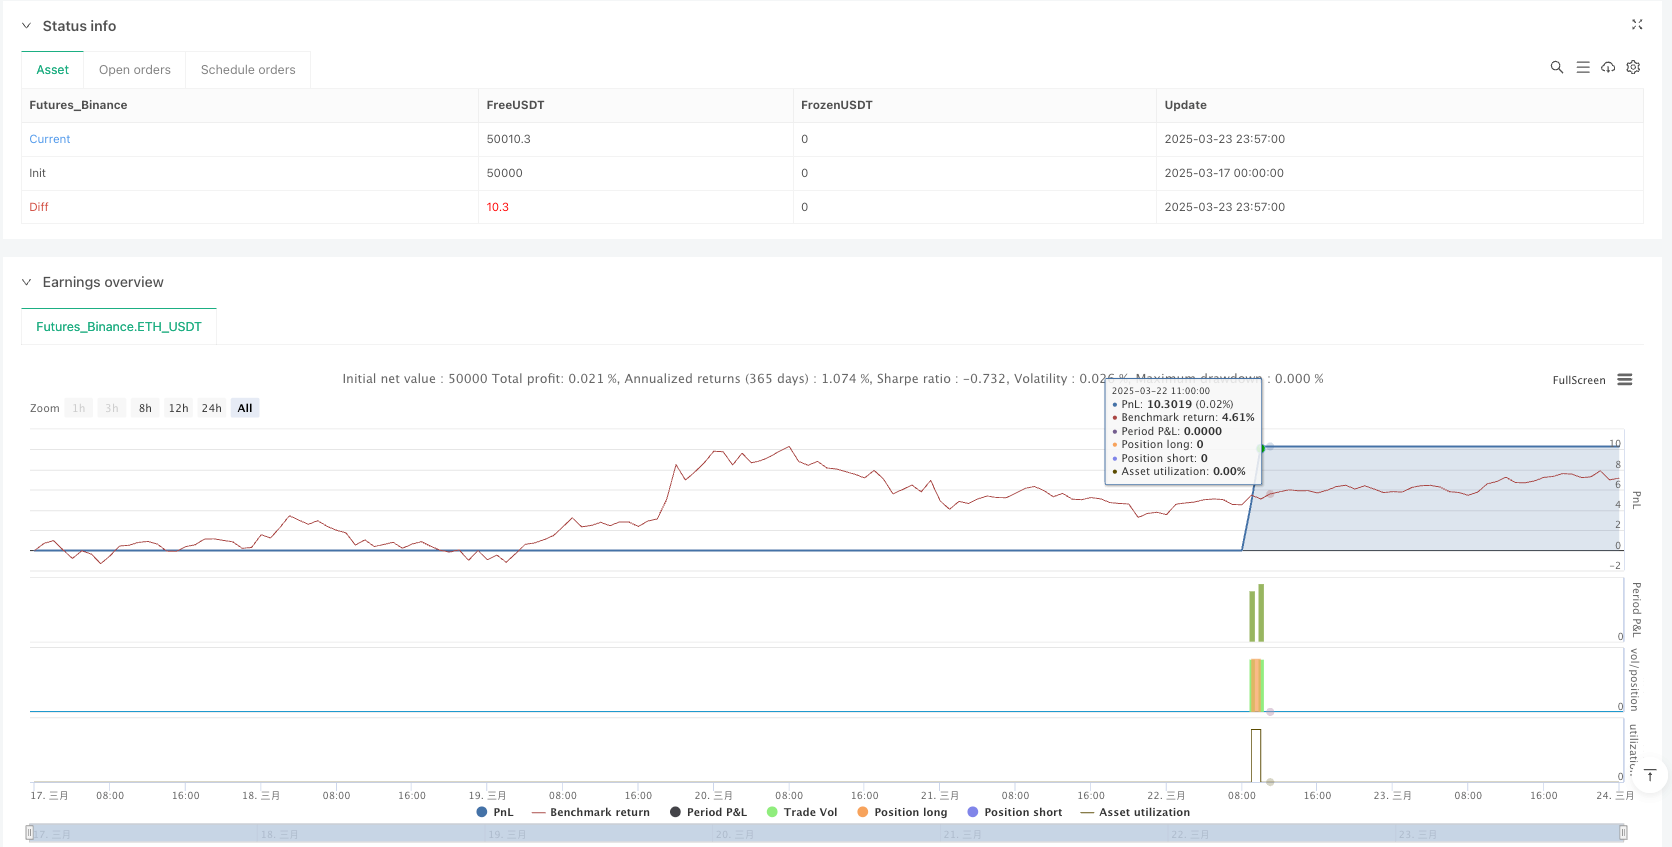
[trans]
概述
多指标综合分析量化交易策略是一种基于多种技术指标融合分析的量化交易方法,该策略整合了30个不同的技术指标,包括趋势指标、动量指标、波动性指标、交易量指标以及其他特殊指标等,通过这些指标的协同分析,形成了一套完整的交易信号系统。该策略主要利用多指标间的相互验证与过滤机制,在识别市场趋势的同时,结合动量与波动性分析,以寻找高概率的交易机会。策略采用严格的入场条件和基于ATR的动态止损止盈设置,旨在平衡收益与风险。
策略原理
该策略的核心原理在于通过多维度的市场分析,形成相互验证的交易决策体系。策略首先定义了五大类指标系统:
-
趋势指标:包括SMA50、SMA200、EMA20、EMA50以及ADX指标。这些指标用于确认市场的主要方向,ADX的上升或下降分别用于识别趋势的增强或减弱。
-
动量指标:包括RSI、MACD、随机指标(Stochastic)、CCI和动量指标(Momentum)。这些指标主要用于测量价格变动的速度和强度,识别潜在的超买或超卖区域。
-
波动性指标:包括布林带(Bollinger Bands)、平均真实范围(ATR)以及肯特纳通道(Keltner Channel)。这些指标用于评估市场波动性和确定潜在的价格突破。
-
成交量指标:包括OBV、资金流量指标(MFI)、VWAP和Chaikin指标。这些指标通过分析交易量变化来确认价格趋势的真实性。
-
其他特殊指标:包括抛物线SAR、超级趋势(Supertrend)、威廉指标(Williams %R)、斐波那契回调(Fibonacci Retracement)和一些基于均线的改良指标。
策略的交易逻辑基于这些指标的综合分析,具体交易信号条件如下:
-
做多条件:要求ADX趋势上升、RSI不超过70、MACD线在信号线上方、随机指标K大于20、CCI大于-100、价格突破布林带上轨、OBV大于其20日均线、成交量突然放大、形成黄金交叉且价格位于200日均线上方。
-
做空条件:要求ADX趋势下降、RSI大于30、MACD线在信号线下方、随机指标D小于80、CCI小于100、价格跌破布林带下轨、OBV小于其20日均线、成交量突然放大、形成死亡交叉且价格位于200日均线下方。
一旦触发交易信号,策略会使用基于ATR的动态止损止盈设置,具体为止损设在当前价格减去2倍ATR,止盈设在当前价格加上4倍ATR(做多),或相反(做空)。
策略优势
-
多维度市场分析:通过整合30个不同类型的技术指标,策略能够从多个维度分析市场,减少单一指标的误导信号,提高交易决策的可靠性。
-
严格的信号过滤机制:策略对交易信号设置了多重条件,只有当大多数指标共同指向同一方向时才会开仓,有效过滤了虚假信号。
-
动态风险管理:采用基于ATR的动态止损止盈设置,根据市场实际波动性调整风险参数,避免了固定点位止损止盈在不同市场条件下的局限性。
-
趋势与波动结合:策略同时关注中长期趋势和短期波动,既能捕捉大趋势中的交易机会,又能通过波动指标优化入场时机。
-
量价结合分析:通过整合多种成交量指标,验证价格走势的真实性,提高趋势判断的准确性。
-
综合技术流派:策略融合了趋势跟踪、突破交易、摆动交易等多种技术分析流派的思想,使策略适应性更强。
策略风险
-
指标过度拥挤风险:使用30个指标可能导致信号相互冲突,特别是在震荡市场中,多个指标可能给出相互矛盾的信号,导致交易机会丧失或错误决策。
-
参数优化挑战:如此多的指标意味着大量的参数需要优化,容易导致过度拟合历史数据,而在实盘中表现不佳。
-
系统计算负担:大量指标的计算会增加系统资源消耗,可能导致策略运行缓慢,尤其是在高频交易或多品种同时运行时。
-
信号稀缺问题:由于入场条件极为严格,可能导致长时间无法产生交易信号,降低了资金利用效率。
-
市场条件依赖:尽管策略整合了多种指标,但在某些特定市场条件下(如极端波动或流动性枯竭)仍可能失效。
解决方法:
- 根据市场条件,对指标进行分组和优先级排序,避免所有指标同等权重
- 对关键参数如威廉指标(Williams %R)的周期进行专项优化测试
- 考虑使用更高效的计算方法或简化部分指标的计算逻辑
- 针对不同市场阶段,动态调整入场条件的严格程度
- 增加流动性和市场状态检测机制,在极端市场条件下减少或暂停交易
策略优化方向
-
指标权重优化:为不同指标分配权重,而非简单的"且"逻辑,可以使用机器学习方法如随机森林或神经网络来评估各指标的重要性并动态调整权重。
-
参数自适应机制:针对威廉指标等关键参数,可以根据市场波动性或交易周期自动调整周期参数,例如在波动性增加时使用更长的周期。
-
信号分层处理:将指标分为确认指标和过滤指标两类,确认指标用于生成基本信号,过滤指标用于提高信号质量,这样可以增加信号数量的同时保持较高质量。
-
市场环境识别:增加市场状态分类模块,识别当前市场是趋势市还是震荡市,并据此动态调整策略参数和交易规则。
-
优化计算效率:对部分高相关性指标进行精简,或使用更高效的计算方法,如使用指数平滑技术替代简单移动平均,减少计算负担。
-
改进止损策略:考虑加入追踪止损或基于波动率的动态止损,在保护利润的同时给予价格足够的波动空间。
-
资金管理优化:加入基于Kelly准则或固定分数模型的仓位管理,根据信号强度和市场波动性调整每次交易的资金比例。
优化这些方向的原因在于,当前策略虽然整合了多维度分析,但过于刚性的信号生成逻辑和等权重的指标处理方式限制了策略的适应性和效率。通过引入自适应机制、分层处理和智能权重分配,可以在保持多指标分析优势的同时,提高策略的灵活性和市场适应能力。
总结
多指标综合分析量化交易策略通过整合趋势、动量、波动性、交易量等多维度的市场信息,构建了一个全面的交易决策系统。策略的主要优势在于信号可靠性高和风险管理动态化,但同时也面临信号稀缺和计算负担等挑战。
从实现角度看,该策略在TradingView平台上的代码结构清晰,逻辑分明,分为指标定义、信号生成和策略执行三大模块。代码优化空间主要在于参数自适应和指标权重方面。
总体而言,这是一个思路完整、逻辑严密的综合量化策略,特别适合中长期趋势交易和波动较大的市场环境。通过提出的优化方向,尤其是指标分层处理和市场环境识别,策略可以进一步提升其在不同市场条件下的适应性和稳定性,成为一个更加全面和健壯的量化交易系统。||
Overview
The Multi-Indicator Comprehensive Analysis Quantitative Trading Strategy is a quantitative trading method based on the integrated analysis of multiple technical indicators. This strategy incorporates 30 different technical indicators, including trend indicators, momentum indicators, volatility indicators, volume indicators, and other specialized indicators, forming a complete trading signal system through the collaborative analysis of these indicators. The strategy primarily utilizes mutual verification and filtering mechanisms between multiple indicators to identify market trends while combining momentum and volatility analysis to find high-probability trading opportunities. The strategy employs strict entry conditions and ATR-based dynamic stop-loss and take-profit settings, aiming to balance returns and risks.
Strategy Principles
The core principle of this strategy lies in creating a mutually verifying trading decision system through multi-dimensional market analysis. The strategy first defines five major categories of indicator systems:
-
Trend Indicators: Including SMA50, SMA200, EMA20, EMA50, and ADX. These indicators are used to confirm the primary market direction, with rising or falling ADX used to identify strengthening or weakening trends.
-
Momentum Indicators: Including RSI, MACD, Stochastic, CCI, and Momentum. These indicators primarily measure the speed and strength of price movements, identifying potential overbought or oversold areas.
-
Volatility Indicators: Including Bollinger Bands, Average True Range (ATR), and Keltner Channel. These indicators assess market volatility and determine potential price breakouts.
-
Volume Indicators: Including OBV, Money Flow Index (MFI), VWAP, and Chaikin indicator. These indicators confirm the authenticity of price trends by analyzing volume changes.
-
Other Specialized Indicators: Including Parabolic SAR, Supertrend, Williams %R, Fibonacci Retracement, and some modified indicators based on moving averages.
The strategy's trading logic is based on the comprehensive analysis of these indicators, with specific trading signal conditions as follows:
-
Long Conditions: Requires ADX trend rising, RSI not exceeding 70, MACD line above signal line, Stochastic K greater than 20, CCI greater than -100, price breaking through the upper Bollinger Band, OBV greater than its 20-day moving average, sudden volume increase, golden cross formation, and price above the 200-day moving average.
-
Short Conditions: Requires ADX trend falling, RSI greater than 30, MACD line below signal line, Stochastic D less than 80, CCI less than 100, price falling below the lower Bollinger Band, OBV less than its 20-day moving average, sudden volume increase, death cross formation, and price below the 200-day moving average.
Once a trading signal is triggered, the strategy uses ATR-based dynamic stop-loss and take-profit settings, specifically setting the stop-loss at the current price minus 2 times ATR and take-profit at the current price plus 4 times ATR (for long positions), or vice versa (for short positions).
Strategy Advantages
-
Multi-dimensional Market Analysis: By integrating 30 different types of technical indicators, the strategy can analyze the market from multiple dimensions, reducing misleading signals from a single indicator and improving the reliability of trading decisions.
-
Strict Signal Filtering Mechanism: The strategy sets multiple conditions for trading signals, only opening positions when most indicators point in the same direction, effectively filtering out false signals.
-
Dynamic Risk Management: Using ATR-based dynamic stop-loss and take-profit settings, adjusting risk parameters according to actual market volatility, avoiding the limitations of fixed-point stop-loss and take-profit under different market conditions.
-
Combination of Trend and Volatility: The strategy focuses on both medium-to-long-term trends and short-term volatility, capturing trading opportunities within major trends while optimizing entry timing through volatility indicators.
-
Integration of Price and Volume Analysis: By integrating multiple volume indicators, the strategy verifies the authenticity of price movements, improving the accuracy of trend determination.
-
Comprehensive Technical Schools: The strategy integrates ideas from various technical analysis schools such as trend following, breakout trading, and swing trading, making it more adaptable.
Strategy Risks
-
Indicator Overcrowding Risk: Using 30 indicators may lead to conflicting signals, especially in oscillating markets, where multiple indicators may give contradictory signals, resulting in lost trading opportunities or incorrect decisions.
-
Parameter Optimization Challenges: So many indicators mean a large number of parameters that need optimization, easily leading to overfitting historical data and poor performance in live trading.
-
System Computation Burden: Calculating numerous indicators increases system resource consumption, potentially causing slow strategy operation, especially in high-frequency trading or when running multiple instruments simultaneously.
-
Signal Scarcity Issue: Due to extremely strict entry conditions, it may result in long periods without trading signals, reducing capital efficiency.
-
Market Condition Dependency: Despite integrating multiple indicators, the strategy may still fail under certain specific market conditions (such as extreme volatility or liquidity drought).
Solutions:
- Group indicators and prioritize them according to market conditions, avoiding equal weighting of all indicators
- Conduct specialized optimization tests for key parameters such as Williams %R period
- Consider using more efficient calculation methods or simplifying the calculation logic of some indicators
- Dynamically adjust the strictness of entry conditions for different market phases
- Add liquidity and market state detection mechanisms, reducing or suspending trading under extreme market conditions
Strategy Optimization Directions
-
Indicator Weight Optimization: Assign weights to different indicators rather than simple "AND" logic, using machine learning methods such as random forests or neural networks to evaluate the importance of various indicators and dynamically adjust weights.
-
Parameter Adaptive Mechanism: For key parameters such as Williams %R, automatically adjust cycle parameters according to market volatility or trading cycles, for example, using longer cycles when volatility increases.
-
Signal Hierarchical Processing: Divide indicators into confirmation indicators and filter indicators, using confirmation indicators to generate basic signals and filter indicators to improve signal quality, thus increasing signal quantity while maintaining high quality.
-
Market Environment Recognition: Add a market state classification module to identify whether the current market is a trend market or an oscillating market, and dynamically adjust strategy parameters and trading rules accordingly.
-
Optimize Calculation Efficiency: Streamline some highly correlated indicators or use more efficient calculation methods, such as using exponential smoothing techniques instead of simple moving averages, reducing computational burden.
-
Improve Stop-Loss Strategy: Consider adding trailing stop-loss or volatility-based dynamic stop-loss, giving prices sufficient room to fluctuate while protecting profits.
-
Capital Management Optimization: Add position management based on the Kelly criterion or fixed fraction model, adjusting the proportion of funds for each trade according to signal strength and market volatility.
The reason for optimizing these directions is that although the current strategy integrates multi-dimensional analysis, the rigid signal generation logic and equal-weight indicator processing method limit the strategy's adaptability and efficiency. By introducing adaptive mechanisms, hierarchical processing, and intelligent weight allocation, the strategy's flexibility and market adaptability can be improved while maintaining the advantages of multi-indicator analysis.
Summary
The Multi-Indicator Comprehensive Analysis Quantitative Trading Strategy constructs a comprehensive trading decision system by integrating market information from multiple dimensions such as trend, momentum, volatility, and volume. The main advantages of the strategy lie in high signal reliability and dynamic risk management, but it also faces challenges such as signal scarcity and computational burden.
From an implementation perspective, the strategy's code structure on the TradingView platform is clear and logical, divided into three major modules: indicator definition, signal generation, and strategy execution. The code optimization space is mainly in parameter adaptation and indicator weighting.
Overall, this is a comprehensive quantitative strategy with complete ideas and rigorous logic, particularly suitable for medium-to-long-term trend trading and highly volatile market environments. Through the proposed optimization directions, especially indicator hierarchical processing and market environment recognition, the strategy can further enhance its adaptability and stability under different market conditions, becoming a more comprehensive and robust quantitative trading system.[/trans]
Source (PineScript)
/*backtest
start: 2025-03-17 00:00:00
end: 2025-03-24 00:00:00
period: 3m
basePeriod: 3m
exchanges: [{"eid":"Futures_Binance","currency":"ETH_USDT"}]
*/

//@version=5
strategy("30 Göstergeli Strateji (BAKİ REİS)", overlay=true)

// 1. Trend Göstergeleri
// ------------------------------
sma50 = ta.sma(close, 50)
sma200 = ta.sma(close, 200)
ema20 = ta.ema(close, 20)
ema50 = ta.ema(close, 50)
[diPlus, diMinus, adx] = ta.dmi(14, 14)
trendUp = ta.rising(adx, 3)
trendDown = ta.falling(adx, 3)

// 2. Momentum Göstergeleri
// ------------------------------
rsi = ta.rsi(close, 14)
macdLine = ta.ema(close, 12) - ta.ema(close, 26)
macdSignal = ta.ema(macdLine, 9)
stochK = ta.sma(ta.stoch(close, high, low, 14), 3)
stochD = ta.sma(stochK, 3)
cci = ta.cci(close, 20)
mom = ta.mom(close, 10)

// 3. Volatilite Göstergeleri
// ------------------------------
bbUpper = ta.sma(close, 20) + 2 * ta.stdev(close, 20)
bbLower = ta.sma(close, 20) - 2 * ta.stdev(close, 20)
atr = ta.atr(14)
kcUpper = ta.ema(close, 20) + 2 * ta.atr(20)
kcLower = ta.ema(close, 20) - 2 * ta.atr(20)

// 4. Hacim Göstergeleri
// ------------------------------
obv = ta.obv
mfi = ta.mfi(close, 14)
vwap = ta.vwap(close)
chaikin = ta.ema((close - low) - (high - close), 3) / (high - low) * volume

// 5. Diğer Göstergeler
// ------------------------------
sar = ta.sar(0.02, 0.2, 0.2)
[supertrendLine, supertrendDir] = ta.supertrend(3, 10)
williamsR = ta.wpr(14) // DÜZELTME BURADA!
fibRetrace = close > ta.highest(close, 50) * 0.618
ichimokuTenkan = ta.ema(close, 9)
ichimokuKijun = ta.ema(close, 26)

// 6. Özel Koşullar
// ------------------------------
goldenCross = ta.crossover(ema20, ema50)
deathCross = ta.crossunder(ema20, ema50)
volumeSpike = volume > 2 * ta.sma(volume, 20)
priceAboveSMA200 = close > sma200

// Sinyal Mantığı (Aynı)
// ------------------------------
longCondition = trendUp and rsi < 70 and macdLine > macdSignal and stochK > 20 and cci > -100 and close > bbUpper and obv > ta.ema(obv, 20) and volumeSpike and goldenCross and priceAboveSMA200

shortCondition = trendDown and rsi > 30 and macdLine < macdSignal and stochD < 80 and cci < 100 and close < bbLower and obv < ta.ema(obv, 20) and volumeSpike and deathCross and close < sma200

// Strateji Kuralları
// ------------------------------
if (longCondition)
    strategy.entry("Long", strategy.long)
    strategy.exit("Exit Long", stop=close - 2 * atr, limit=close + 4 * atr)

if (shortCondition)
    strategy.entry("Short", strategy.short)
    strategy.exit("Exit Short", stop=close + 2 * atr, limit=close - 4 * atr)

// Grafik Çizimleri
// ------------------------------
plot(sma50, color=color.blue)
plot(sma200, color=color.red)
plot(bbUpper, color=color.gray)
plot(bbLower, color=color.gray)
Detail
https://www.fmz.com/strategy/488137
Last Modified
2025-03-25 13:50:49