
16 KiB
Name
多指标结合的自适应波动ATR动态止盈止损15分钟图表趋势跟踪策略-Multi-Indicator-Adaptive-Volatility-ATR-Dynamic-SL-TP-15-Minute-Chart-Trend-Following-Strategy
Author
ianzeng123
Strategy Description
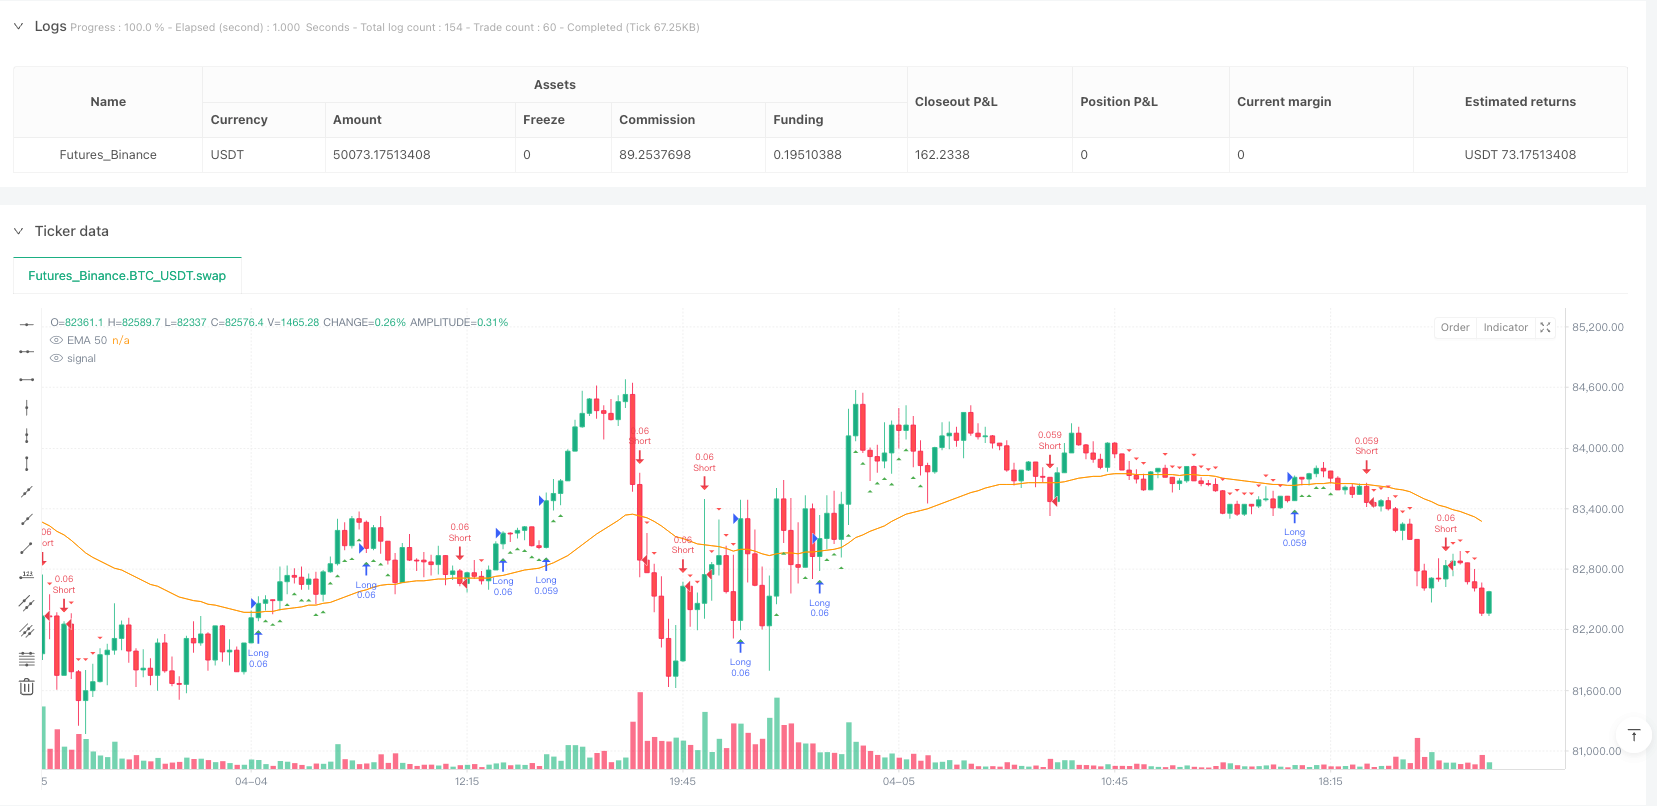
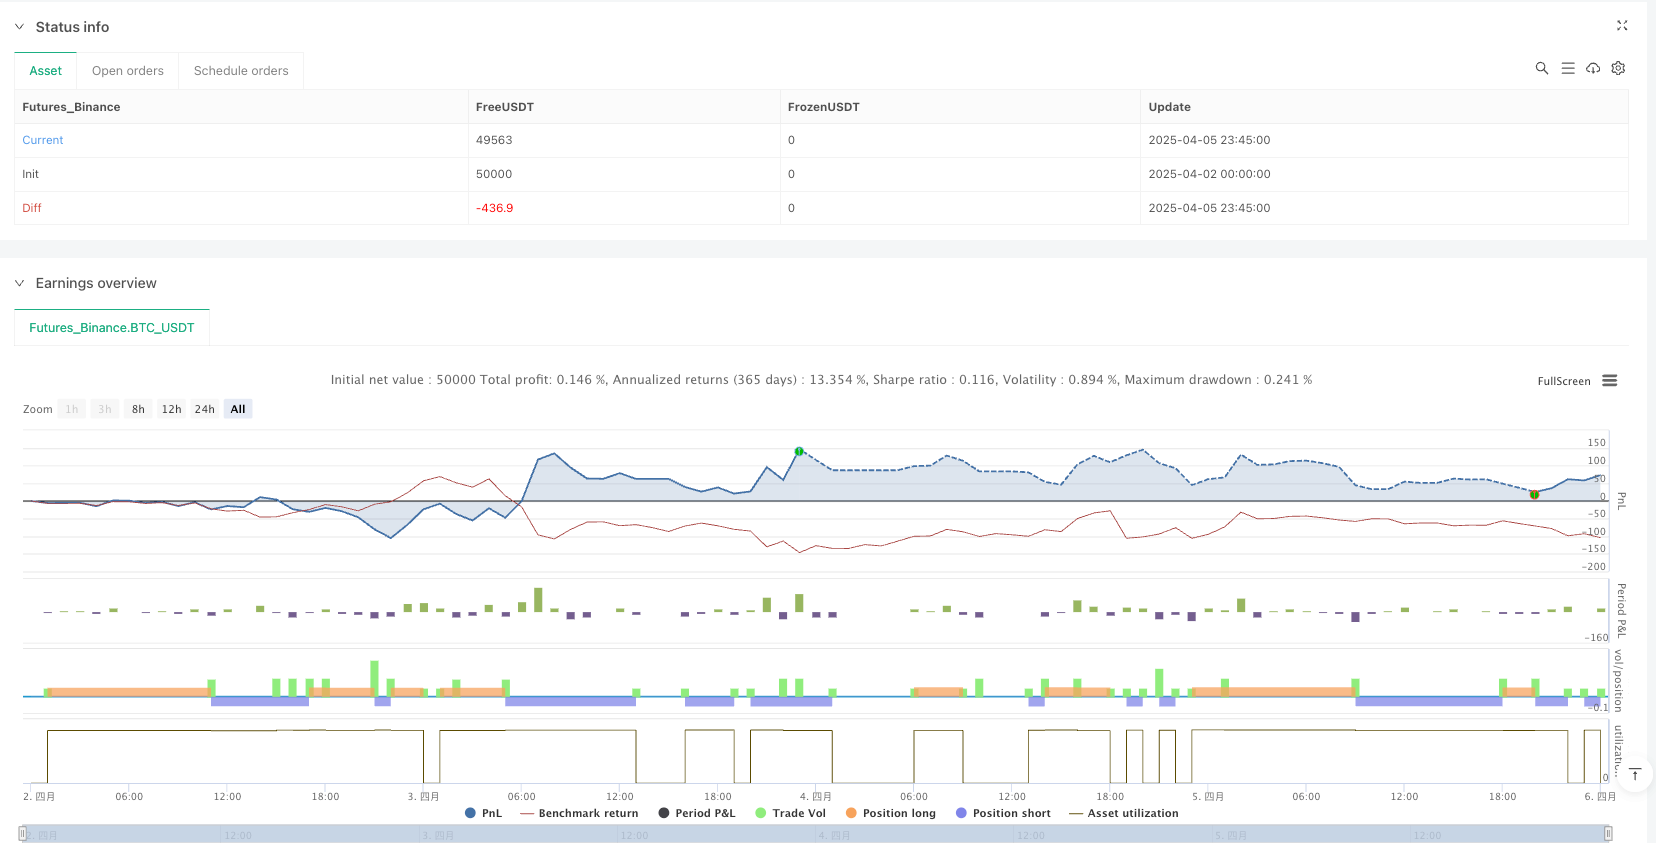
[trans]
概述
该策略是一个专为15分钟图表设计的短线交易策略,结合了趋势跟踪和动量确认机制,同时使用基于市场波动性的动态止损和止盈水平。核心思路是通过EMA(50)识别主要趋势方向,MACD柱状图确认动量方向,RSI指标过滤超买超卖条件,并使用ATR指标根据市场波动性动态设置止损和止盈位置。这种多指标结合的方法提供了更加全面的市场分析视角,有助于捕捉短期价格波动中的高概率交易机会。
策略原理
该策略的运作原理基于多个技术指标的协同作用:
-
趋势识别:使用50周期指数移动平均线(EMA)作为主要趋势指标。当价格位于EMA之上时,识别为上升趋势;当价格位于EMA之下时,识别为下降趋势。
-
动量确认:通过MACD直方图(MACD Histogram)判断价格动量。正值表示上升动量,负值表示下降动量。该指标由快速线(12周期)、慢速线(26周期)和信号线(9周期)计算得出。
-
市场状态过滤:使用相对强弱指数(RSI)过滤超买超卖条件。RSI介于50-70之间被视为看涨但未过度超买,RSI介于30-50之间被视为看跌但未过度超卖。
-
风险管理:基于平均真实范围(ATR)动态设置止损和止盈水平。止损设置为1倍ATR,止盈设置为2倍ATR,可根据个人风险偏好调整。
入场条件明确:
- 多头入场:价格高于EMA 50 + MACD柱状图为正 + RSI高于50但低于70
- 空头入场:价格低于EMA 50 + MACD柱状图为负 + RSI低于50但高于30
这种多层次的条件组合确保了交易信号的质量,有效减少了错误信号。
策略优势
通过深入分析代码,该策略展现出多项显著优势:
-
多重确认机制:结合了趋势、动量和超买超卖三个维度的指标,形成多重确认机制,减少假信号,提高交易准确性。
-
自适应风险管理:使用ATR动态调整止损和止盈水平,使策略能够适应不同市场波动状况,在高波动市场自动扩大止损范围,低波动市场收窄止损范围。
-
清晰的交易逻辑:入场和出场条件定义明确,无主观判断因素,易于执行和回测。
-
灵活的参数调整:所有关键参数均可自定义,包括EMA长度、MACD参数、RSI阈值以及ATR乘数,使策略能够适应不同市场环境和个人交易风格。
-
可视化交易信号:代码中包含了信号可视化功能,在图表上直观显示入场点位,有助于策略理解和优化。
-
风险收益比固定:通过设置止盈为止损的2倍,确保了有利的风险收益比,有助于长期盈利。
策略风险
尽管该策略设计合理,但仍存在以下潜在风险:
-
震荡市场表现不佳:在横盘震荡市场中,策略可能产生多次错误信号,导致连续亏损。解决方法是增加额外的震荡市场过滤条件,或在明显震荡期间暂停交易。
-
假突破风险:价格短暂突破EMA后迅速回落可能触发错误信号。可以考虑增加确认周期或结合成交量指标来过滤假突破。
-
固定ATR乘数的局限性:虽然ATR可以适应波动性变化,但固定的乘数可能在某些市场条件下过大或过小。解决方案是基于历史波动率动态调整ATR乘数。
-
参数优化过拟合风险:过度优化指标参数可能导致策略在历史数据上表现良好但在实盘中失效。建议使用步进式优化和前向验证来减轻这一风险。
-
极端市场风险:在市场剧烈波动或跳空情况下,止损可能无法按预期执行,造成超预期亏损。可考虑设置最大止损金额作为额外保护。
策略优化方向
分析代码后,发现以下几个可能的优化方向:
-
增加时间过滤条件:考虑市场活跃度,可以添加时间过滤器,只在特定时段交易,避开低流动性或高波动性时段。实现方法是增加时间条件判断代码。
-
整合成交量确认:当前策略仅基于价格指标,可增加成交量指标作为额外确认,提高信号质量。具体可添加成交量与其移动平均线的比较逻辑。
-
动态调整ATR乘数:基于市场历史波动率自动调整止损和止盈的ATR乘数,在高波动期增加乘数,低波动期减小乘数。这可以通过计算波动率指标(如每日真实范围的标准差)来实现。
-
加入趋势强度过滤:使用ADX等趋势强度指标,只在趋势明确时交易,避免震荡市场的错误信号。实现方法是增加ADX条件判断。
-
引入尾随止损:当前策略使用固定止损,可考虑实现基于ATR的移动止损,锁定部分利润。这需要修改策略.exit部分,添加跟踪止损逻辑。
-
分批获利机制:考虑分阶段获利,例如达到1倍ATR时平仓50%,2倍ATR时平仓剩余仓位,提高整体盈利能力。这需要修改交易执行部分,实现部分平仓功能。
总结
多指标结合的自适应波动ATR动态止盈止损15分钟图表趋势跟踪策略是一个设计完善的短线交易系统,通过EMA、MACD和RSI的结合提供高质量的入场信号,并使用ATR实现动态风险管理。该策略特别适合趋势明确的市场环境,对于快速变动的交易品种具有较好的适应性。
策略的核心优势在于多重确认机制和自适应风险管理,主要局限在于震荡市场表现和参数优化难题。通过引入成交量确认、趋势强度过滤和动态参数调整等优化措施,可以进一步提升策略的稳定性和盈利能力。
对于交易者而言,这是一个逻辑清晰、易于理解和执行的策略框架,可作为构建个人交易系统的良好基础。然而,任何策略在实盘应用前都应进行充分的回测和前向测试,并根据个人风险承受能力和市场环境进行适当调整。 ||
Overview
This strategy is a short-term trading approach designed for 15-minute charts, combining trend following with momentum confirmation mechanisms, while utilizing dynamic stop-loss and take-profit levels based on market volatility. The core idea is to identify the main trend direction using EMA(50), confirm momentum direction with MACD histogram, filter overbought/oversold conditions using RSI indicator, and dynamically set stop-loss and take-profit positions using ATR indicator based on market volatility. This multi-indicator approach provides a more comprehensive market analysis perspective, helping to capture high-probability trading opportunities in short-term price movements.
Strategy Principles
The operation of this strategy is based on the synergistic effect of multiple technical indicators:
-
Trend Identification: Uses a 50-period Exponential Moving Average (EMA) as the primary trend indicator. When price is above the EMA, an uptrend is identified; when price is below the EMA, a downtrend is identified.
-
Momentum Confirmation: Judges price momentum through the MACD Histogram. Positive values indicate upward momentum, while negative values indicate downward momentum. This indicator is calculated from the fast line (12 periods), slow line (26 periods), and signal line (9 periods).
-
Market State Filtering: Uses the Relative Strength Index (RSI) to filter overbought/oversold conditions. RSI between 50-70 is considered bullish but not excessively overbought, while RSI between 30-50 is considered bearish but not excessively oversold.
-
Risk Management: Dynamically sets stop-loss and take-profit levels based on Average True Range (ATR). Stop-loss is set at 1x ATR, and take-profit at 2x ATR, adjustable according to personal risk preference.
Entry conditions are clearly defined:
- Long Entry: Price above EMA 50 + MACD histogram positive + RSI above 50 but below 70
- Short Entry: Price below EMA 50 + MACD histogram negative + RSI below 50 but above 30
This multi-layered combination of conditions ensures the quality of trading signals, effectively reducing false signals.
Strategy Advantages
Through in-depth code analysis, this strategy demonstrates several significant advantages:
-
Multiple Confirmation Mechanisms: Combines indicators from three dimensions—trend, momentum, and overbought/oversold—forming multiple confirmation mechanisms that reduce false signals and improve trading accuracy.
-
Adaptive Risk Management: Uses ATR to dynamically adjust stop-loss and take-profit levels, allowing the strategy to adapt to different market volatility conditions, automatically widening stop-loss ranges in highly volatile markets and narrowing them in low-volatility markets.
-
Clear Trading Logic: Entry and exit conditions are clearly defined with no subjective judgment factors, making the strategy easy to execute and backtest.
-
Flexible Parameter Adjustment: All key parameters can be customized, including EMA length, MACD parameters, RSI thresholds, and ATR multipliers, allowing the strategy to adapt to different market environments and personal trading styles.
-
Visualization of Trading Signals: The code includes signal visualization features that intuitively display entry points on the chart, aiding in strategy understanding and optimization.
-
Fixed Risk-Reward Ratio: By setting take-profit at twice the stop-loss, the strategy ensures a favorable risk-reward ratio, contributing to long-term profitability.
Strategy Risks
Despite its reasonable design, the strategy still has the following potential risks:
-
Poor Performance in Ranging Markets: In sideways, choppy markets, the strategy may generate multiple false signals, leading to consecutive losses. The solution is to add additional filtering conditions for ranging markets or pause trading during obvious consolidation periods.
-
False Breakout Risk: Price briefly breaking above/below the EMA before quickly retracing can trigger false signals. Consider adding confirmation periods or incorporating volume indicators to filter out false breakouts.
-
Limitations of Fixed ATR Multipliers: Although ATR can adapt to volatility changes, fixed multipliers may be too large or too small under certain market conditions. A solution is to dynamically adjust ATR multipliers based on historical volatility.
-
Parameter Optimization Overfitting Risk: Excessive optimization of indicator parameters may cause the strategy to perform well on historical data but fail in live trading. It's recommended to use step-by-step optimization and forward validation to mitigate this risk.
-
Extreme Market Risk: In cases of severe market volatility or gaps, stop-losses may not execute as expected, causing losses beyond expectations. Consider setting maximum stop-loss amounts as additional protection.
Strategy Optimization Directions
After analyzing the code, the following potential optimization directions were identified:
-
Add Time Filtering Conditions: Consider market activity levels by adding time filters to only trade during specific periods, avoiding low-liquidity or high-volatility sessions. This can be implemented by adding time condition judgment code.
-
Integrate Volume Confirmation: The current strategy is based solely on price indicators. Volume indicators could be added as additional confirmation to improve signal quality. Specifically, logic comparing volume with its moving average could be added.
-
Dynamically Adjust ATR Multipliers: Automatically adjust stop-loss and take-profit ATR multipliers based on historical market volatility, increasing multipliers during high-volatility periods and decreasing them during low-volatility periods. This can be implemented by calculating volatility indicators (such as the standard deviation of daily true ranges).
-
Add Trend Strength Filtering: Use trend strength indicators like ADX to only trade when trends are clear, avoiding false signals in ranging markets. This can be implemented by adding ADX condition judgments.
-
Introduce Trailing Stops: The current strategy uses fixed stop-losses. Consider implementing ATR-based trailing stops to lock in partial profits. This requires modifying the strategy.exit section to add trailing stop logic.
-
Partial Profit-Taking Mechanism: Consider staged profit-taking, such as closing 50% of the position at 1x ATR and the remaining position at 2x ATR, to improve overall profitability. This requires modifying the trade execution section to implement partial position closing functionality.
Summary
The Multi-Indicator Adaptive Volatility ATR Dynamic SL/TP 15-Minute Chart Trend Following Strategy is a well-designed short-term trading system that provides high-quality entry signals through the combination of EMA, MACD, and RSI, and implements dynamic risk management using ATR. This strategy is particularly suitable for market environments with clear trends and adapts well to rapidly changing trading instruments.
The core advantages of the strategy lie in its multiple confirmation mechanisms and adaptive risk management, while its main limitations are in ranging market performance and parameter optimization challenges. By introducing volume confirmation, trend strength filtering, and dynamic parameter adjustments, the stability and profitability of the strategy can be further enhanced.
For traders, this is a strategy framework with clear logic that is easy to understand and execute, and can serve as a good foundation for building personal trading systems. However, any strategy should undergo thorough backtesting and forward testing before live application, and should be appropriately adjusted according to personal risk tolerance and market environment.[/trans]
Source (PineScript)
/*backtest
start: 2025-04-02 00:00:00
end: 2025-04-06 00:00:00
period: 15m
basePeriod: 15m
exchanges: [{"eid":"Futures_Binance","currency":"BTC_USDT"}]
*/

//@version=5
strategy("Scalping 15min: EMA + MACD + RSI + ATR-based SL/TP", overlay=true, default_qty_type=strategy.percent_of_equity, default_qty_value=10)

// === INPUTURI ===
emaLength      = input.int(50, title="EMA Length")
macdFast       = input.int(12, title="MACD Fast Length")
macdSlow       = input.int(26, title="MACD Slow Length")
macdSignal     = input.int(9, title="MACD Signal Smoothing")
rsiLength      = input.int(14, title="RSI Length")
rsiOB          = input.int(70, title="RSI Overbought")
rsiOS          = input.int(30, title="RSI Oversold")
atrLength      = input.int(14, title="ATR Length")
slATRmult      = input.float(1.0, title="SL Multiplier (ATR)")
tpATRmult      = input.float(2.0, title="TP Multiplier (ATR)")

// === CALCULE ===
ema = ta.ema(close, emaLength)
[macdLine, signalLine, _] = ta.macd(close, macdFast, macdSlow, macdSignal)
macdHist = macdLine - signalLine
rsi = ta.rsi(close, rsiLength)
atr = ta.atr(atrLength)

// === CONDIȚII DE INTRARE ===
longCond  = close > ema and macdHist > 0 and rsi > 50 and rsi < rsiOB
shortCond = close < ema and macdHist < 0 and rsi < 50 and rsi > rsiOS

// === EXECUTARE TRADE ===
if (longCond)
    strategy.entry("Long", strategy.long)
if (shortCond)
    strategy.entry("Short", strategy.short)

// === TP & SL DINAMIC PRIN ATR ===
float stopLevel = na
float takeLevel = na

if (strategy.position_size > 0)
    stopLevel := close - slATRmult * atr
    takeLevel := close + tpATRmult * atr
if (strategy.position_size < 0)
    stopLevel := close + slATRmult * atr
    takeLevel := close - tpATRmult * atr

strategy.exit("Exit", from_entry="", stop=stopLevel, limit=takeLevel)

// === DESENARE ===
plot(ema, color=color.orange, title="EMA 50")
plotshape(longCond, location=location.belowbar, color=color.green, style=shape.triangleup, title="Long Signal", size=size.small)
plotshape(shortCond, location=location.abovebar, color=color.red, style=shape.triangledown, title="Short Signal", size=size.small)
Detail
https://www.fmz.com/strategy/489634
Last Modified
2025-04-07 11:33:56