
8.5 KiB
Name
多指标结合期权交易策略-Multi-Indicator-Options-Trading-Strategy
Author
ChaoZhang
Strategy Description
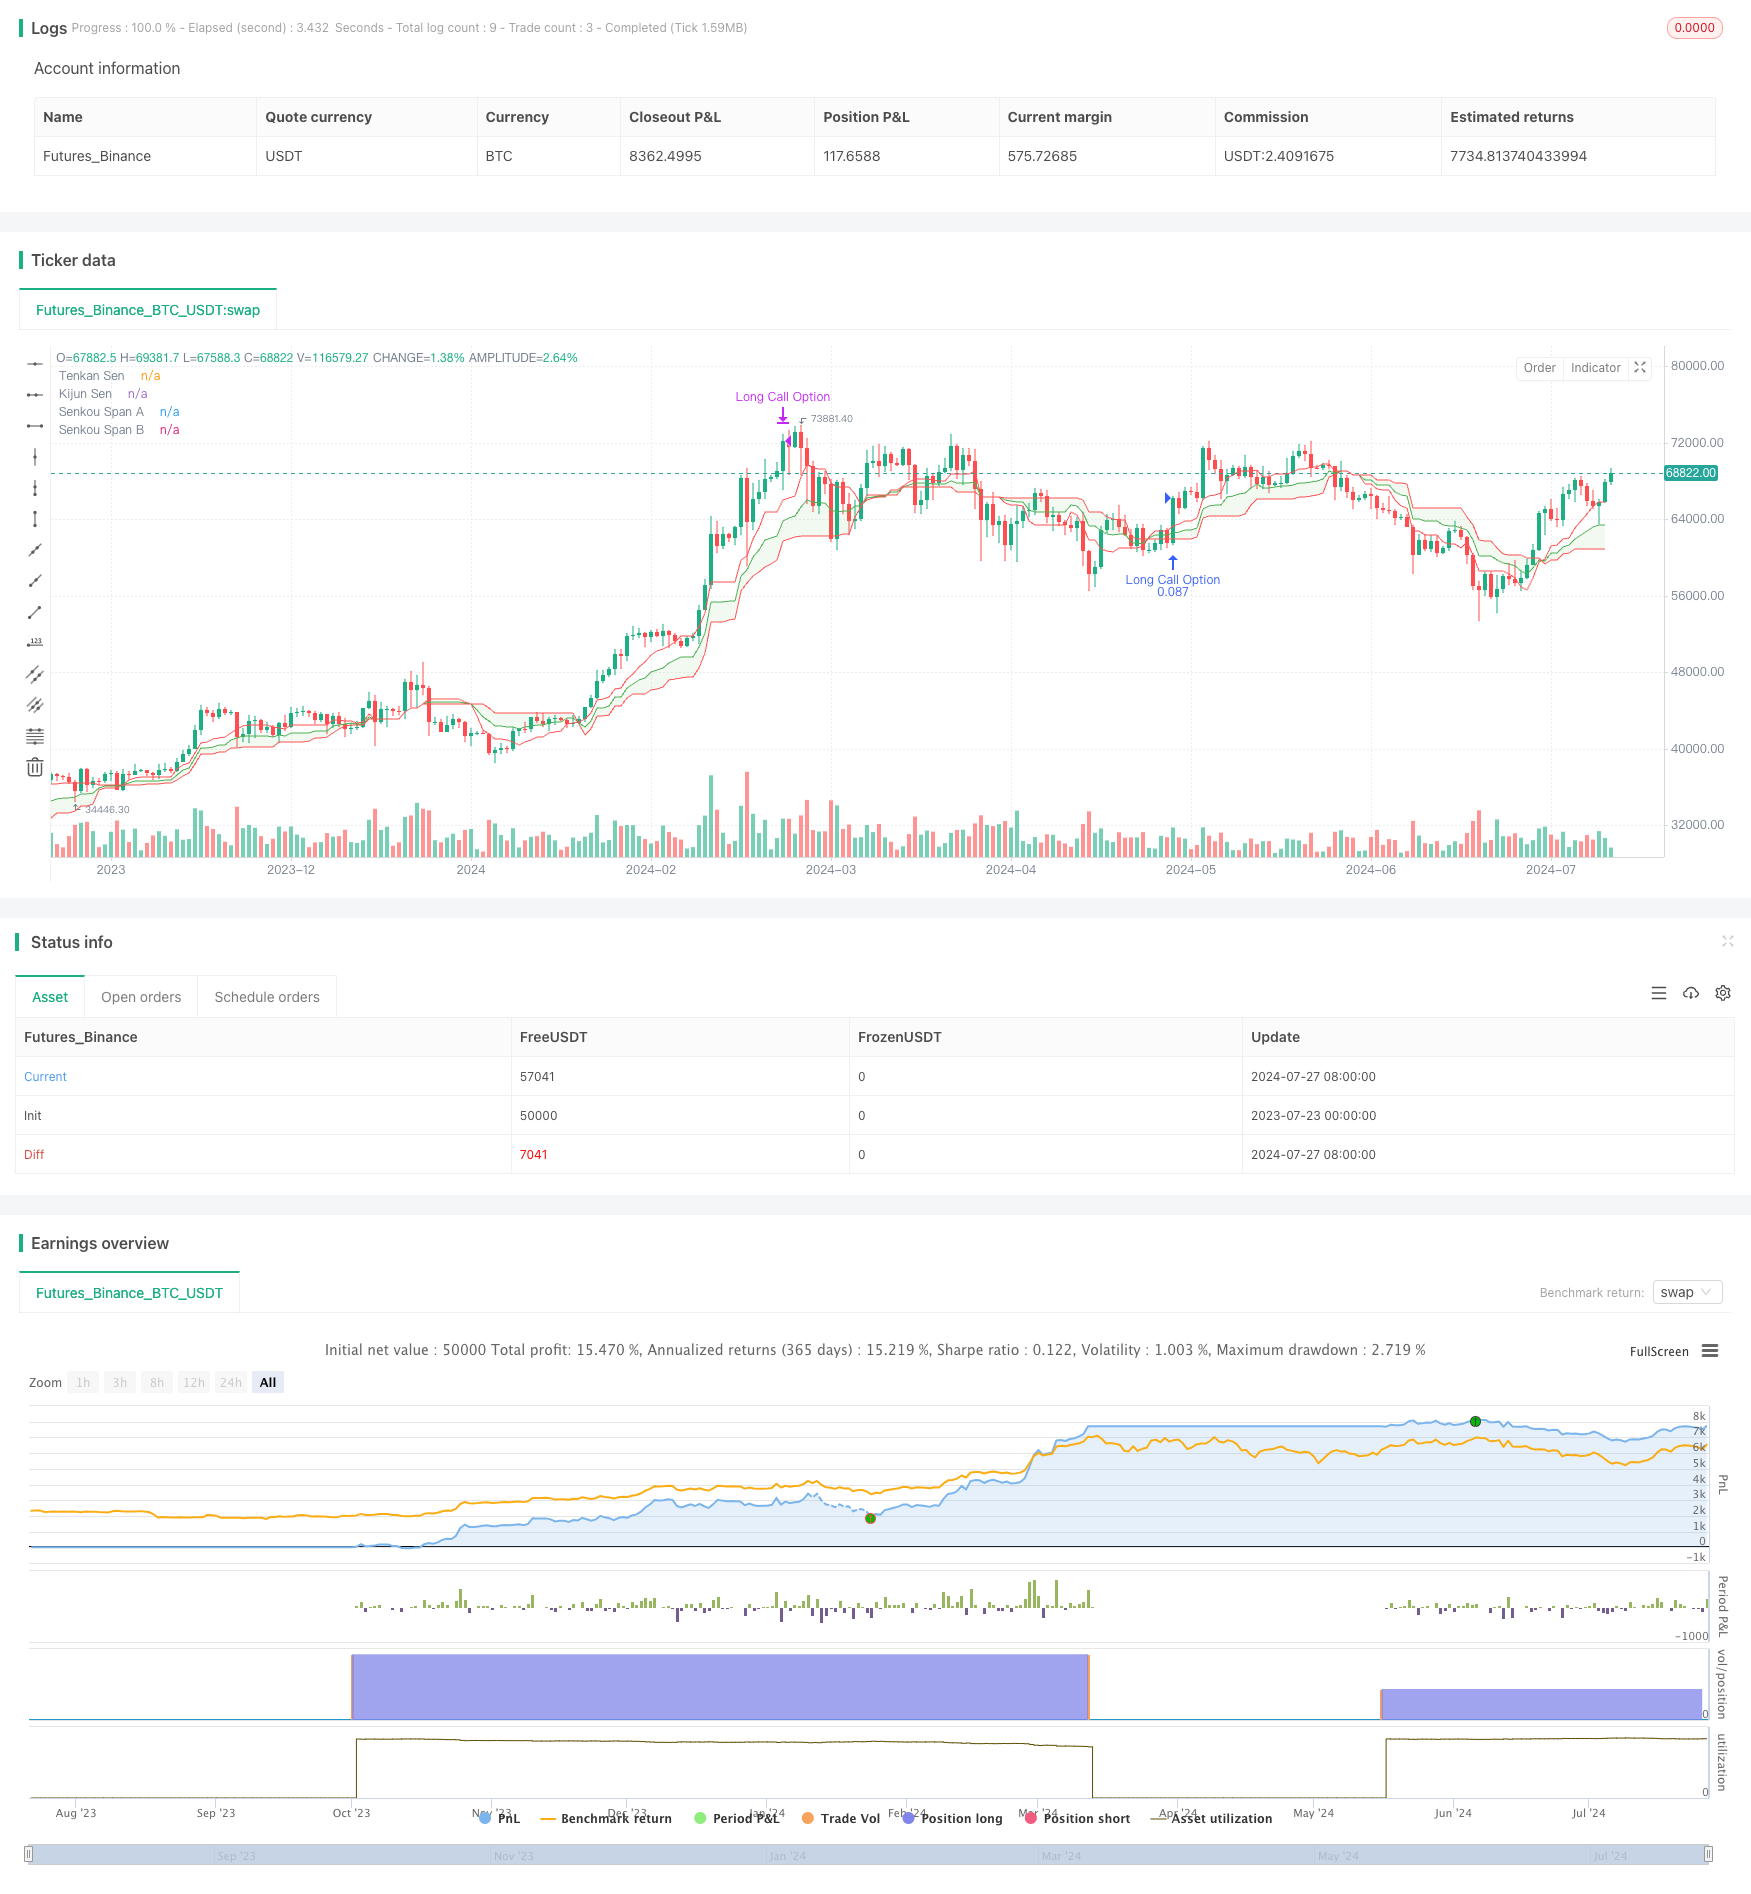
[trans]该策略是一个基于多个技术指标的期权交易策略,结合了市场趋势和动量指标来识别潜在的交易机会。策略利用一分钟图表上的价格与云图的相对位置、RSI超买条件以及MACD和KST指标的牛市交叉来触发交易信号。当所有条件都满足时,策略会开仓做多期权,并在达到30%的利润目标时平仓。这种方法旨在捕捉短期的上涨趋势,同时通过多重确认来降低假信号的风险。
策略原理
-
进场条件:
- 价格从下方进入绿色云图
- RSI低于70(避免超买)
- MACD线上穿信号线
- KST线上穿信号线
-
出场条件:
- 达到30%的利润目标
策略使用Ichimoku云图来确定整体趋势,RSI来避免在过度超买的情况下入场,MACD和KST指标的交叉则用于确认短期动量。这种多重确认机制旨在提高交易信号的可靠性。
策略优势
- 多重确认:结合多个技术指标,降低了假信号的风险。
- 趋势跟随:利用Ichimoku云图捕捉趋势变化。
- 动量确认:MACD和KST交叉提供了额外的动量确认。
- 风险管理:使用RSI避免在过度超买的情况下入场。
- 清晰的盈利目标:30%的利润目标提供了明确的退出策略。
- 适应性:可以根据不同市场条件调整参数。
策略风险
- 过度交易:频繁的短期交易可能导致高昂的交易成本。
- 错过大趋势:固定的30%利润目标可能导致过早退出强劲趋势。
- 滑点风险:在快速市场中,可能无法以理想价格执行交易。
- 参数敏感性:策略表现可能对参数设置高度敏感。
- 市场条件变化:在不同的市场环境下,策略效果可能会有显著差异。
策略优化方向
- 动态止盈:考虑使用跟踪止损或基于波动率的动态止盈,以适应不同市场条件。
- 时间过滤:增加交易时间窗口的限制,避免在波动较大的时段交易。
- 波动率调整:根据市场波动率动态调整进场和出场条件。
- 多时间框架分析:结合更长时间周期的分析,提高交易决策的可靠性。
- 机器学习优化:使用机器学习算法优化参数选择和信号生成。
总结
这个多指标期权交易策略通过结合Ichimoku云图、RSI、MACD和KST指标,为短期交易提供了一个全面的框架。虽然策略具有多重确认机制和明确的风险管理规则,但仍需要traders谨慎使用并持续监控其表现。通过进一步的优化和回测,该策略有潜力成为一个有效的短期交易工具。然而,使用者应该注意市场条件变化对策略表现的影响,并准备根据实际交易结果进行必要的调整。 || This strategy is an options trading approach that combines multiple technical indicators to identify potential trading opportunities. It utilizes the price's position relative to the Ichimoku Cloud on a one-minute chart, RSI overbought conditions, and bullish crossovers of both MACD and KST indicators to trigger trade signals. When all conditions are met, the strategy opens a long option position and closes it when a 30% profit target is reached. This method aims to capture short-term uptrends while using multiple confirmations to reduce the risk of false signals.
Strategy Principles
-
Entry Conditions:
- Price enters the green cloud from below
- RSI is below 70 (avoiding overbought conditions)
- MACD line crosses above the signal line
- KST line crosses above its signal line
-
Exit Condition:
- 30% profit target is reached
The strategy uses the Ichimoku Cloud to determine the overall trend, RSI to avoid entering in excessively overbought conditions, and crossovers of MACD and KST indicators to confirm short-term momentum. This multi-confirmation approach is designed to increase the reliability of trade signals.
Strategy Advantages
- Multiple Confirmations: Combining several technical indicators reduces the risk of false signals.
- Trend Following: Utilizes the Ichimoku Cloud to capture trend changes.
- Momentum Confirmation: MACD and KST crossovers provide additional momentum confirmation.
- Risk Management: Uses RSI to avoid entering in excessively overbought conditions.
- Clear Profit Target: The 30% profit target provides a definite exit strategy.
- Adaptability: Parameters can be adjusted for different market conditions.
Strategy Risks
- Overtrading: Frequent short-term trading may lead to high transaction costs.
- Missing Big Trends: The fixed 30% profit target might result in early exits from strong trends.
- Slippage Risk: In fast-moving markets, trades may not be executed at ideal prices.
- Parameter Sensitivity: Strategy performance may be highly sensitive to parameter settings.
- Changing Market Conditions: The strategy's effectiveness may vary significantly under different market environments.
Strategy Optimization Directions
- Dynamic Take Profit: Consider using trailing stops or volatility-based dynamic take profits to adapt to different market conditions.
- Time Filters: Add trading time window restrictions to avoid trading during highly volatile periods.
- Volatility Adjustments: Dynamically adjust entry and exit conditions based on market volatility.
- Multi-Timeframe Analysis: Incorporate analysis from longer timeframes to improve trade decision reliability.
- Machine Learning Optimization: Utilize machine learning algorithms to optimize parameter selection and signal generation.
Conclusion
This multi-indicator options trading strategy provides a comprehensive framework for short-term trading by combining the Ichimoku Cloud, RSI, MACD, and KST indicators. While the strategy incorporates multiple confirmation mechanisms and clear risk management rules, traders should use it cautiously and continuously monitor its performance. Through further optimization and backtesting, this strategy has the potential to become an effective short-term trading tool. However, users should be aware of the impact of changing market conditions on strategy performance and be prepared to make necessary adjustments based on real-world trading results.[/trans]
Source (PineScript)
/*backtest
start: 2023-07-23 00:00:00
end: 2024-07-28 00:00:00
period: 1d
basePeriod: 1h
exchanges: [{"eid":"Futures_Binance","currency":"BTC_USDT"}]
*/

//@version=5
strategy("Ichimoku + RSI + MACD + KST Options Strategy", overlay=true, default_qty_type=strategy.percent_of_equity, default_qty_value=10)

// Ichimoku Cloud settings
tenkanLength = input(9, title="Tenkan Length")
kijunLength = input(26, title="Kijun Length")
senkouLengthA = input(52, title="Senkou Length A")
senkouLengthB = input(26, title="Senkou Length B")
displacement = input(26, title="Displacement")

// RSI settings
rsiLength = input(14, title="RSI Length")
rsiOverbought = input(70, title="RSI Overbought Level")

// MACD settings
[macdLine, signalLine, _] = ta.macd(close, 12, 26, 9)

// KST settings
roc1 = ta.roc(close, 10)
roc2 = ta.roc(close, 15)
roc3 = ta.roc(close, 20)
roc4 = ta.roc(close, 30)
kst = roc1 * 1 + roc2 * 2 + roc3 * 3 + roc4 * 4
signalKst = ta.sma(kst, 9)

// Calculate Ichimoku Cloud
donchian(len) => math.avg(ta.lowest(len), ta.highest(len))
tenkanSen = donchian(tenkanLength)
kijunSen = donchian(kijunLength)
senkouSpanA = math.avg(tenkanSen, kijunSen)
senkouSpanB = donchian(senkouLengthB)

// Check if price entered the green cloud from below
priceEnteredCloudFromBelow = close[1] < senkouSpanA[displacement] and close > senkouSpanA[displacement] and senkouSpanA > senkouSpanB

// Check RSI and indicator crossovers
rsi = ta.rsi(close, rsiLength)
bullishCrossover = macdLine > signalLine and kst > signalKst

// Entry condition
if priceEnteredCloudFromBelow and rsi < rsiOverbought and bullishCrossover
    strategy.entry("Long Call Option", strategy.long)

// Exit condition based on profit target
for trade_num = 0 to strategy.opentrades - 1
    if strategy.opentrades.profit(trade_num) >= strategy.opentrades.entry_price(trade_num) * 0.30
        strategy.close("Long Call Option")

// Plotting
plot(tenkanSen, title="Tenkan Sen", color=color.red)
plot(kijunSen, title="Kijun Sen", color=color.blue)
p1 = plot(senkouSpanA, title="Senkou Span A", color=color.green)
p2 = plot(senkouSpanB, title="Senkou Span B", color=color.red)
fill(p1, p2, color=color.new(color.green, 90), title="Cloud")
Detail
https://www.fmz.com/strategy/458066
Last Modified
2024-07-29 16:49:42