
11 KiB
Name
多指标组合ATR追踪止损智能交易策略-Multi-Indicator-ATR-Trailing-Stop-Smart-Trading-Strategy
Author
ianzeng123
Strategy Description
[trans]
概述
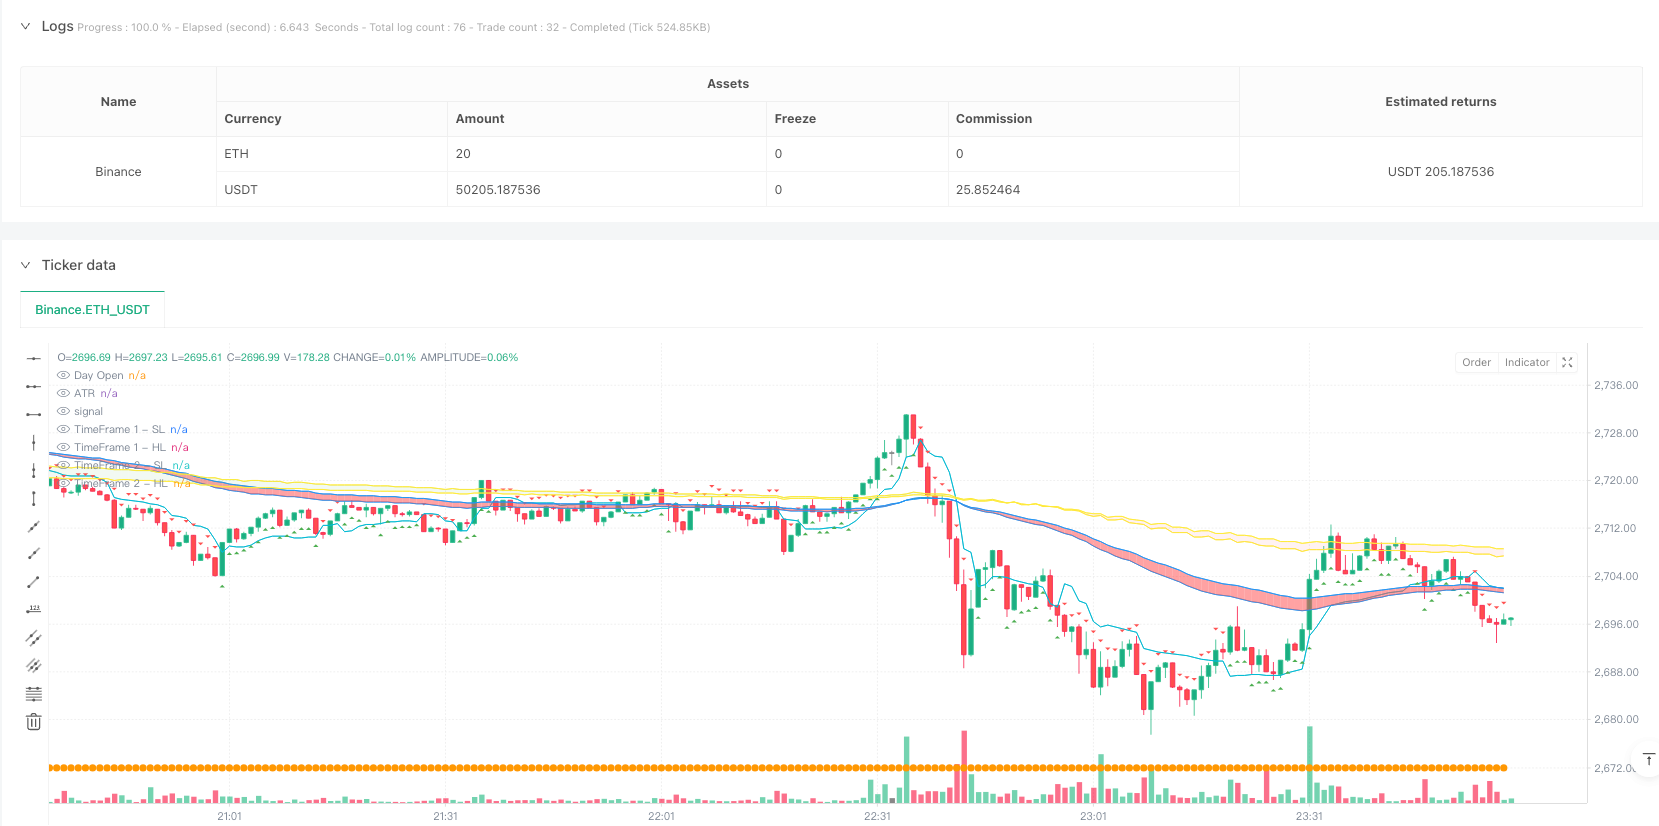
这是一个结合了多个技术指标的智能交易策略,主要基于ATR指标实现追踪止损功能。策略同时整合了均线云层(JLines Cloud)、交易量分析和日内开盘价等多维度分析指标,特别适合在3分钟和5分钟时间周期上进行交易。该策略通过ATR动态调整止损位置,结合均线系统判断趋势方向,实现了一个全面的交易决策系统。
策略原理
策略的核心是基于ATR(平均真实波幅)指标构建的追踪止损系统。它使用10周期ATR和2倍ATR乘数来计算动态止损线。同时整合了两个时间周期的JLines Cloud系统(72/89均线组合),以及可选的5/15均线系统。交易信号的产生需要满足以下条件:
- ATR追踪止损线的突破
- 两个时间周期的JLines Cloud趋势一致
- 价格相对于日内开盘价的位置
- 异常交易量的确认
策略优势
- 动态止损保护 - 通过ATR指标自适应市场波动,提供灵活的止损保护
- 多维度趋势确认 - 利用不同时间周期的均线组合,提高趋势判断的准确性
- 交易量验证 - 通过异常交易量分析增加交易确认度
- 风险管理完善 - 包含固定止损和获利目标的双重保护机制
- 适应性强 - 可以根据不同市场条件调整参数
策略风险
- 参数敏感性 - ATR周期和乘数的选择会显著影响策略表现
- 市场条件依赖 - 在横盘市场可能产生频繁的假信号
- 多重条件限制 - 严格的入场条件可能导致错过部分交易机会
- 滑点影响 - 在高波动期间,实际执行价格可能与信号价格有较大偏差
策略优化方向
- 动态参数调整 - 可以根据市场波动性自动调整ATR参数
- 时间过滤器 - 添加交易时间过滤,避开市场开盘和收盘的高波动期
- 趋势强度过滤 - 引入趋势强度指标,提高趋势判断的准确性
- 风险管理优化 - 实现动态止盈止损比率,适应不同市场环境
- 交易量分析增强 - 细化交易量分析方法,提高交易确认的准确性
总结
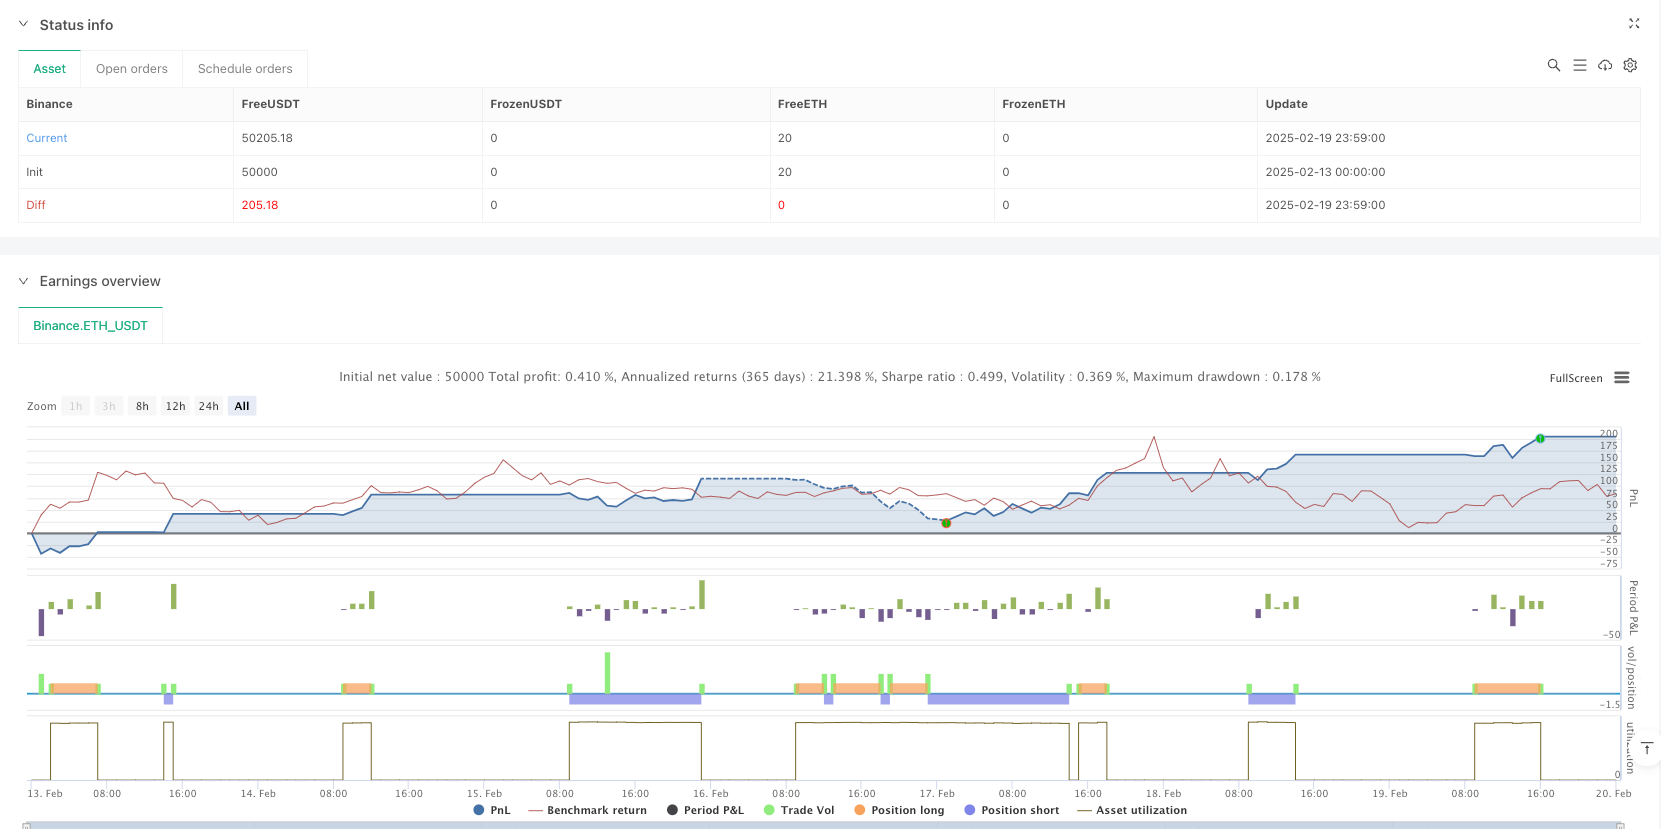
这是一个融合多个技术指标的完整交易系统,通过ATR追踪止损提供核心风险管理,同时利用均线云层和交易量分析提供交易确认。策略的优势在于其全面的市场分析框架和完善的风险管理系统,但需要针对具体市场环境进行参数优化。通过建议的优化方向,策略的稳定性和盈利能力有望得到进一步提升。 ||
Overview
This is an intelligent trading strategy that combines multiple technical indicators, primarily based on the ATR indicator for trailing stop loss functionality. The strategy integrates JLines Cloud, volume analysis, and daily opening price among other multi-dimensional analytical indicators, particularly suitable for trading on 3-minute and 5-minute timeframes. The strategy dynamically adjusts stop-loss positions through ATR while using moving average systems to determine trend direction, creating a comprehensive trading decision system.
Strategy Principles
The core of the strategy is a trailing stop system built on the ATR (Average True Range) indicator. It uses a 10-period ATR with a 2x ATR multiplier to calculate dynamic stop lines. It also incorporates the JLines Cloud system (72/89 EMA combination) across two timeframes, plus an optional 5/15 EMA system. Trade signals are generated based on:
- ATR trailing stop line breakouts
- Consistent trends across both timeframe JLines Clouds
- Price position relative to daily opening price
- Confirmation from unusual volume activity
Strategy Advantages
- Dynamic Stop Protection - Self-adapts to market volatility through ATR indicator
- Multi-dimensional Trend Confirmation - Improves trend judgment accuracy using different timeframe moving average combinations
- Volume Verification - Enhances trade confirmation through unusual volume analysis
- Comprehensive Risk Management - Includes dual protection mechanism with fixed stops and profit targets
- High Adaptability - Parameters can be adjusted for different market conditions
Strategy Risks
- Parameter Sensitivity - ATR period and multiplier choices significantly impact strategy performance
- Market Condition Dependency - May generate frequent false signals in ranging markets
- Multiple Condition Restrictions - Strict entry conditions might lead to missed trading opportunities
- Slippage Impact - Actual execution prices may significantly deviate from signal prices during high volatility
Strategy Optimization Directions
- Dynamic Parameter Adjustment - Automatically adjust ATR parameters based on market volatility
- Time Filters - Add trading time filters to avoid high volatility periods at market open and close
- Trend Strength Filtering - Introduce trend strength indicators to improve trend judgment accuracy
- Risk Management Optimization - Implement dynamic profit/loss ratios for different market environments
- Enhanced Volume Analysis - Refine volume analysis methods to improve trade confirmation accuracy
Summary
This is a complete trading system that integrates multiple technical indicators, providing core risk management through ATR trailing stops while utilizing moving average clouds and volume analysis for trade confirmation. The strategy's strength lies in its comprehensive market analysis framework and robust risk management system, though parameter optimization is needed for specific market environments. Through the suggested optimization directions, the strategy's stability and profitability can be further enhanced. [/trans]
Source (PineScript)
/*backtest
start: 2025-02-13 00:00:00
end: 2025-02-20 00:00:00
period: 1m
basePeriod: 1m
exchanges: [{"eid":"Binance","currency":"ETH_USDT"}]
*/

//@version=6
strategy("AI trade Roney nifty value", overlay=true)

// User Inputs
atrPeriod = input.int(10, "ATR Period")
atrMultiplier = input.float(2, "ATR Multiplier")
target = input.float(40, "Target")
stopLoss = input.float(40, "Stop Loss")

// Calculate ATR-based trailing stop
atr = ta.atr(atrPeriod)
nLoss = atrMultiplier * atr
var float xATRTrailingStop = na

if na(xATRTrailingStop)
    xATRTrailingStop := close - nLoss
else
    if close > xATRTrailingStop[1] and close[1] > xATRTrailingStop[1]
        xATRTrailingStop := math.max(xATRTrailingStop[1], close - nLoss)
    else if close < xATRTrailingStop[1] and close[1] < xATRTrailingStop[1]
        xATRTrailingStop := math.min(xATRTrailingStop[1], close + nLoss)
    else
        xATRTrailingStop := close > xATRTrailingStop[1] ? close - nLoss : close + nLoss

// Define position and entry/exit prices
var int pos = na
pos := close[1] < xATRTrailingStop[1] and close > xATRTrailingStop[1] ? 1 :
       close[1] > xATRTrailingStop[1] and close < xATRTrailingStop[1] ? -1 : pos[1]

var bool isLong = false
var bool isShort = false

var float entryPrice = na
var float exitPrice = na
var float exitStop = na

// JLines Cloud indicator
sl = input.int(72, "Smaller length")
hl = input.int(89, "Higher length")

res = input.timeframe("1", "JLines - Time Frame 1")
res1 = input.timeframe("3", "JLines - Time Frame 2")
enable515 = input.bool(false, "5/15 EMA")
res2 = input.timeframe("5", "5/15 EMA")

ema1_72 = request.security(syminfo.tickerid, res, ta.ema(close, sl))
ema1_89 = request.security(syminfo.tickerid, res, ta.ema(close, hl))
ema2_72 = request.security(syminfo.tickerid, res1, ta.ema(close, sl))
ema2_89 = request.security(syminfo.tickerid, res1, ta.ema(close, hl))
ema3_5 = request.security(syminfo.tickerid, res2, ta.ema(close, 5))
ema3_15 = request.security(syminfo.tickerid, res2, ta.ema(close, 15))

// Plot JLines Cloud
p1_1 = plot(ema1_72, "TimeFrame 1 - SL", color=color.blue, display=display.none)
p1_2 = plot(ema1_89, "TimeFrame 1 - HL", color=color.blue, display=display.none)
p2_1 = plot(ema2_72, "TimeFrame 2 - SL", color=color.yellow, display=display.none)
p2_2 = plot(ema2_89, "TimeFrame 2 - HL", color=color.yellow, display=display.none)
p3_1 = plot(enable515 ? ema3_5 : na, "Late Day Fade - 5 EMA", color=color.yellow, display=display.none)
p3_2 = plot(enable515 ? ema3_15 : na, "Late Day Fade - 15 EMA", color=color.yellow, display=display.none)

fill(p1_1, p1_2, color=ema1_72 > ema1_89 ? color.new(color.green, 30) : color.new(color.red, 30), title="Background 1")
fill(p2_1, p2_2, color=ema2_72 > ema2_89 ? color.new(color.green, 90) : color.new(color.red, 90), title="Background 2")
fill(p3_1, p3_2, color=enable515 ? (ema3_5 > ema3_15 ? color.new(color.blue, 50) : color.new(color.red, 50)) : na, title="Late Day Fade")

// Plot Buy and Sell signals
plotshape(pos == 1, title="Buy", style=shape.triangleup, location=location.belowbar, color=color.green)
plotshape(pos == -1, title="Sell", style=shape.triangledown, location=location.abovebar, color=color.red)

// Volume Analysis
vol_length = input.int(20, "Volume SMA length", minval=1)
vol_avg = ta.sma(volume, vol_length)

unusual_vol_down = volume > vol_avg * 1.2 and close < open
unusual_vol_up = volume > vol_avg * 1.2 and close > open

barcolor(unusual_vol_down or unusual_vol_up ? color.yellow : na)

// ATR Indicator
len2 = input.int(20, minval=1, title="Smooth")
src = input.source(close, title="Source")
out = ta.vwma(src, len2)
avg1 = math.avg(out, xATRTrailingStop) // FIXED: Replaced `ta.avg()` with `math.avg()`

plot(avg1, color=color.aqua, title="ATR")

// Daily Open Line
dl = input.bool(true, "Show daily Open")
dopen = request.security(syminfo.tickerid, "D", open)
plot(dl ? dopen : na, title="Day Open", color=color.orange, style=plot.style_circles, linewidth=2)

// Strategy Entry Conditions
if pos == 1 and not isLong and ema1_72 > ema1_89 and ema2_72 > ema2_89 and ema1_72 > ema2_72 and close > dopen
    entryPrice := close
    exitPrice := close + target
    exitStop := entryPrice - stopLoss
    strategy.entry("Buy", strategy.long)
    strategy.exit("buy_target", "Buy", limit=exitPrice)
    isLong := true
    isShort := false

if pos == -1 and not isShort and ema1_72 < ema1_89 and ema2_72 < ema2_89 and ema1_72 < ema2_72 and close < dopen
    entryPrice := close
    exitPrice := close - target
    exitStop := entryPrice + stopLoss
    strategy.entry("Sell", strategy.short)
    strategy.exit("Sell_target", "Sell", limit=exitPrice)
    isLong := false
    isShort := true

// Stop Loss Handling
if strategy.position_size > 0 and close < entryPrice - stopLoss
    strategy.close("Buy", comment="Buy_Stop Loss")

if strategy.position_size < 0 and close > entryPrice + stopLoss
    strategy.close("Sell", comment="Sell_Stop Loss")
Detail
https://www.fmz.com/strategy/483028
Last Modified
2025-02-21 10:03:26