
13 KiB
Name
多指标组合的高频交易策略指数均线与动量指标相结合的短线交易系统-Multi-Indicator-High-Frequency-Trading-Strategy-Short-Term-Trading-System-Combining-Exponential-Moving-Averages-and-Momentum-Indicators
Author
ChaoZhang
Strategy Description
[trans]
概述
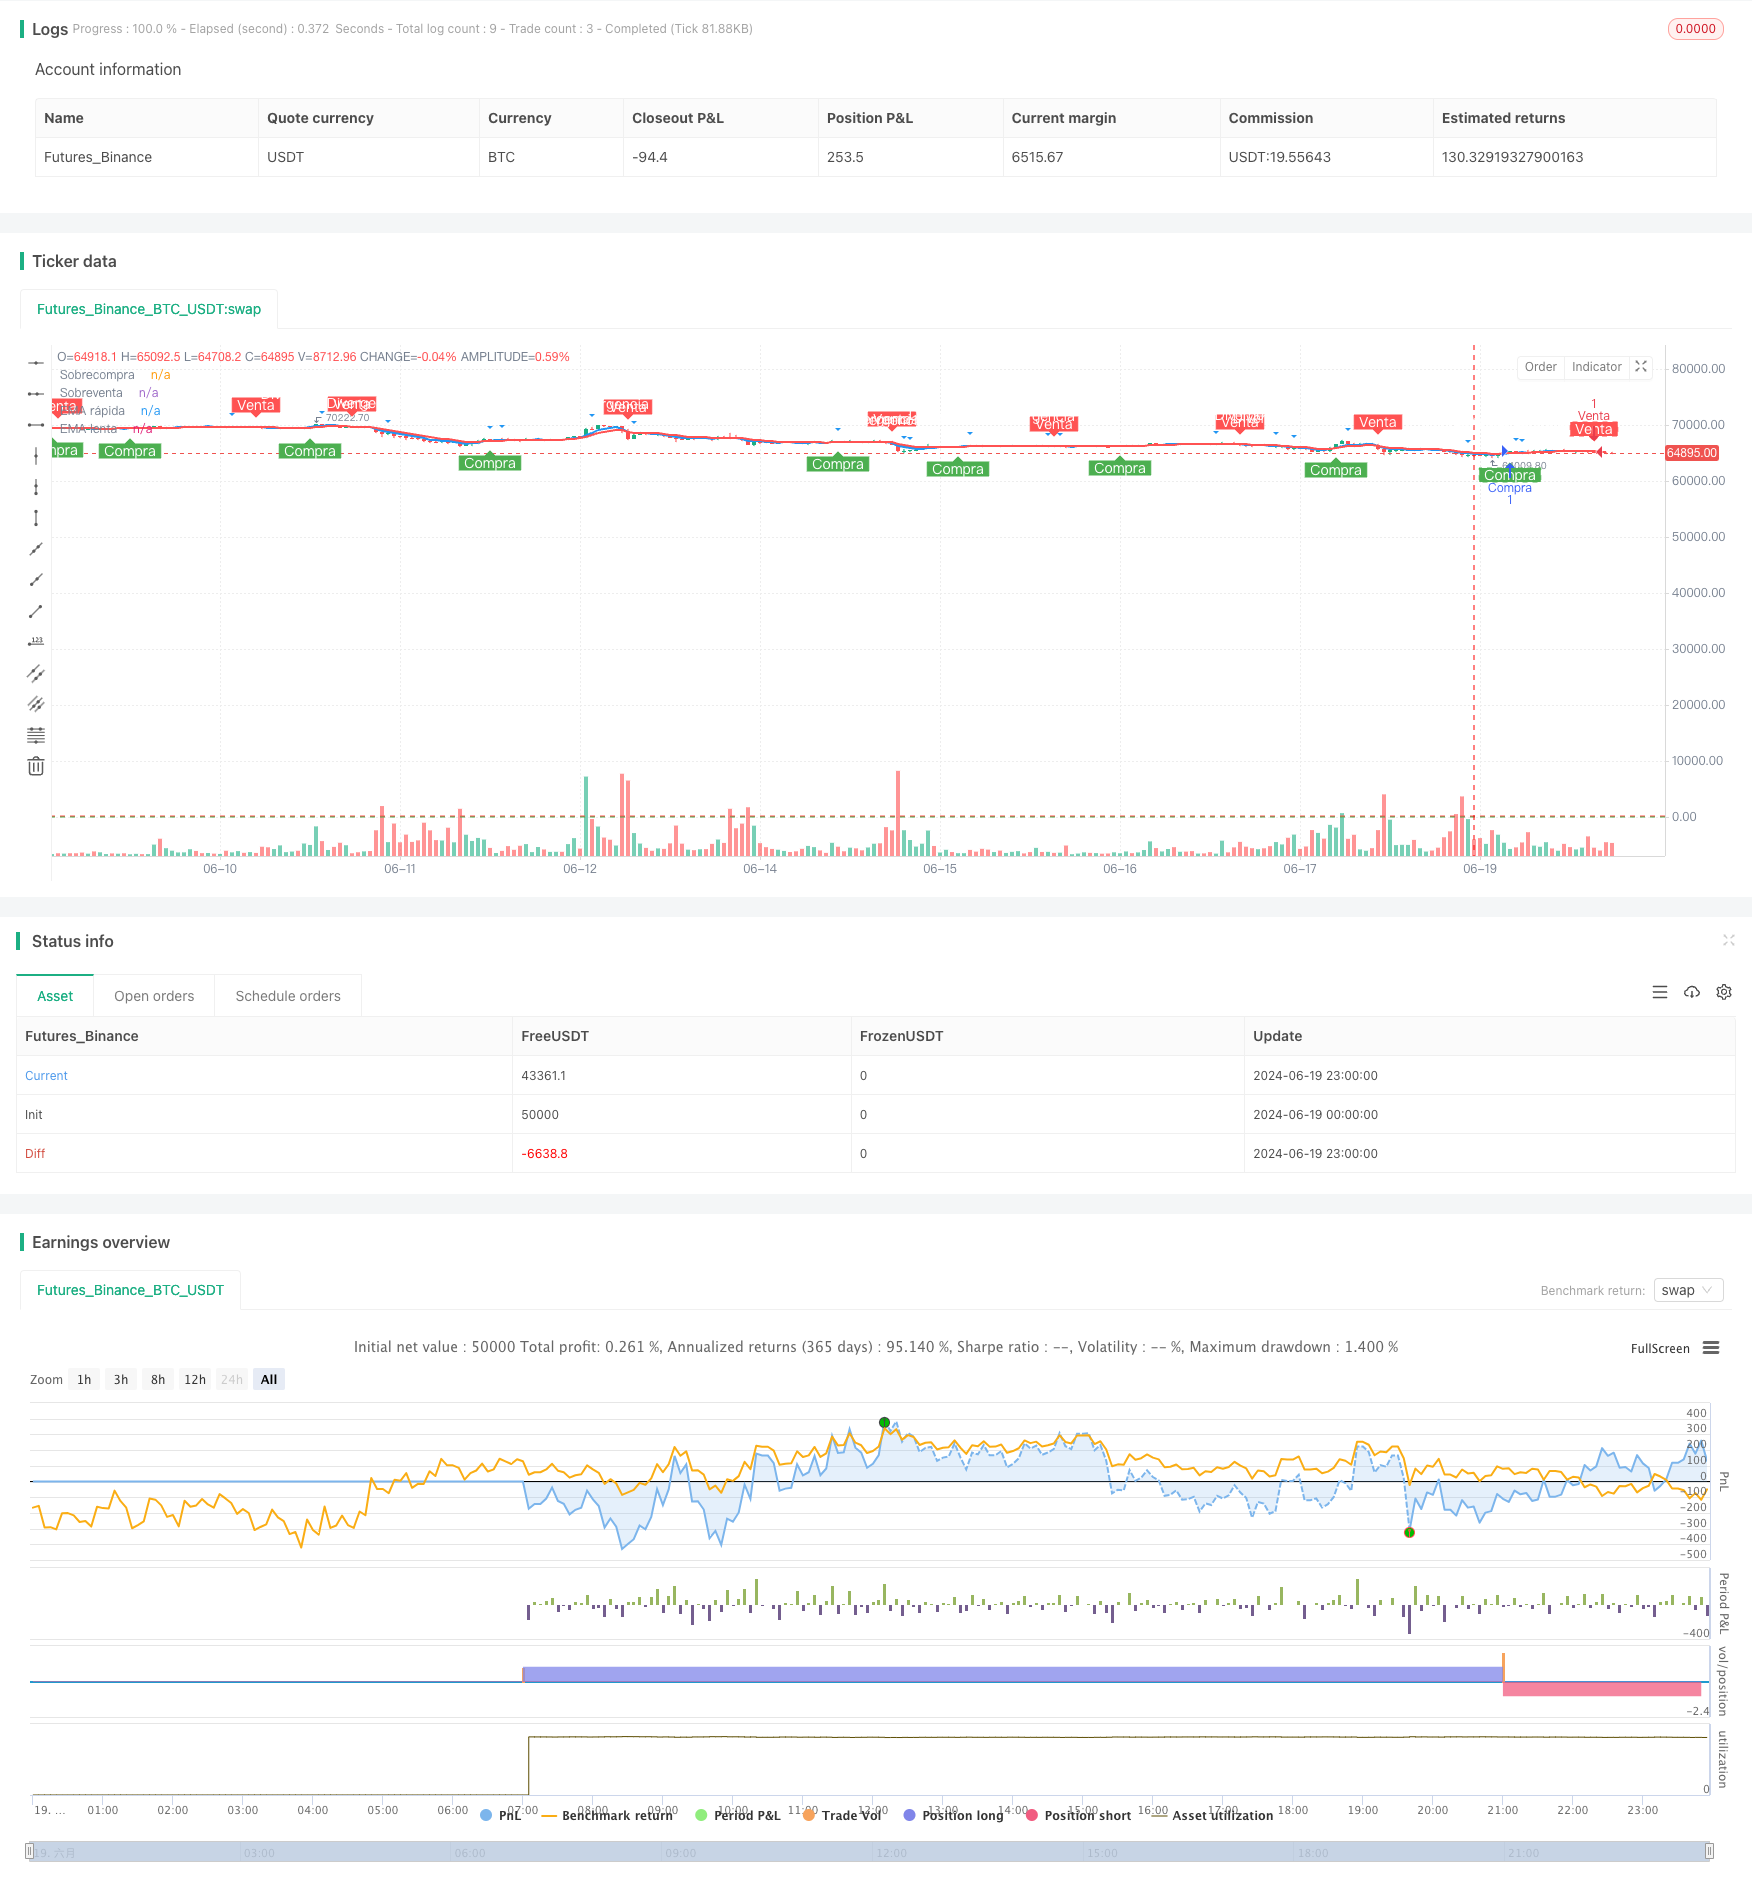
本文介绍了一种结合指数移动平均线(EMA)、相对强弱指标(RSI)和移动平均线趋同背离指标(MACD)的高频交易策略。该策略主要针对短期市场波动,通过多个技术指标的交叉信号和超买超卖水平来捕捉市场短线交易机会。策略的核心在于利用EMA的快速反应特性、RSI的超买超卖指示以及MACD的趋势确认功能,在市场波动中寻找高概率的交易信号。
策略原理
-
EMA交叉信号:策略使用5周期和10周期的EMA。当快速EMA(5周期)上穿慢速EMA(10周期)时,产生买入信号;当快速EMA下穿慢速EMA时,产生卖出信号。
-
RSI超买超卖:使用14周期的RSI指标。RSI值大于70被视为超买,小于30被视为超卖。这些水平用于确认或过滤交易信号。
-
MACD趋势确认:使用MACD指标来确认整体趋势方向,并检测潜在的背离情况。
-
交易信号生成:
- 买入条件:EMA上穿且RSI小于70
- 卖出条件:EMA下穿且RSI大于30
-
背离检测:
- RSI背离:比较RSI高点/低点与价格高点/低点,检测潜在的顶部或底部形成。
- MACD背离:比较MACD线的高点/低点与价格高点/低点,进一步确认潜在的反转信号。
策略优势
-
多指标协同:结合了趋势跟踪(EMA)、动量(RSI)和趋势确认(MACD)指标,提供了全面的市场分析视角。
-
快速响应:使用短周期EMA,能够对价格变化做出迅速反应,适合高频交易环境。
-
过滤假信号:通过RSI的超买超卖水平,有效过滤了部分可能的假突破信号。
-
背离检测:RSI和MACD的背离检测功能为潜在的趋势反转提供了额外的预警。
-
可视化支持:策略提供了清晰的图形界面,包括买卖信号标记、EMA线条和RSI超买超卖水平,有助于交易者直观理解市场状况。
-
灵活性:策略参数(如EMA周期、RSI水平)可以根据不同市场和交易品种进行调整,具有良好的适应性。
策略风险
-
频繁交易:高频交易策略可能导致过度交易,增加交易成本和滑点风险。
-
假信号:在震荡市场中,EMA可能产生频繁的交叉信号,导致错误交易。
-
趋势延续风险:在强势趋势中,RSI可能长期处于超买或超卖状态,可能错过重要的趋势机会。
-
背离判断的主观性:RSI和MACD背离的判断可能存在主观因素,不同交易者可能有不同的解读。
-
参数敏感性:策略性能对EMA周期和RSI水平等参数设置较为敏感,不同市场环境可能需要不同的参数组合。
-
市场噪音:在高波动性市场中,短期指标可能受到市场噪音的影响,产生误导性信号。
策略优化方向
-
动态参数调整:引入自适应机制,根据市场波动性自动调整EMA周期和RSI阈值。
-
增加过滤条件:考虑加入成交量、波动率等额外指标,提高信号质量。
-
止损和利润目标:设计动态止损和利润目标机制,优化风险管理。
-
时间过滤:增加交易时间过滤,避开低流动性时段。
-
多时间框架分析:结合更长期的时间框架分析,提高交易方向的准确性。
-
机器学习优化:使用机器学习算法优化参数选择和信号生成过程。
-
回测与优化:进行大量历史数据回测,找出最优参数组合和市场适应性。
-
情绪指标整合:考虑引入市场情绪指标,如VIX,以更好地捕捉市场转折点。
总结
这种多指标组合的高频交易策略通过整合EMA、RSI和MACD的优势,为短线交易者提供了一个全面的市场分析工具。它能够快速捕捉市场动向,同时通过多重确认机制降低假信号风险。然而,使用此策略时需要注意控制交易频率,合理设置参数,并结合有效的风险管理措施。通过持续优化和适应市场变化,该策略有潜力成为一个稳健的短线交易系统。交易者应当充分理解策略原理,进行充分的回测和实盘验证,并根据个人风险承受能力和交易目标来决定是否采用此策略。
||
Overview
This article introduces a high-frequency trading strategy that combines Exponential Moving Averages (EMA), Relative Strength Index (RSI), and Moving Average Convergence Divergence (MACD). The strategy primarily targets short-term market fluctuations, utilizing crossover signals from multiple technical indicators and overbought/oversold levels to capture short-term trading opportunities. The core of the strategy lies in leveraging the quick response characteristics of EMA, the overbought/oversold indications of RSI, and the trend confirmation function of MACD to identify high-probability trading signals amidst market volatility.
Strategy Principles
-
EMA Crossover Signals: The strategy employs 5-period and 10-period EMAs. A buy signal is generated when the fast EMA (5-period) crosses above the slow EMA (10-period), while a sell signal is produced when the fast EMA crosses below the slow EMA.
-
RSI Overbought/Oversold: A 14-period RSI indicator is used. An RSI value above 70 is considered overbought, while below 30 is oversold. These levels are used to confirm or filter trading signals.
-
MACD Trend Confirmation: The MACD indicator is used to confirm the overall trend direction and detect potential divergences.
-
Trade Signal Generation:
- Buy Condition: EMA crossover to the upside and RSI below 70
- Sell Condition: EMA crossover to the downside and RSI above 30
-
Divergence Detection:
- RSI Divergence: Compares RSI highs/lows with price highs/lows to detect potential top or bottom formations.
- MACD Divergence: Compares MACD line highs/lows with price highs/lows to further confirm potential reversal signals.
Strategy Advantages
-
Multi-Indicator Synergy: Combines trend-following (EMA), momentum (RSI), and trend confirmation (MACD) indicators, providing a comprehensive market analysis perspective.
-
Quick Response: Uses short-period EMAs, enabling rapid reaction to price changes, suitable for high-frequency trading environments.
-
False Signal Filtering: Effectively filters out some potential false breakout signals through RSI's overbought/oversold levels.
-
Divergence Detection: RSI and MACD divergence detection functions provide additional warnings for potential trend reversals.
-
Visual Support: The strategy offers a clear graphical interface, including buy/sell signal markers, EMA lines, and RSI overbought/oversold levels, helping traders intuitively understand market conditions.
-
Flexibility: Strategy parameters (such as EMA periods, RSI levels) can be adjusted for different markets and trading instruments, demonstrating good adaptability.
Strategy Risks
-
Frequent Trading: High-frequency trading strategies may lead to overtrading, increasing transaction costs and slippage risk.
-
False Signals: In oscillating markets, EMAs may produce frequent crossover signals, leading to erroneous trades.
-
Trend Continuation Risk: In strong trends, RSI may remain in overbought or oversold conditions for extended periods, potentially missing important trend opportunities.
-
Subjectivity in Divergence Judgment: The interpretation of RSI and MACD divergences may involve subjective factors, with different traders potentially having different readings.
-
Parameter Sensitivity: Strategy performance is sensitive to parameter settings such as EMA periods and RSI levels, with different market environments potentially requiring different parameter combinations.
-
Market Noise: In highly volatile markets, short-term indicators may be affected by market noise, producing misleading signals.
Strategy Optimization Directions
-
Dynamic Parameter Adjustment: Introduce adaptive mechanisms to automatically adjust EMA periods and RSI thresholds based on market volatility.
-
Additional Filtering Conditions: Consider incorporating additional indicators such as volume and volatility to improve signal quality.
-
Stop-Loss and Profit Targets: Design dynamic stop-loss and profit target mechanisms to optimize risk management.
-
Time Filtering: Add trading time filters to avoid low liquidity periods.
-
Multi-Timeframe Analysis: Incorporate analysis of longer timeframes to improve the accuracy of trading direction.
-
Machine Learning Optimization: Use machine learning algorithms to optimize parameter selection and signal generation processes.
-
Backtesting and Optimization: Conduct extensive historical data backtesting to find optimal parameter combinations and market adaptability.
-
Sentiment Indicator Integration: Consider incorporating market sentiment indicators, such as VIX, to better capture market turning points.
Conclusion
This multi-indicator high-frequency trading strategy provides short-term traders with a comprehensive market analysis tool by integrating the advantages of EMA, RSI, and MACD. It can quickly capture market trends while reducing false signal risks through multiple confirmation mechanisms. However, when using this strategy, it is essential to control trading frequency, set parameters reasonably, and combine effective risk management measures. Through continuous optimization and adaptation to market changes, this strategy has the potential to become a robust short-term trading system. Traders should fully understand the strategy principles, conduct thorough backtesting and live trading validation, and decide whether to adopt this strategy based on their risk tolerance and trading objectives.
[/trans]
Source (PineScript)
/*backtest
start: 2024-06-19 00:00:00
end: 2024-06-20 00:00:00
period: 1h
basePeriod: 15m
exchanges: [{"eid":"Futures_Binance","currency":"BTC_USDT"}]
*/

//@version=5
strategy("Estrategia de Scalping - EMA, RSI y MACD", shorttitle="Scalping EMA RSI MACD", overlay=true)

// Definición de medias móviles
fast_length = input.int(5, title="EMA rápida (periodos)")
slow_length = input.int(10, title="EMA lenta (periodos)")
ema_fast = ta.ema(close, fast_length)
ema_slow = ta.ema(close, slow_length)

// Definición de RSI
rsi_length = input.int(14, title="RSI (periodos)")
rsi = ta.rsi(close, rsi_length)

// Definición de MACD
[macd_line, signal_line, _] = ta.macd(close, fast_length, slow_length, rsi_length) // Incluimos fast_length, slow_length, rsi_length aquí

// Condiciones de entrada y salida
ema_up_cross = ta.crossover(ema_fast, ema_slow)
ema_down_cross = ta.crossunder(ema_fast, ema_slow)
rsi_overbought = rsi > 70
rsi_oversold = rsi < 30

// Detección de divergencias bajistas en el RSI
rsi_high = ta.highest(rsi, 14)
rsi_low = ta.lowest(rsi, 14)
bearish_rsi_divergence = (rsi > rsi_high[1] and close < close[1]) or (rsi < rsi_low[1] and close > close[1])

// Detección de divergencias bajistas en el MACD
macd_high = ta.highest(macd_line, 14)
macd_low = ta.lowest(macd_line, 14)
bearish_macd_divergence = (macd_line > macd_high[1] and close < close[1]) or (macd_line < macd_low[1] and close > close[1])

// Condiciones de compra y venta
buy_condition = ema_up_cross and rsi < 70
sell_condition = ema_down_cross and rsi > 30

// Ejecución de órdenes de compra y venta
if (buy_condition)
    strategy.entry("Compra", strategy.long)
if (sell_condition)
    strategy.entry("Venta", strategy.short)

// Plot señales de compra y venta
plotshape(series=buy_condition, title="Señal de Compra", location=location.belowbar, color=color.green, style=shape.labelup, text="Compra", textcolor=color.white)
plotshape(series=sell_condition, title="Señal de Venta", location=location.abovebar, color=color.red, style=shape.labeldown, text="Venta", textcolor=color.white)
plotshape(series=bearish_rsi_divergence, title="Divergencia Bajista en RSI", location=location.abovebar, color=color.red, style=shape.triangledown, text="Divergencia RSI", textcolor=color.white)
plotshape(series=bearish_macd_divergence, title="Divergencia Bajista en MACD", location=location.abovebar, color=color.blue, style=shape.triangledown, text="Divergencia MACD", textcolor=color.white)

// Trazado de medias móviles para visualización
plot(ema_fast, color=color.blue, linewidth=2, title="EMA rápida")
plot(ema_slow, color=color.red, linewidth=2, title="EMA lenta")

// Trazado de niveles de sobrecompra y sobreventa para RSI
hline(70, "Sobrecompra", color=color.red, linestyle=hline.style_dashed)
hline(30, "Sobreventa", color=color.green, linestyle=hline.style_dashed)
Detail
https://www.fmz.com/strategy/454740
Last Modified
2024-06-21 15:23:13