
22 KiB
Name
多指标确认动态追踪突破量化交易策略-Multi-Indicator-Confirmation-Dynamic-Trailing-Breakout-Quantitative-Trading-Strategy
Author
ianzeng123
Strategy Description
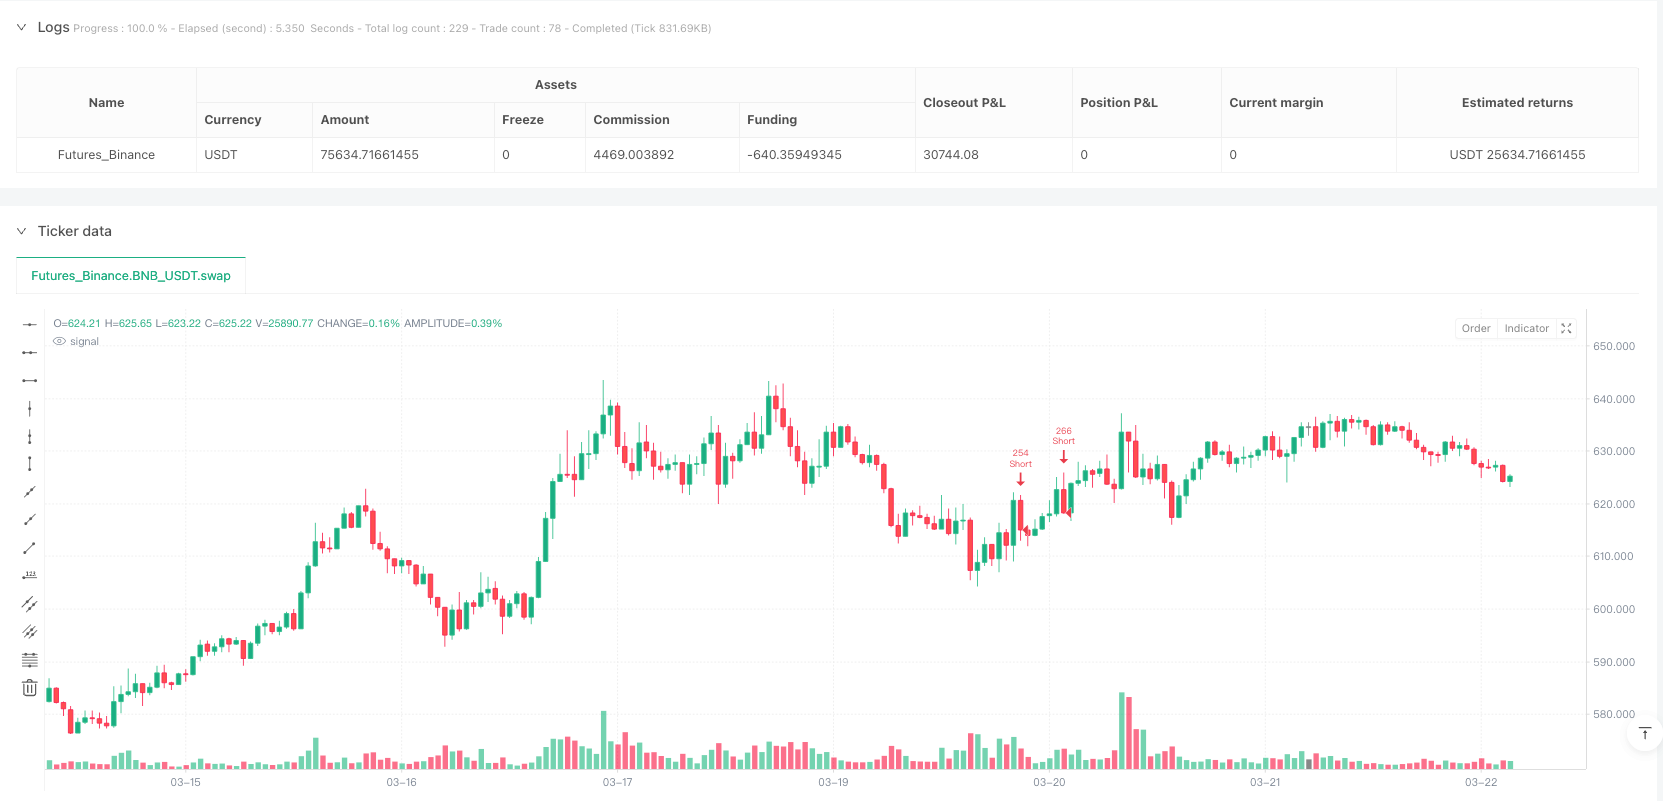
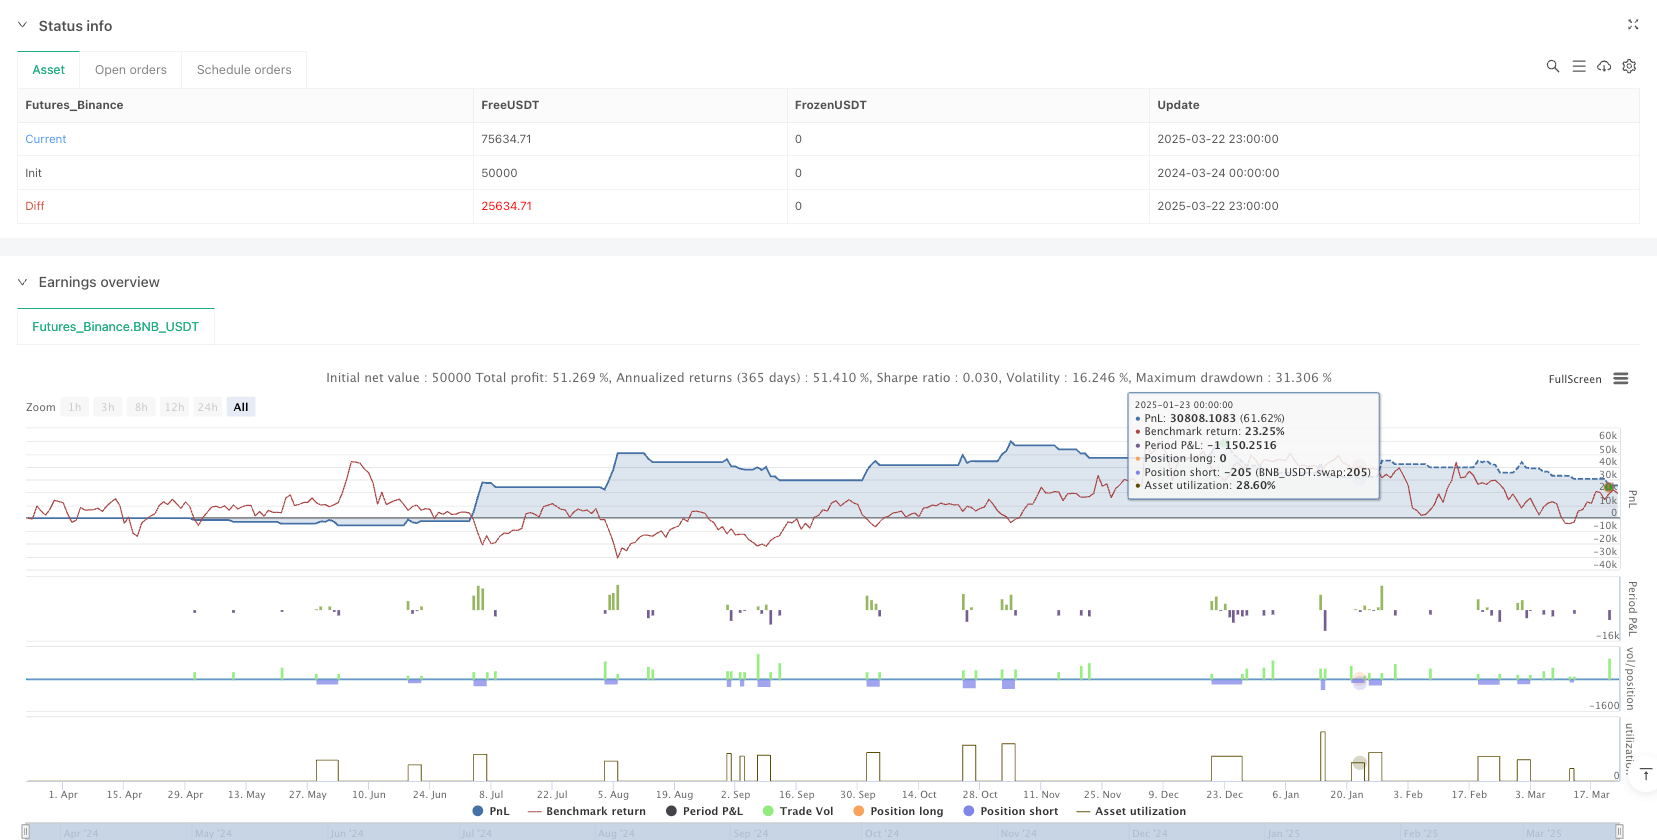
[trans]
概述
MomentumBreakout V1.2是一种结合了多指标确认系统与动态头寸管理的量化交易策略。该策略核心设计理念是通过多重技术指标(EMA、RSI、MACD)协同确认市场趋势,在价格突破关键位置时入场,并配合ATR动态调整止损位置,实现对趋势行情的有效把握。策略采用基于账户净值和波动率的智能仓位控制,同时结合动态杠杆调整和时间退出机制,以优化资金利用率并控制风险敞口。该策略同时支持多空双向交易,可适应不同市场环境,特别适合在明确趋势行情中捕捉中短期价格突破机会。
策略原理
MomentumBreakout V1.2策略运作基于多层指标确认系统和严格的风险控制机制。其核心交易逻辑如下:
-
多指标趋势确认:
- 策略利用快速EMA(15周期)和慢速EMA(40周期)建立基础趋势判断框架
- 同时引入1小时时间周期的RSI和MACD指标作为辅助确认,减少假突破信号
- 多头入场要求:价格上穿快速EMA,且快速EMA>慢速EMA,1小时RSI>50,1小时MACD为看涨状态,价格位于20周期SMA之上
- 空头入场要求:价格下穿慢速EMA,且快速EMA<慢速EMA,ATR波动率上升
-
动态头寸管理:
- 基于账户净值、设定风险比例和ATR波动率计算每笔交易头寸大小
- 通过公式:(净值风险百分比)/(1.2ATR)确定基础头寸
- 动态调整杠杆倍数,最高可达设定的基础杠杆(默认5倍),并根据市场波动率自动降低杠杆以控制风险
-
智能止损系统:
- 初始止损设置为入场价格±1.2倍ATR(多头为下方,空头为上方)
- 采用ATR追踪止损机制,随着价格向有利方向移动,止损线以0.5倍ATR的距离跟随调整
- 这种设计既保护既有利润,又给予价格足够的波动空间
-
时间约束退出:
- 设定最大持仓时间(默认为72根K线,以10分钟周期计算约为12小时)
- 超过设定周期自动平仓,避免长时间暴露于市场风险
-
交易费用考量:
- 将交易费用纳入策略计算,默认设置为0.1%
- 考虑双向(进出场)费用,使回测结果更贴近实际交易环境
策略优势
深入分析MomentumBreakout V1.2策略代码,该策略展现出多方面的优势:
-
多维度趋势确认:通过结合不同时间周期(10分钟和1小时)的多个技术指标(EMA、RSI、MACD),形成立体趋势判断系统,有效减少假突破信号,提高入场质量。
-
智能风险控制:每笔交易风险限制在账户净值的固定比例(默认0.5%),确保单笔交易亏损不会对账户造成重大影响,实现资金的长期稳健增长。
-
波动率自适应调整:基于ATR指标动态调整头寸大小和杠杆倍数,在高波动市场自动降低风险敞口,在低波动市场适度提高资金利用率,实现"顺势而为"的波动率管理。
-
多层次止损保护:结合初始固定止损和动态追踪止损,既限制最大可能损失,又能随着价格有利移动锁定部分利润,避免回撤过大。
-
时间风险限制:通过强制时间退出机制,避免资金长时间陷入单一交易,提高资金利用效率并防止过度暴露于市场风险中。
-
全参数定制:所有关键参数(EMA周期、ATR设置、风险百分比、杠杆倍数、持仓时间等)均可通过输入界面调整,使策略能够适应不同市场环境和个人风险偏好。
-
双向交易能力:同时支持多头和空头策略,能够在不同市场趋势中寻找交易机会,相比单向策略具有更强的适应性。
策略风险
尽管MomentumBreakout V1.2策略设计考虑了多层风险控制,但仍存在以下潜在风险:
-
震荡市场风险:该策略基于趋势跟踪和突破理念设计,在缺乏明确方向的震荡市场中可能产生频繁的假突破信号,导致连续止损出局,形成"止损轮回"。
- 解决方法:可考虑增加波动率过滤器,在识别到高波动无趋势市场时临时降低杠杆或暂停交易。
-
极端行情风险:在市场闪崩或暴涨等极端行情中,价格可能直接跳过止损价格,导致实际止损价格远低于(多头)或远高于(空头)预期止损位,造成超预期亏损。
- 解决方法:考虑设置最大允许亏损比例,或引入基于波动率的动态风险调整机制。
-
指标滞后风险:所有技术指标本质上具有一定滞后性,特别是EMA和MACD等均线类指标,可能导致入场时机偏后,错过部分行情。
- 解决方法:考虑引入前瞻性指标(如价格结构、成交量分析)作为辅助确认手段。
-
参数优化陷阱:过度针对历史数据优化参数可能导致"过拟合"问题,使策略在实盘交易中表现不及回测。
- 解决方法:采用多样化的测试数据集,包括不同市场环境,并保持参数相对稳健而非追求极致优化。
-
杠杆放大风险:虽然策略设计了动态杠杆调整机制,但基础杠杆设置仍可能在连续不利行情中放大亏损。
- 解决方法:降低基础杠杆设置,或增加连续亏损限制器,在连续止损后自动降低风险敞口。
-
时间退出机制的双面性:固定的时间退出机制虽然有助于控制风险暴露,但也可能在强趋势中过早结束盈利交易。
- 解决方法:考虑基于利润目标和趋势强度动态调整持仓时间。
策略优化方向
基于对MomentumBreakout V1.2策略代码的深入分析,以下是几个可能的优化方向:
-
波动率状态分类:引入波动率周期性分析,将市场划分为"趋势型"和"震荡型"两种状态,并针对不同状态动态调整策略参数。这可以帮助策略更好地适应不同市场环境,减少震荡市场中的假信号。
-
多时间周期协同:扩展当前的多时间周期框架,增加更长周期(如4小时或日线)的趋势确认,建立三层时间周期协同系统,提高趋势判断的稳定性和可靠性。
-
成交量确认机制:将成交量指标纳入突破确认系统,要求价格突破时伴随成交量放大,这有助于识别更具潜力的真实突破。
-
动态时间退出:将当前固定的时间退出机制升级为基于趋势强度和利润表现的动态退出系统,在强趋势中允许持仓时间延长,在弱趋势中提前结束交易。
-
机器学习优化:引入简单的机器学习算法来动态评估市场环境和突破质量,实现参数的自适应调整,减少人为干预并提高策略适应性。
-
回撤控制优化:增加基于账户净值回撤的风险控制机制,在账户出现连续亏损或达到特定回撤比例时,自动降低风险敞口或暂停交易,直至市场环境改善。
-
资金管理升级:引入基于凯利公式的动态资金管理系统,根据历史胜率和盈亏比动态调整每笔交易的风险比例,最大化长期资金增长率。
-
参数自适应:开发参数自适应模块,使EMA周期、ATR乘数等关键参数能够根据近期市场波动特性动态调整,提高策略的自适应能力。
总结
MomentumBreakout V1.2是一个结合了多指标确认系统、动态头寸管理和智能止损机制的全面量化交易策略。通过EMA、RSI、MACD等技术指标的协同确认,该策略能够有效识别价格突破机会;借助基于ATR的动态头寸计算和追踪止损机制,实现对资金风险的精确控制;同时通过时间约束退出和动态杠杆调整,平衡了收益潜力与风险敞口。
该策略特别适合在具有明确方向的趋势市场中运行,能够在多空双向上捕捉中短期价格突破机会。然而,在无趋势的震荡市场中可能面临假突破和频繁止损的挑战。未来优化可着重于市场环境分类、多时间周期协同、成交量确认及动态参数调整等方向,进一步提升策略的适应性和稳健性。
总体而言,MomentumBreakout V1.2提供了一个结构清晰、逻辑严谨的量化交易框架,既可直接应用于实际交易,也可作为更复杂交易系统的基础模块,具有较高的实用价值和扩展潜力。 ||
Overview
MomentumBreakout V1.2 is a quantitative trading strategy that combines a multi-indicator confirmation system with dynamic position management. The core design philosophy is to confirm market trends through multiple technical indicators (EMA, RSI, MACD), enter positions when prices break through key levels, and adjust stop-loss positions dynamically using ATR to effectively capture trending markets. The strategy employs intelligent position control based on account equity and volatility, combined with dynamic leverage adjustment and time-based exit mechanisms to optimize capital utilization and control risk exposure. The strategy supports both long and short trading directions, adapting to different market environments, and is particularly suitable for capturing medium to short-term price breakout opportunities in clearly trending markets.
Strategy Principles
MomentumBreakout V1.2 operates based on a multi-layered indicator confirmation system and strict risk control mechanisms. Its core trading logic is as follows:
-
Multi-Indicator Trend Confirmation:
- The strategy uses fast EMA (15 periods) and slow EMA (40 periods) to establish a basic trend determination framework
- It also incorporates 1-hour timeframe RSI and MACD indicators as auxiliary confirmations to reduce false breakout signals
- Long entry requirements: price crosses above fast EMA, fast EMA > slow EMA, 1-hour RSI > 50, 1-hour MACD is bullish, price is above the 20-period SMA
- Short entry requirements: price crosses below slow EMA, fast EMA < slow EMA, ATR volatility is rising
-
Dynamic Position Management:
- Calculates position size for each trade based on account equity, set risk percentage, and ATR volatility
- Determines base position through the formula: (equity * risk percentage) / (1.2 * ATR)
- Dynamically adjusts leverage multiple, up to the set base leverage (default 5x), and automatically reduces leverage based on market volatility to control risk
-
Intelligent Stop-Loss System:
- Initial stop-loss is set at entry price ± 1.2 times ATR (below for longs, above for shorts)
- Employs ATR trailing stop mechanism, adjusting the stop-loss line at a distance of 0.5 times ATR as price moves favorably
- This design both protects existing profits and gives price sufficient room to fluctuate
-
Time-Constrained Exit:
- Sets maximum holding time (default is 72 bars, approximately 12 hours at 10-minute intervals)
- Automatically closes positions after the set period to avoid prolonged exposure to market risk
-
Trading Fee Consideration:
- Incorporates trading fees into strategy calculations, default setting at 0.1%
- Considers two-way (entry and exit) fees, making backtest results closer to actual trading environments
Strategy Advantages
A deep analysis of the MomentumBreakout V1.2 strategy code reveals several advantages:
-
Multi-dimensional Trend Confirmation: By combining multiple technical indicators (EMA, RSI, MACD) across different timeframes (10-minute and 1-hour), it forms a three-dimensional trend judgment system, effectively reducing false breakout signals and improving entry quality.
-
Intelligent Risk Control: Each trade's risk is limited to a fixed percentage of account equity (default 0.5%), ensuring that single trade losses will not significantly impact the account, achieving long-term stable capital growth.
-
Volatility-Adaptive Adjustment: Dynamically adjusts position size and leverage multiple based on the ATR indicator, automatically reducing risk exposure in high-volatility markets and moderately increasing capital utilization in low-volatility markets, achieving volatility management that "follows the trend."
-
Multi-level Stop-Loss Protection: Combines initial fixed stop-loss with dynamic trailing stop-loss, both limiting maximum possible losses and locking in partial profits as price moves favorably, avoiding excessive drawdowns.
-
Time Risk Limitation: Through forced time-based exit mechanisms, avoids capital being trapped in a single trade for extended periods, improving capital utilization efficiency and preventing excessive exposure to market risk.
-
Full Parameter Customization: All key parameters (EMA periods, ATR settings, risk percentage, leverage multiple, holding time, etc.) can be adjusted through the input interface, allowing the strategy to adapt to different market environments and personal risk preferences.
-
Bi-directional Trading Capability: Supports both long and short strategies simultaneously, able to find trading opportunities in different market trends, providing stronger adaptability compared to unidirectional strategies.
Strategy Risks
Despite the multi-layered risk control considerations in the MomentumBreakout V1.2 strategy design, the following potential risks remain:
-
Oscillating Market Risk: This strategy is designed based on trend-following and breakout concepts, which may generate frequent false breakout signals in oscillating markets lacking clear direction, leading to consecutive stop-loss exits and forming a "stop-loss cycle."
- Solution: Consider adding a volatility filter to temporarily reduce leverage or pause trading when high-volatility, non-trending markets are identified.
-
Extreme Market Risk: In market flash crashes or surges, prices may jump directly past stop-loss prices, causing actual stop-loss prices to be far lower (for longs) or higher (for shorts) than expected, resulting in losses beyond expectations.
- Solution: Consider setting maximum allowable loss percentages or introducing volatility-based dynamic risk adjustment mechanisms.
-
Indicator Lag Risk: All technical indicators inherently have a certain lag, especially moving average-type indicators like EMA and MACD, which may lead to delayed entry timing and missing parts of market movements.
- Solution: Consider introducing forward-looking indicators (such as price structure, volume analysis) as auxiliary confirmation methods.
-
Parameter Optimization Trap: Excessive optimization of parameters against historical data may lead to "overfitting" issues, causing strategy performance in live trading to fall short of backtesting results.
- Solution: Use diverse testing datasets including different market environments, and maintain relatively robust parameters rather than pursuing extreme optimization.
-
Leverage Amplification Risk: Although the strategy includes dynamic leverage adjustment mechanisms, the base leverage setting may still amplify losses during consecutive adverse market movements.
- Solution: Lower the base leverage setting or add consecutive loss limiters that automatically reduce risk exposure after consecutive stop-losses.
-
Dual Nature of Time Exit Mechanism: Fixed time exit mechanisms, while helpful for controlling risk exposure, may also prematurely end profitable trades during strong trends.
- Solution: Consider dynamically adjusting holding time based on profit targets and trend strength.
Strategy Optimization Directions
Based on a deep analysis of the MomentumBreakout V1.2 strategy code, here are several possible optimization directions:
-
Volatility State Classification: Introduce volatility cycle analysis to categorize the market into "trending" and "oscillating" states, and dynamically adjust strategy parameters for different states. This can help the strategy better adapt to different market environments and reduce false signals in oscillating markets.
-
Multi-Timeframe Collaboration: Expand the current multi-timeframe framework to include longer timeframe (such as 4-hour or daily) trend confirmation, establishing a three-layer timeframe collaboration system to improve the stability and reliability of trend judgment.
-
Volume Confirmation Mechanism: Incorporate volume indicators into the breakout confirmation system, requiring price breakouts to be accompanied by increased volume, which helps identify more potentially genuine breakouts.
-
Dynamic Time Exit: Upgrade the current fixed time exit mechanism to a dynamic exit system based on trend strength and profit performance, allowing extended holding times during strong trends and earlier trade termination during weak trends.
-
Machine Learning Optimization: Introduce simple machine learning algorithms to dynamically evaluate market environments and breakout quality, achieving adaptive parameter adjustment, reducing human intervention, and improving strategy adaptability.
-
Drawdown Control Optimization: Add risk control mechanisms based on account equity drawdown, automatically reducing risk exposure or pausing trading when the account experiences consecutive losses or reaches specific drawdown percentages, until market conditions improve.
-
Capital Management Upgrade: Introduce a dynamic capital management system based on the Kelly formula, dynamically adjusting the risk percentage for each trade according to historical win rates and profit/loss ratios, maximizing long-term capital growth rates.
-
Parameter Self-Adaptation: Develop a parameter self-adaptation module enabling key parameters such as EMA periods and ATR multipliers to dynamically adjust based on recent market volatility characteristics, improving the strategy's self-adaptation capabilities.
Conclusion
MomentumBreakout V1.2 is a comprehensive quantitative trading strategy that combines multi-indicator confirmation systems, dynamic position management, and intelligent stop-loss mechanisms. Through the collaborative confirmation of technical indicators such as EMA, RSI, and MACD, the strategy can effectively identify price breakout opportunities; through ATR-based dynamic position calculation and trailing stop mechanisms, it achieves precise control over capital risk; while through time-constrained exits and dynamic leverage adjustments, it balances profit potential with risk exposure.
The strategy is particularly suitable for operation in trending markets with clear direction, capable of capturing medium to short-term price breakout opportunities in both long and short directions. However, it may face challenges of false breakouts and frequent stop-losses in non-trending, oscillating markets. Future optimizations could focus on market environment classification, multi-timeframe collaboration, volume confirmation, and dynamic parameter adjustment to further enhance the strategy's adaptability and robustness.
Overall, MomentumBreakout V1.2 provides a clearly structured and logically rigorous quantitative trading framework that can be directly applied to actual trading or serve as a foundational module for more complex trading systems, offering high practical value and expansion potential.[/trans]
Source (PineScript)
/*backtest
start: 2024-03-24 00:00:00
end: 2025-03-23 00:00:00
period: 1h
basePeriod: 1h
exchanges: [{"eid":"Futures_Binance","currency":"BNB_USDT"}]
*/

//@version=6
strategy("MomentumBreakout V1.2 - DOGE/USDT", overlay=true, margin_long=20, margin_short=20)

// === Core Parameters ===
emaFast = input.int(15, "Fast EMA Length", minval=10, maxval=50)
emaSlow = input.int(40, "Slow EMA Length", minval=20, maxval=100)
atrPeriod = input.int(14, "ATR Period", minval=1, maxval=50)
riskPct = input.float(0.5, "Risk Per Trade (%)", minval=0.1, maxval=5.0, step=0.1)
baseLeverage = input.float(5.0, "Base Leverage", minval=1.0, maxval=20.0, step=0.5)
feeRate = input.float(0.1, "Fee Rate (%)", minval=0.0, maxval=1.0, step=0.01)
maxHoldBars = input.int(72, "Max Hold Bars (12H)", minval=1, maxval=1000)
rsiPeriod = input.int(14, "RSI Period", minval=5, maxval=50)
macdFast = input.int(12, "MACD Fast Length", minval=5, maxval=50)
macdSlow = input.int(26, "MACD Slow Length", minval=5, maxval=50)
macdSignal = input.int(9, "MACD Signal Length", minval=1, maxval=50)

// === Calculate Indicators ===
// EMA (10m)
emaFastValue = ta.ema(close, emaFast)
emaSlowValue = ta.ema(close, emaSlow)

// ATR
atrValue = ta.atr(atrPeriod)

// RSI (10m and 1H)
rsiValue = ta.rsi(close, rsiPeriod)
rsiValue_1h = request.security(syminfo.tickerid, "60", ta.rsi(close, rsiPeriod)[1], barmerge.gaps_off)

// MACD (1H)
[macdLine_1h, signalLine_1h, _] = request.security(syminfo.tickerid, "60", ta.macd(close, macdFast, macdSlow, macdSignal), barmerge.gaps_off)
macdLine_1h := macdLine_1h[1]
signalLine_1h := signalLine_1h[1]

// Trend Confirmation
trendUp_1h = emaFastValue > emaSlowValue and rsiValue_1h > 50 and macdLine_1h > signalLine_1h
trendDown_1h = emaFastValue < emaSlowValue
breakoutLong = ta.crossover(close, emaFastValue) and trendUp_1h and close > ta.sma(close, 20) and not na(emaFastValue)
breakoutShort = ta.crossunder(close, emaSlowValue) and trendDown_1h and atrValue > ta.sma(atrValue, 14) and not na(emaSlowValue)
noActivePosition = strategy.position_size == 0

// === Dynamic Position Sizing ===
equity = strategy.equity
riskAmount = equity * (riskPct / 100)
stopDistance = atrValue * 1.2  // Tightened to 1.2x ATR
leverage = baseLeverage * math.min(1.0, 1.0 / (atrValue / close))
positionSize = math.round((riskAmount / stopDistance) * leverage)

// === Trailing Stop ===
var float longStopPrice = 0.0
var float shortStopPrice = 0.0
var int entryBarIndex = 0

if breakoutLong
    longStopPrice := close - (atrValue * 1.2)
    entryBarIndex := bar_index

if breakoutShort
    shortStopPrice := close + (atrValue * 1.2)
    entryBarIndex := bar_index

if strategy.position_size > 0
    longStopPrice := math.max(longStopPrice, close - (atrValue * 0.5))
if strategy.position_size < 0
    shortStopPrice := math.min(shortStopPrice, close + (atrValue * 0.5))

// === Time-based Exit ===
barsSinceEntry = bar_index - entryBarIndex
if strategy.position_size != 0 and barsSinceEntry >= maxHoldBars
    strategy.close_all(comment="Time Exit")

// === Strategy Execution ===
if breakoutLong and noActivePosition
    strategy.entry("Long", strategy.long, qty=positionSize)
    strategy.exit("Long Exit", "Long", stop=longStopPrice, qty_percent=100, comment="Long Exit")

if breakoutShort and noActivePosition
    strategy.entry("Short", strategy.short, qty=positionSize)
    strategy.exit("Short Exit", "Short", stop=shortStopPrice, qty_percent=100, comment="Short Exit")

// === Fee Calculation ===
feeCost = positionSize * close * (feeRate / 100) * 2
Detail
https://www.fmz.com/strategy/488020
Last Modified
2025-03-24 14:20:27