
8.5 KiB
Name
多指标整合日内量化交易策略基于VWAP-Fibonacci-RSI-SMA的动态信号系统-Multi-Indicator-Intraday-Quantitative-Trading-Strategy-Dynamic-Signal-System-Based-on-VWAP-Fibonacci-RSI-SMA
Author
ianzeng123
Strategy Description
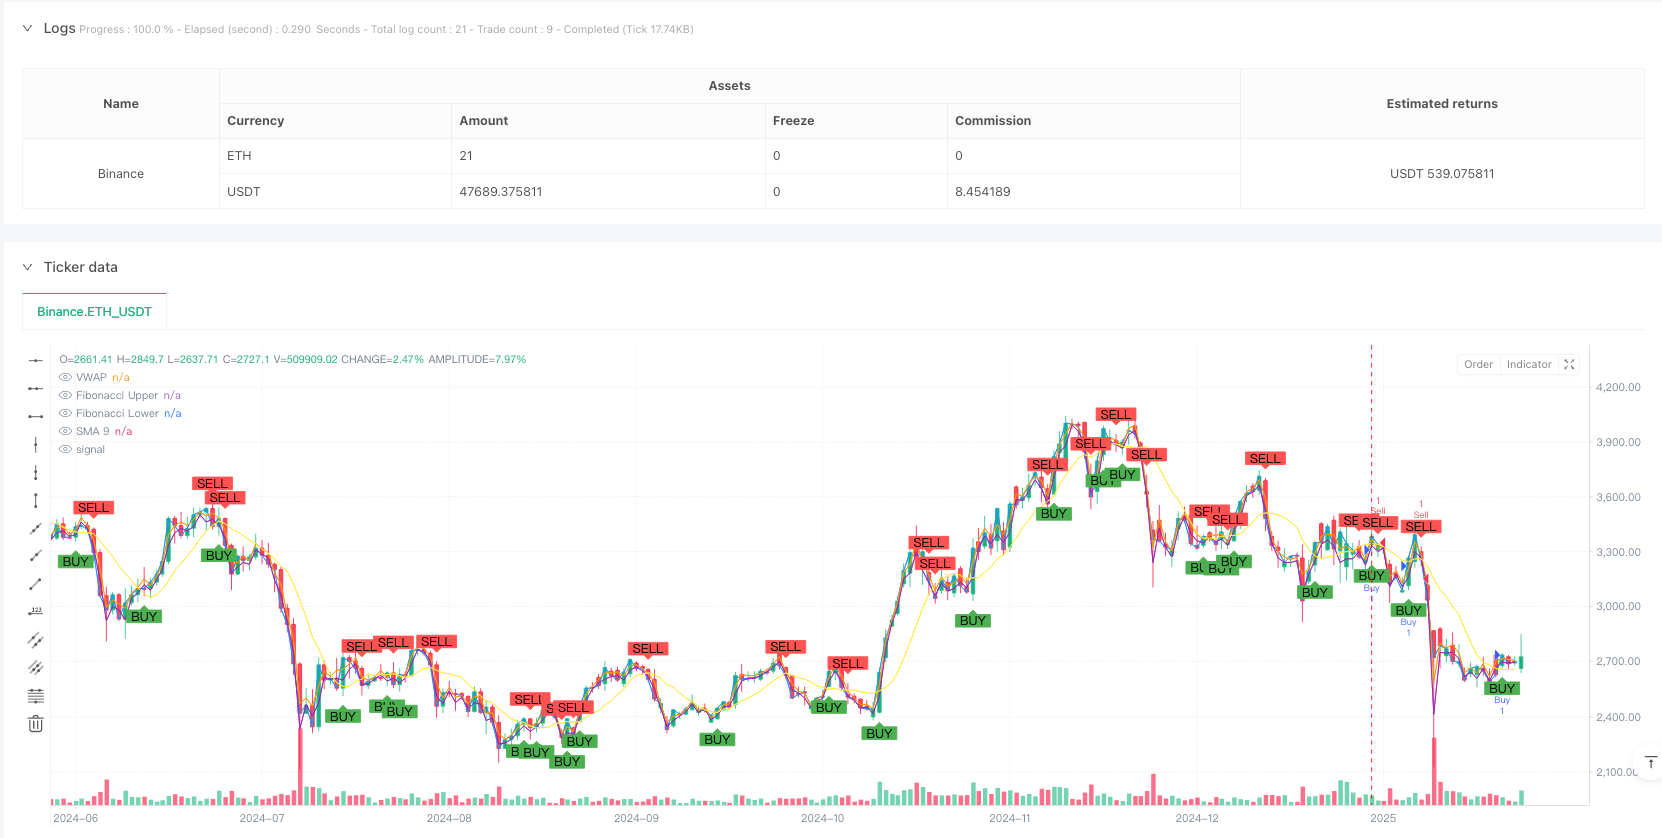
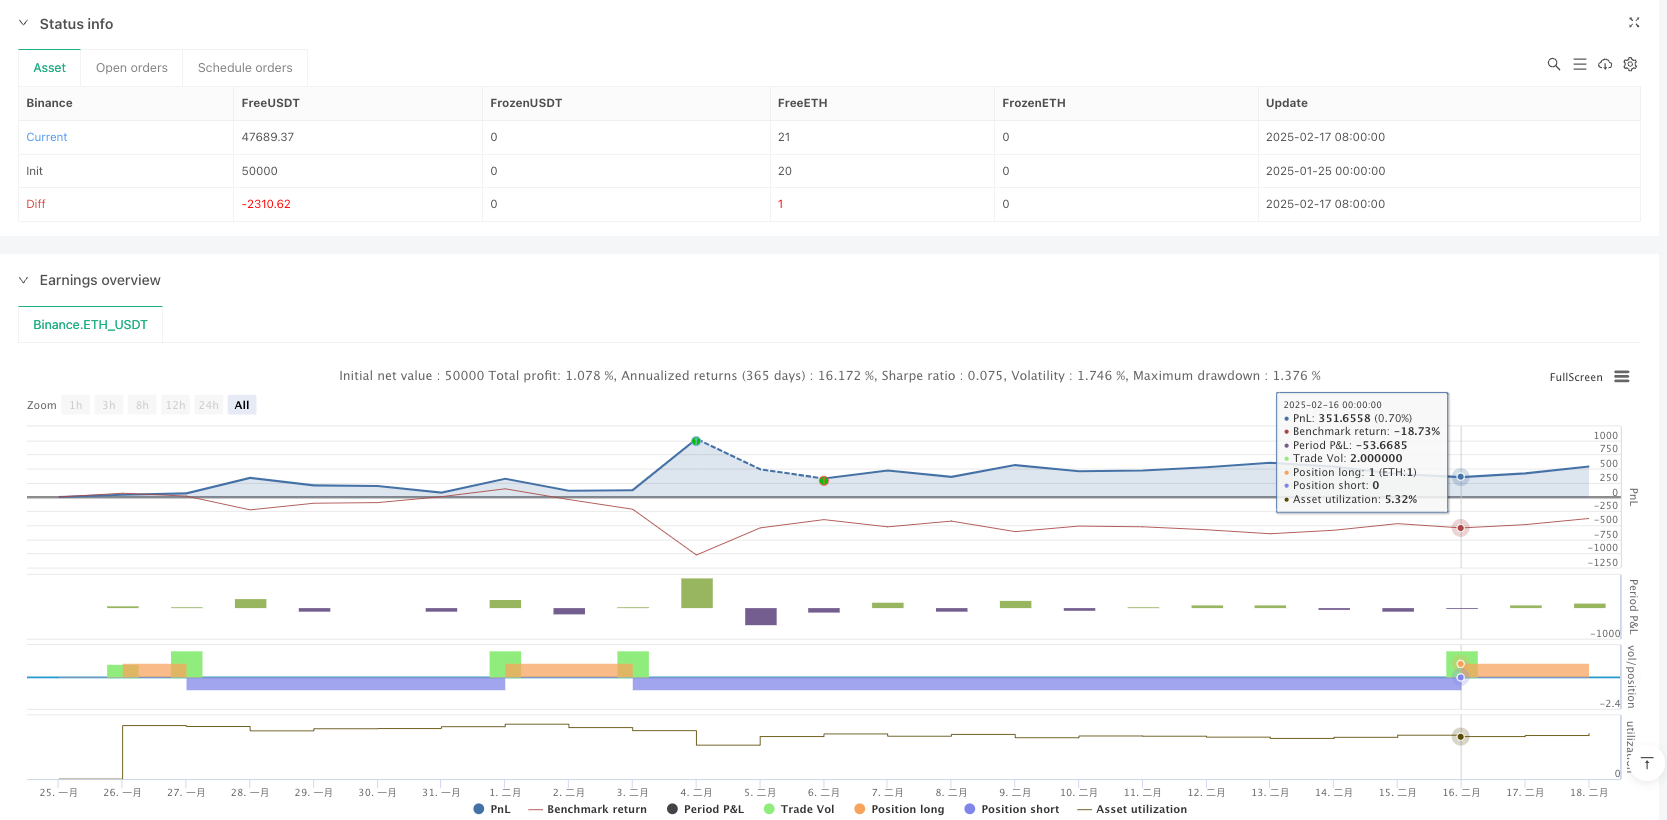
[trans]
概述
这是一个将多个技术指标有机结合的日内量化交易策略,通过整合成交量加权平均价(VWAP)、斐波那契回调水平、相对强弱指标(RSI)和简单移动平均线(SMA),构建了一个多维度的交易信号系统。该策略通过对不同指标的协同配合,在市场波动中寻找高概率的交易机会。
策略原理
策略采用多层过滤机制来确认交易信号:
- 使用RSI指标识别超买超卖区域,当RSI突破30进入超卖区域时产生买入信号,突破70进入超买区域时产生卖出信号
- 通过斐波那契回调水平(0.382和0.618)建立价格运动的参考区间,只在价格处于该区间内时才允许交易
- 将VWAP作为趋势确认指标,价格在VWAP上方时支持做多,下方时支持做空
- 引入SMA作为辅助指标,当价格突破SMA时产生额外的交易信号 最终交易信号需要满足RSI条件或SMA条件,并且符合斐波那契区间和VWAP位置要求。
策略优势
- 多重信号确认机制显著提高了交易的可靠性,降低了虚假信号的影响
- 结合了趋势和震荡两种交易思路,既能捕捉趋势性机会,也能进行区间交易
- 通过VWAP的引入,考虑了成交量因素,使策略更贴近市场实际情况
- 斐波那契回调水平的应用帮助确定关键价格区域,提高了入场时机的准确性
- 策略逻辑清晰,各个指标的作用明确,便于监控和调整
策略风险
- 多重条件可能导致错过部分交易机会,特别是在快速行情中
- RSI和SMA可能在剧烈波动市场中产生滞后信号
- 斐波那契回调区间的计算依赖于历史数据,在市场环境发生显著变化时可能失效
- VWAP的参考意义在不同时间周期上可能存在差异
- 需要合理设置止损以控制风险,避免在剧烈波动中遭受过大损失
策略优化方向
- 引入自适应的参数优化机制,根据市场波动状况动态调整各指标参数
- 增加成交量分析维度,在VWAP基础上添加成交量异常识别
- 考虑加入市场波动率指标,在不同波动环境下调整策略激进程度
- 完善止损止盈机制,可以考虑使用动态止损方案
- 增加交易时间过滤,识别不同时间段的市场特征
总结
这是一个综合性强、逻辑严谨的日内交易策略。通过多个技术指标的协同作用,在控制风险的同时追求稳定收益。策略具有较强的实用性和可扩展性,通过合理的参数优化和风险控制,能够适应不同的市场环境。然而,使用者需要深入理解各个指标的特性,合理设置参数,并始终注意风险控制。 ||
Overview
This is an intraday quantitative trading strategy that organically combines multiple technical indicators, integrating Volume Weighted Average Price (VWAP), Fibonacci retracement levels, Relative Strength Index (RSI), and Simple Moving Average (SMA) to construct a multi-dimensional trading signal system. The strategy seeks high-probability trading opportunities in market fluctuations through the synergistic combination of different indicators.
Strategy Principles
The strategy employs a multi-layer filtering mechanism to confirm trading signals:
- Uses RSI to identify overbought and oversold areas, generating buy signals when RSI crosses above 30 (oversold) and sell signals when crossing above 70 (overbought)
- Establishes price movement reference ranges through Fibonacci retracement levels (0.382 and 0.618), only allowing trades when price is within this range
- Uses VWAP as a trend confirmation indicator, supporting long positions above VWAP and short positions below
- Incorporates SMA as an auxiliary indicator, generating additional trading signals when price crosses the SMA Final trading signals must satisfy either RSI or SMA conditions while complying with Fibonacci range and VWAP position requirements.
Strategy Advantages
- Multiple signal confirmation mechanism significantly improves trading reliability and reduces the impact of false signals
- Combines trend and oscillation trading approaches, capable of capturing both trending opportunities and range-bound trades
- Incorporation of VWAP considers volume factors, making the strategy more aligned with actual market conditions
- Application of Fibonacci retracement levels helps determine key price areas, improving entry timing accuracy
- Clear strategy logic with well-defined indicator roles, facilitating monitoring and adjustment
Strategy Risks
- Multiple conditions may cause missed trading opportunities, especially in fast-moving markets
- RSI and SMA may generate lagging signals in volatile markets
- Fibonacci retracement range calculations rely on historical data and may become invalid when market conditions change significantly
- VWAP's reference value may vary across different time periods
- Proper stop-loss settings are necessary for risk control to avoid excessive losses during violent fluctuations
Strategy Optimization Directions
- Introduce adaptive parameter optimization mechanisms to dynamically adjust indicator parameters based on market volatility conditions
- Enhance volume analysis dimension by adding volume anomaly detection to the VWAP foundation
- Consider adding market volatility indicators to adjust strategy aggressiveness in different volatility environments
- Improve stop-loss and take-profit mechanisms, potentially implementing dynamic stop-loss solutions
- Add trading time filters to identify market characteristics in different time periods
Summary
This is a comprehensive and logically rigorous intraday trading strategy. Through the synergistic effect of multiple technical indicators, it pursues stable returns while controlling risks. The strategy possesses strong practicality and scalability, capable of adapting to different market environments through proper parameter optimization and risk control. However, users need to deeply understand the characteristics of each indicator, set parameters reasonably, and maintain constant attention to risk control.[/trans]
Source (PineScript)
/*backtest
start: 2025-01-25 00:00:00
end: 2025-02-18 08:00:00
period: 1d
basePeriod: 1d
exchanges: [{"eid":"Binance","currency":"ETH_USDT"}]
*/

// Pine Script v5 kodu
//@version=5
strategy("Intraday Strategy with VWAP, Fibonacci, RSI, and SMA", shorttitle="Intraday Strategy", overlay=true)

// Input settings
lengthRSI = input.int(14, title="RSI Length")
lengthFib = input.int(5, title="Fibonacci Lookback Period")
timeframeVWAP = input.timeframe("", title="VWAP Timeframe")
smaLength = input.int(9, title="SMA Length")

rsi = ta.rsi(close, lengthRSI)
sma = ta.sma(close, smaLength)

[fibHigh, fibLow] = request.security(syminfo.tickerid, timeframe.period, [high, low])
upper = fibHigh - (fibHigh - fibLow) * 0.382
lower = fibHigh - (fibHigh - fibLow) * 0.618

vwav = request.security(syminfo.tickerid, timeframeVWAP, ta.vwap(close))
price_above_vwap = close > vwav

// Trading conditions
buySignalRSI = ta.crossover(rsi, 30) and close > lower and close < upper and price_above_vwap
sellSignalRSI = ta.crossunder(rsi, 70) and close < upper and close > lower and not price_above_vwap

buySignalSMA = ta.crossover(close, sma)
sellSignalSMA = ta.crossunder(close, sma)

finalBuySignal = buySignalRSI or buySignalSMA
finalSellSignal = sellSignalRSI or sellSignalSMA

// Execute trades
if finalBuySignal
    strategy.entry("Buy", strategy.long)
if finalSellSignal
    strategy.entry("Sell", strategy.short)

// Plot signals
plotshape(finalBuySignal, title="Buy Signal", location=location.belowbar, color=color.green, style=shape.labelup, text="BUY")
plotshape(finalSellSignal, title="Sell Signal", location=location.abovebar, color=color.red, style=shape.labeldown, text="SELL")

// Plot VWAP, SMA, and levels
plot(vwav, color=color.blue, title="VWAP")
plot(sma, color=color.yellow, title="SMA 9")
lineUpper = plot(upper, color=color.orange, title="Fibonacci Upper")
lineLower = plot(lower, color=color.purple, title="Fibonacci Lower")
Detail
https://www.fmz.com/strategy/482777
Last Modified
2025-02-27 17:50:42