
11 KiB
Name
多指标多维度趋势交叉高级量化策略-Advanced-Multi-Indicator-Multi-Dimensional-Trend-Cross-Quantitative-Strategy
Author
ChaoZhang
Strategy Description
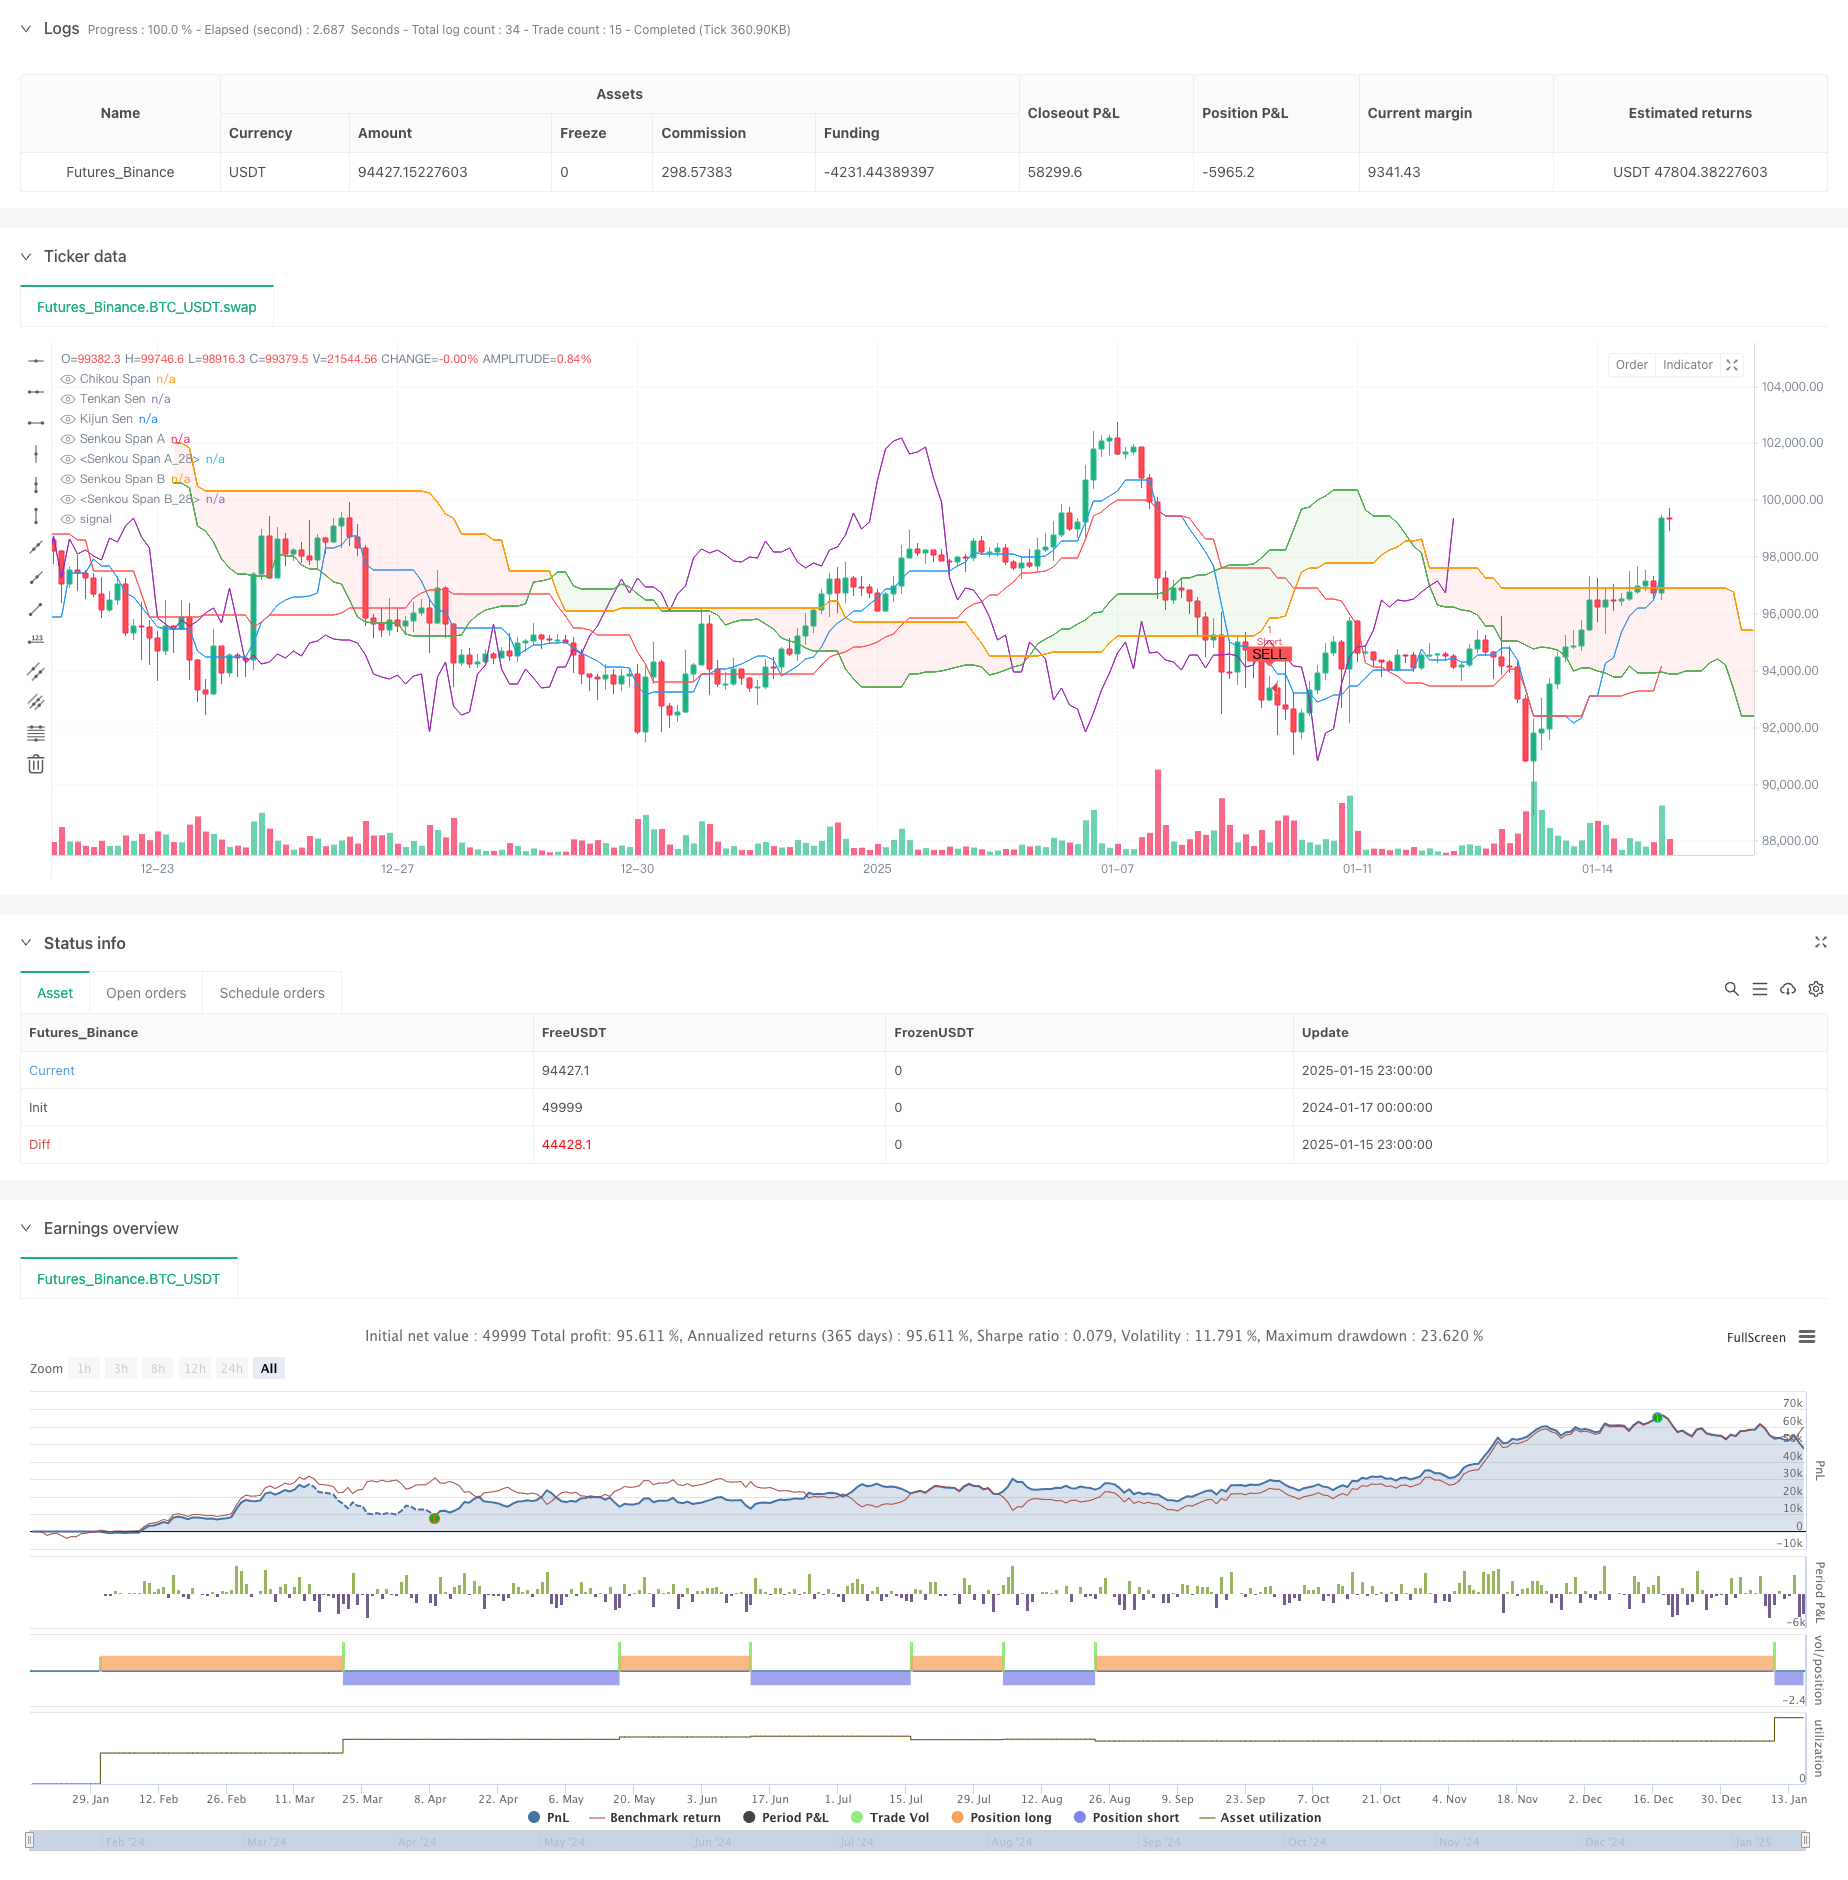
[trans]
概述
该策略是一个结合了多个技术指标的综合交易系统,主要包括一目均衡图(Ichimoku)、相对强弱指标(RSI)、移动平均线趋同背离指标(MACD)、高时间周期(HTF)背离以及指数移动平均线(EMA)交叉等多个维度的分析方法。策略通过多重信号确认来提高交易的准确性,同时利用不同时间周期的市场信息来捕捉更可靠的交易机会。
策略原理
策略的核心原理是通过多层技术指标的综合分析来确认交易信号。首先使用一目均衡图的云图组件来确定整体市场趋势,结合RSI指标判断市场的超买超卖状态,通过MACD指标识别趋势的动能变化,并通过高时间周期的RSI和MACD背离来捕捉潜在的趋势反转信号。此外,策略还引入了EMA50和EMA100的交叉确认,以及EMA200作为主要趋势过滤器,从而构建了一个多层次的交易确认体系。
策略优势
- 多维度信号确认大大降低了假突破的风险,提高了交易的准确性
- 通过高时间周期背离分析增强了对市场转折点的预判能力
- 融合了趋势跟踪和反转交易的特点,适应性较强
- EMA交叉提供了额外的趋势确认,提高了入场时机的准确性
- 完整的技术指标体系使策略能够全方位分析市场状态
策略风险
- 多重指标确认可能导致错过一些快速行情的机会
- 在震荡市场中可能产生较多虚假信号
- 参数优化的复杂度较高,容易出现过度拟合
- 多个指标的计算可能带来一定的滞后性
- 在极端市场条件下,多重确认机制可能失效
策略优化方向
- 引入自适应参数机制,使策略能够根据市场状态动态调整各指标参数
- 增加波动率过滤器,在高波动率环境下调整策略参数
- 开发更智能的止损止盈机制,提高资金管理效率
- 增加市场状态分类模块,针对不同市场状态采用不同的交易逻辑
- 优化高时间周期背离的识别算法,提高信号的及时性
总结
该策略通过多个技术指标的协同配合,构建了一个较为完善的交易系统。策略的优势在于其多维度的信号确认机制,但同时也面临着参数优化和市场适应性的挑战。通过提出的优化方向,策略有望在保持其稳健性的同时,进一步提升其在不同市场环境下的表现。
||
Overview
This strategy is a comprehensive trading system that combines multiple technical indicators, including Ichimoku Cloud, Relative Strength Index (RSI), Moving Average Convergence Divergence (MACD), Higher Time Frame (HTF) divergence, and Exponential Moving Average (EMA) crossovers. The strategy utilizes multiple signal confirmations to improve trading accuracy while leveraging market information from different time frames to capture more reliable trading opportunities.
Strategy Principles
The core principle of the strategy is to confirm trading signals through multi-layer technical analysis. It uses the Ichimoku Cloud components to determine overall market trends, combines RSI to judge market overbought/oversold conditions, utilizes MACD to identify trend momentum changes, and captures potential trend reversal signals through HTF RSI and MACD divergences. Additionally, the strategy incorporates EMA50 and EMA100 crossovers for confirmation, along with EMA200 as a primary trend filter, creating a multi-layered trading confirmation system.
Strategy Advantages
- Multi-dimensional signal confirmation significantly reduces false breakout risks and improves trading accuracy
- HTF divergence analysis enhances the ability to predict market turning points
- Integration of trend-following and reversal trading characteristics provides strong adaptability
- EMA crossovers provide additional trend confirmation, improving entry timing accuracy
- Comprehensive technical indicator system enables all-round market state analysis
Strategy Risks
- Multiple indicator confirmations may cause missed opportunities in rapid market movements
- May generate numerous false signals in ranging markets
- High complexity in parameter optimization increases the risk of overfitting
- Multiple indicators may introduce certain latency in signal generation
- Multiple confirmation mechanisms may fail under extreme market conditions
Strategy Optimization Directions
- Introduce adaptive parameter mechanisms to dynamically adjust indicator parameters based on market conditions
- Add volatility filters to adjust strategy parameters in high-volatility environments
- Develop more intelligent stop-loss and take-profit mechanisms to improve money management efficiency
- Add market state classification modules to apply different trading logic for different market conditions
- Optimize HTF divergence identification algorithms to improve signal timeliness
Summary
This strategy constructs a relatively complete trading system through the coordination of multiple technical indicators. Its strength lies in its multi-dimensional signal confirmation mechanism, while also facing challenges in parameter optimization and market adaptability. Through the proposed optimization directions, the strategy has the potential to further enhance its performance across different market environments while maintaining its robustness.[/trans]
Source (PineScript)
/*backtest
start: 2024-01-17 00:00:00
end: 2025-01-16 00:00:00
period: 3h
basePeriod: 3h
exchanges: [{"eid":"Futures_Binance","currency":"BTC_USDT","balance":49999}]
*/
//@version=6
strategy("Ichimoku + RSI + MACD + HTF Divergence + EMA Cross Strategy", overlay=true)
// تنظیمات تایمفریم بالاتر
htf_timeframe = input.timeframe("D", title="تایمفریم بالاتر")
// تنظیمات پارامترهای ایچیموکو
tenkan_period = input(9, title="Tenkan Sen Period")
kijun_period = input(26, title="Kijun Sen Period")
senkou_span_b_period = input(52, title="Senkou Span B Period")
displacement = input(26, title="Displacement")
// محاسبه خطوط ایچیموکو
tenkan_sen = (ta.highest(high, tenkan_period) + ta.lowest(low, tenkan_period)) / 2
kijun_sen = (ta.highest(high, kijun_period) + ta.lowest(low, kijun_period)) / 2
senkou_span_a = (tenkan_sen + kijun_sen) / 2
senkou_span_b = (ta.highest(high, senkou_span_b_period) + ta.lowest(low, senkou_span_b_period)) / 2
chikou_span = close // قیمت بسته شدن فعلی
// رسم خطوط ایچیموکو
plot(tenkan_sen, color=color.blue, title="Tenkan Sen")
plot(kijun_sen, color=color.red, title="Kijun Sen")
plot(senkou_span_a, offset=displacement, color=color.green, title="Senkou Span A")
plot(senkou_span_b, offset=displacement, color=color.orange, title="Senkou Span B")
plot(chikou_span, offset=-displacement, color=color.purple, title="Chikou Span")
// رنگآمیزی ابر ایچیموکو
fill(plot(senkou_span_a, offset=displacement, color=color.green, title="Senkou Span A"), plot(senkou_span_b, offset=displacement, color=color.orange, title="Senkou Span B"), color=senkou_span_a > senkou_span_b ? color.new(color.green, 90) : color.new(color.red, 90), title="Cloud")
// تنظیمات RSI
rsi_length = input(14, title="RSI Length")
rsi_overbought = input(70, title="RSI Overbought Level")
rsi_oversold = input(30, title="RSI Oversold Level")
// محاسبه RSI
rsi_value = ta.rsi(close, rsi_length)
// تنظیمات MACD
fast_length = input(12, title="MACD Fast Length")
slow_length = input(26, title="MACD Slow Length")
signal_smoothing = input(9, title="MACD Signal Smoothing")
// محاسبه MACD
[macd_line, signal_line, hist_line] = ta.macd(close, fast_length, slow_length, signal_smoothing)
// شناسایی واگراییها در تایمفریم بالاتر
f_find_divergence(src, lower, upper) =>
var int divergence = na // تعریف نوع متغیر بهصورت صریح
if (src >= upper and src[1] < upper)
divergence := 1 // واگرایی نزولی
else if (src <= lower and src[1] > lower)
divergence := -1 // واگرایی صعودی
divergence
// محاسبه RSI و MACD در تایمفریم بالاتر
htf_rsi_value = request.security(syminfo.tickerid, htf_timeframe, rsi_value)
htf_macd_line = request.security(syminfo.tickerid, htf_timeframe, macd_line)
// شناسایی واگراییها در تایمفریم بالاتر
htf_rsi_divergence = f_find_divergence(htf_rsi_value, rsi_oversold, rsi_overbought)
htf_macd_divergence = f_find_divergence(htf_macd_line, 0, 0)
// فیلتر روند با EMA 200
ema_200 = ta.ema(close, 200)
// اضافه کردن EMA 50 و 100
ema_50 = ta.ema(close, 50)
ema_100 = ta.ema(close, 100)
// کراسهای EMA
ema_cross_up = ta.crossover(ema_50, ema_100) // کراس صعودی EMA 50 و 100
ema_cross_down = ta.crossunder(ema_50, ema_100) // کراس نزولی EMA 50 و 100
// شرایط ورود و خروج
long_condition = (close > senkou_span_a and close > senkou_span_b) and // قیمت بالای ابر
(rsi_value > 50) and // RSI بالای 50
(macd_line > signal_line) and // MACD خط سیگنال را قطع کرده
(htf_rsi_divergence == -1 or htf_macd_divergence == -1) and // واگرایی صعودی در تایمفریم بالاتر
(close > ema_200) and // قیمت بالای EMA 200
(ema_cross_up) // کراس صعودی EMA 50 و 100
short_condition = (close < senkou_span_a and close < senkou_span_b) and // قیمت زیر ابر
(rsi_value < 50) and // RSI زیر 50
(macd_line < signal_line) and // MACD خط سیگنال را قطع کرده
(htf_rsi_divergence == 1 or htf_macd_divergence == 1) and // واگرایی نزولی در تایمفریم بالاتر
(close < ema_200) and // قیمت زیر EMA 200
(ema_cross_down) // کراس نزولی EMA 50 و 100
// نمایش نقاط ورود در چارت
plotshape(series=long_condition, title="Buy Signal", location=location.belowbar, color=color.green, style=shape.labelup, text="BUY", size=size.small)
plotshape(series=short_condition, title="Sell Signal", location=location.abovebar, color=color.red, style=shape.labeldown, text="SELL", size=size.small)
// اجرای استراتژی
if (long_condition)
strategy.entry("Long", strategy.long)
if (short_condition)
strategy.entry("Short", strategy.short)
Detail
https://www.fmz.com/strategy/478724
Last Modified
2025-01-17 16:00:03