
16 KiB
Name
多指标协同短线趋势跟踪策略-Multi-Indicator-Synergistic-Short-Term-Trend-Following-Strategy
Author
ianzeng123
Strategy Description
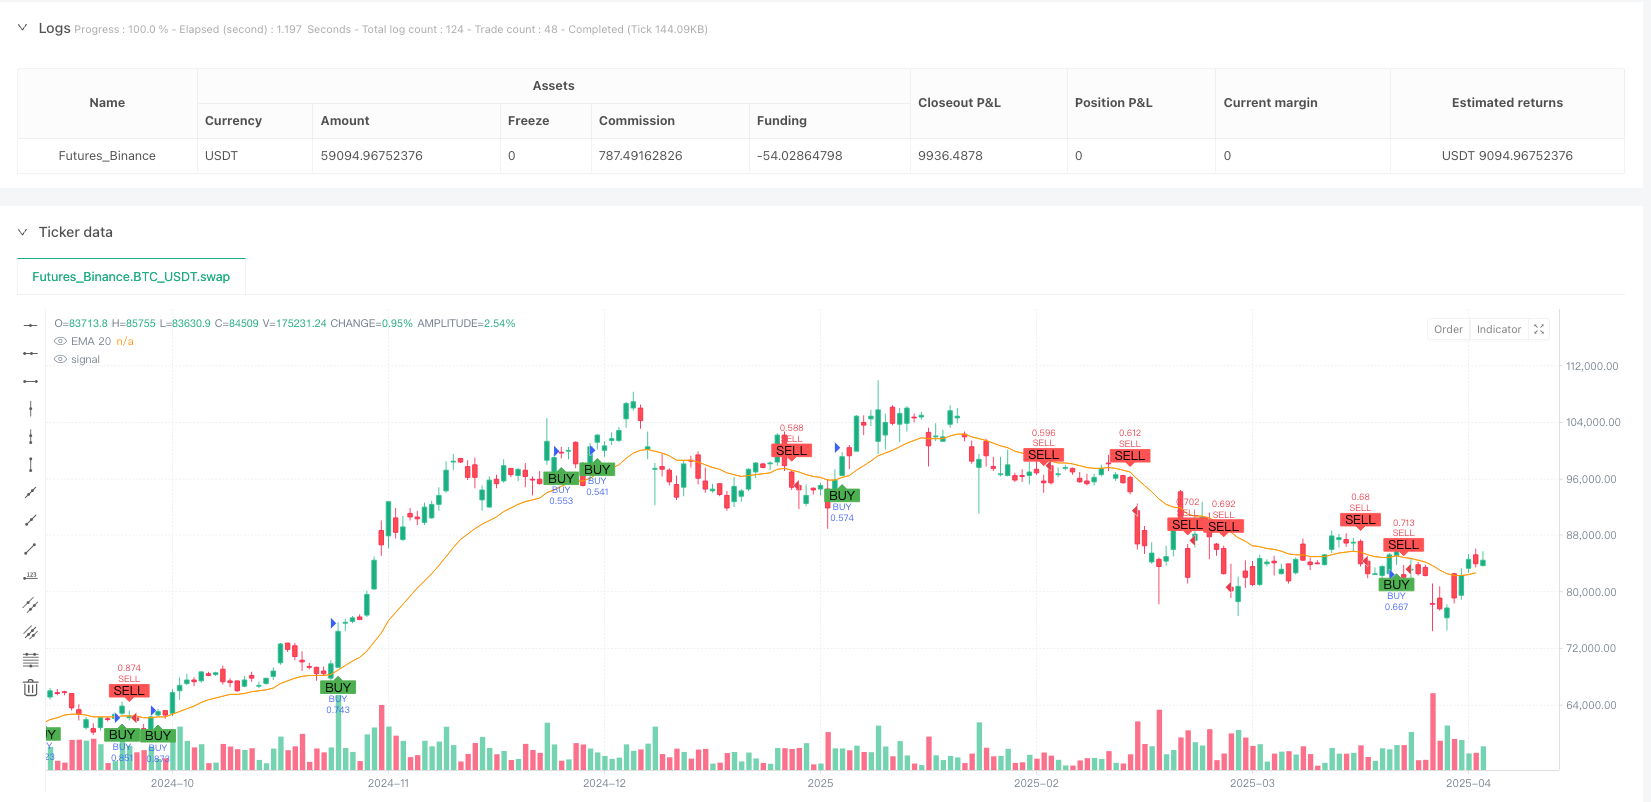
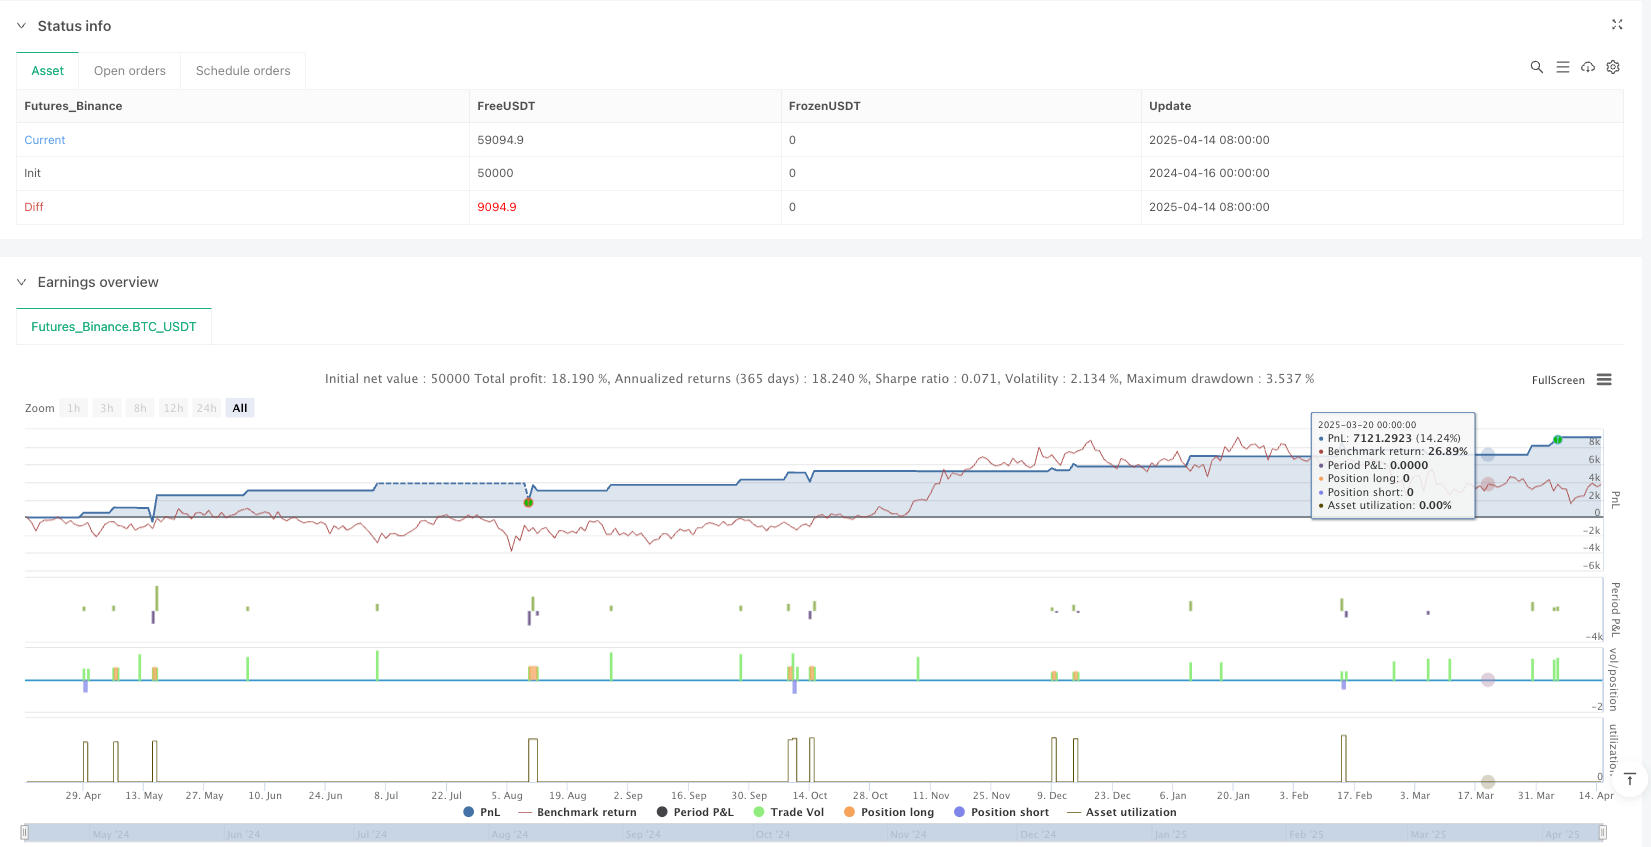
[trans]
概述
多指标协同短线趋势跟踪策略是一种结合EMA、MACD和RSI三大技术指标,并搭配ATR动态追踪止盈机制的量化交易系统。该策略通过多指标协同确认信号,在短线交易中寻找具有动量延续性的趋势机会,同时利用动态追踪止盈管理风险和锁定利润。策略主要特点是平衡了信号频率和准确性,适合在波动明显但有一定趋势方向的市场环境中进行短线交易。
策略原理
这个交易策略的核心原理是通过多重技术指标协同确认来增强信号可靠性。具体来看:
-
趋势确认层: 使用EMA(20)作为主要趋势判断工具。价格位于EMA之上视为上升趋势,适合做多;价格位于EMA之下视为下降趋势,适合做空。
-
动量确认层: 使用快速MACD(6,13,6)捕捉短期动量变化。MACD线上穿信号线提供买入动力确认;MACD线下穿信号线提供卖出动力确认。
-
过滤层: 使用RSI(9)作为市场状态过滤器。买入信号要求RSI处于40-75区间,避开超卖和超买区域;卖出信号要求RSI低于60,确保在动量减弱时退出。
-
风险管理层: 结合固定百分比止盈(1%)和基于ATR的追踪止损。ATR计算周期为14,ATR乘数为0.8,这提供了根据市场波动性自适应的退出机制。
交易逻辑执行流程如下:
- 做多条件: 价格>EMA(20) AND MACD线上穿信号线 AND RSI在40-75之间
- 做空条件: 价格<EMA(20) AND MACD线下穿信号线 AND RSI<60
- 止盈/止损设置: 固定止盈为入场价格的±1%,同时启用基于0.8倍ATR的追踪止损
策略优势
深入分析该策略代码,可以总结出以下优势:
-
多维确认机制: 通过EMA、MACD和RSI三个不同维度的指标协同确认,有效降低了假信号风险。EMA提供趋势方向,MACD捕捉动量变化,RSI过滤极端市场状态。
-
自适应风险管理: 结合固定止盈和基于ATR的追踪止损,可以在波动性增加时自动扩大保护范围,在波动性减小时收紧保护范围,适应不同市场环境。
-
参数优化平衡: 代码中选择了相对短周期的参数(MACD为6-13-6,RSI为9),有助于更快捕捉市场变化,提高短线交易的时效性。
-
双向交易策略: 同时包含做多和做空逻辑,可以在不同市场环境下寻找交易机会,增加了策略的适应性和全面性。
-
资金管理集成: 默认使用账户总价值的100%进行交易,简化了资金管理流程,便于回测和实盘操作。
策略风险
尽管该策略设计相对全面,但仍存在一些潜在风险:
-
假突破风险: 短周期MACD容易受市场噪音影响产生假突破信号,特别是在横盘整理市场中。解决方法可以是增加额外的成交量确认或者优化MACD参数。
-
RSI区间过宽: 当前RSI过滤区间(40-75做多,<60做空)相对宽松,可能在极端行情中不足以过滤掉不良信号。可考虑根据不同市场特性动态调整RSI区间。
-
固定止盈百分比风险: 1%的固定止盈在高波动市场可能过小,导致频繁提前出场;在低波动市场可能又显得过大,难以触发。可以考虑将止盈百分比也与ATR挂钩,实现自适应止盈。
-
参数敏感性: 当前策略效果严重依赖于EMA、MACD、RSI等指标的参数设置,不同市场环境可能需要不同参数,存在过度拟合风险。建议进行不同参数组合的敏感性测试。
-
缺乏市场环境识别: 策略没有内置市场环境(震荡/趋势)的识别机制,可能在不适合的市场环境中频繁交易,增加成本并降低胜率。
策略优化方向
针对该策略的分析,可以提出以下优化方向:
-
增加市场环境过滤器: 可以添加ADX或波动率指标来识别市场环境,在趋势明显时采用更激进的参数,在震荡市中采用更保守的参数或暂停交易。这样优化可以提高策略的环境适应性。
-
动态参数调整机制: 引入自适应参数调整算法,根据最近N个周期的市场表现自动调整EMA长度、MACD参数和RSI阈值,使策略能够更好地适应市场变化。
-
整合成交量分析: 在信号确认中加入成交量条件,例如要求MACD金叉时成交量放大,可以有效过滤掉低质量信号,提高策略可靠性。
-
优化止盈/止损逻辑: 将固定止盈改为基于ATR的动态止盈,止盈目标可设为X倍ATR,使止盈目标与市场波动性匹配。同时可以引入时间止损,避免长时间套牢。
-
增加回撤控制机制: 添加最大回撤控制逻辑,当策略回撤达到预设阈值时,自动减少仓位或暂停交易,等待市场条件改善后再恢复正常交易。
-
引入机器学习优化: 可以考虑使用机器学习算法分析历史数据,预测各指标信号的可靠性,为不同信号组合分配权重,实现信号质量的智能评估。
总结
多指标协同短线趋势跟踪策略是一个结构清晰、逻辑合理的量化交易系统,通过EMA、MACD和RSI三大指标的协同作用,结合ATR动态止损来捕捉短期趋势机会。它平衡了信号频率与可靠性,具有一定的风险管理能力。
该策略的核心价值在于多维度信号确认和自适应风险管理的结合,适合在有明显趋势但波动较大的市场环境中应用。然而,策略仍有优化空间,特别是在市场环境识别、参数动态调整和止盈止损机制方面。
通过加入市场环境过滤、动态参数调整、成交量确认和优化资金管理等方向的改进,该策略有望进一步提升其稳定性和盈利能力,成为一个更加全面且稳健的量化交易系统。无论是短线交易者还是系统化投资者,都可以从这一策略设计中获得启发,根据自身需求进行定制和优化。 ||
Overview
The Multi-Indicator Synergistic Short-Term Trend Following Strategy is a quantitative trading system that combines EMA, MACD, and RSI technical indicators with an ATR-based dynamic trailing take profit mechanism. This strategy confirms signals through multiple indicator collaboration, seeking momentum continuation opportunities in short-term trading while managing risk and securing profits through dynamic trailing take profit. The strategy's main feature is balancing signal frequency and accuracy, making it suitable for short-term trading in markets with noticeable volatility but with a definite trend direction.
Strategy Principles
The core principle of this trading strategy is to enhance signal reliability through multiple technical indicator confirmation. Specifically:
-
Trend Confirmation Layer: Uses EMA(20) as the primary trend determination tool. Price above EMA indicates an uptrend suitable for long positions; price below EMA indicates a downtrend suitable for short positions.
-
Momentum Confirmation Layer: Uses fast MACD(6,13,6) to capture short-term momentum changes. MACD line crossing above the signal line confirms buying momentum; MACD line crossing below the signal line confirms selling momentum.
-
Filter Layer: Uses RSI(9) as a market state filter. Buy signals require RSI to be in the 40-75 range, avoiding oversold and overbought areas; sell signals require RSI below 60, ensuring exit when momentum weakens.
-
Risk Management Layer: Combines fixed percentage take profit (1%) with ATR-based trailing stop loss. The ATR calculation period is 14, and the ATR multiplier is 0.8, providing an adaptive exit mechanism based on market volatility.
The trading logic execution flow is as follows:
- Long condition: Price > EMA(20) AND MACD line crosses above signal line AND RSI between 40-75
- Short condition: Price < EMA(20) AND MACD line crosses below signal line AND RSI < 60
- Take profit/stop loss settings: Fixed take profit at ±1% of entry price, while enabling 0.8x ATR trailing stop loss
Strategy Advantages
Through in-depth analysis of the strategy code, the following advantages can be summarized:
-
Multi-dimensional Confirmation Mechanism: Effectively reduces false signal risk through confirmation from three different dimensional indicators - EMA, MACD, and RSI. EMA provides trend direction, MACD captures momentum changes, and RSI filters extreme market conditions.
-
Adaptive Risk Management: Combining fixed take profit with ATR-based trailing stop loss automatically expands protection range when volatility increases and tightens protection range when volatility decreases, adapting to different market environments.
-
Parameter Optimization Balance: The code selects relatively short-cycle parameters (MACD 6-13-6, RSI 9), helping to capture market changes faster and improving the timeliness of short-term trading.
-
Bi-directional Trading Strategy: Includes both long and short logic, allowing for trading opportunities in different market environments, increasing the strategy's adaptability and comprehensiveness.
-
Integrated Capital Management: Uses 100% of account equity for trading by default, simplifying the capital management process and facilitating backtesting and live trading.
Strategy Risks
Despite the relatively comprehensive design of this strategy, there are still some potential risks:
-
False Breakout Risk: Short-period MACD is susceptible to market noise producing false breakout signals, especially in sideways consolidating markets. Solutions could include adding additional volume confirmation or optimizing MACD parameters.
-
RSI Range Too Wide: The current RSI filter range (40-75 for long, <60 for short) is relatively loose and may not adequately filter out poor signals in extreme market conditions. Consider dynamically adjusting the RSI range based on different market characteristics.
-
Fixed Take Profit Percentage Risk: A 1% fixed take profit may be too small in high-volatility markets, causing frequent premature exits; in low-volatility markets, it may be too large and difficult to trigger. Consider linking the take profit percentage to ATR for adaptive take profit.
-
Parameter Sensitivity: The current strategy effectiveness heavily depends on the parameter settings of EMA, MACD, RSI, etc. Different market environments may require different parameters, posing an overfitting risk. It is recommended to perform sensitivity tests with different parameter combinations.
-
Lack of Market Environment Recognition: The strategy does not have a built-in mechanism for identifying market environments (oscillating/trending), which may lead to frequent trading in unsuitable market environments, increasing costs and reducing win rates.
Strategy Optimization Directions
Based on the analysis of this strategy, the following optimization directions can be proposed:
-
Add Market Environment Filter: Add ADX or volatility indicators to identify market environments, using more aggressive parameters when trends are obvious and more conservative parameters or pausing trading in oscillating markets. This optimization can improve the strategy's environmental adaptability.
-
Dynamic Parameter Adjustment Mechanism: Introduce adaptive parameter adjustment algorithms to automatically adjust EMA length, MACD parameters, and RSI thresholds based on recent N-period market performance, allowing the strategy to better adapt to market changes.
-
Integrate Volume Analysis: Add volume conditions to signal confirmation, such as requiring increased volume during MACD golden crosses, which can effectively filter out low-quality signals and improve strategy reliability.
-
Optimize Take Profit/Stop Loss Logic: Change fixed take profit to ATR-based dynamic take profit, setting the take profit target at X times ATR to match market volatility. Time-based stop loss can also be introduced to avoid long-term trapping.
-
Add Drawdown Control Mechanism: Add maximum drawdown control logic that automatically reduces positions or pauses trading when strategy drawdown reaches preset thresholds, waiting for market conditions to improve before resuming normal trading.
-
Introduce Machine Learning Optimization: Consider using machine learning algorithms to analyze historical data, predict the reliability of various indicator signals, assign weights to different signal combinations, and achieve intelligent assessment of signal quality.
Summary
The Multi-Indicator Synergistic Short-Term Trend Following Strategy is a clearly structured and logically sound quantitative trading system that captures short-term trend opportunities through the synergistic action of EMA, MACD, and RSI indicators, combined with ATR dynamic stop loss. It balances signal frequency and reliability, with a certain risk management capability.
The core value of this strategy lies in the combination of multi-dimensional signal confirmation and adaptive risk management, suitable for application in market environments with obvious trends but significant volatility. However, there is still room for optimization, especially in market environment recognition, dynamic parameter adjustment, and take profit/stop loss mechanisms.
By incorporating improvements in market environment filtering, dynamic parameter adjustment, volume confirmation, and optimized capital management, this strategy has the potential to further enhance its stability and profitability, becoming a more comprehensive and robust quantitative trading system. Both short-term traders and systematic investors can gain inspiration from this strategy design, customizing and optimizing it according to their own needs.[/trans]
Source (PineScript)
/*backtest
start: 2024-04-16 00:00:00
end: 2025-04-15 00:00:00
period: 1d
basePeriod: 1d
exchanges: [{"eid":"Futures_Binance","currency":"BTC_USDT"}]
*/

//@version=5
strategy("Scalping Pro Balance (EMA + MACD + RSI + Trailing TP)", overlay=true, default_qty_type=strategy.percent_of_equity, default_qty_value=100)

// === THAM SỐ ===
emaLen = input.int(20, "EMA Trend", minval=1)  // Giảm độ dài EMA để tín hiệu nhanh hơn
takeProfitPerc = input.float(1.0, "Take Profit (%)", step=0.1)
atrMult = input.float(0.8, "Trailing ATR Multiplier", step=0.1)
atrLen = input.int(14, "ATR Length")
rsiLen = input.int(9, "RSI Length")  // Giảm độ dài RSI để tín hiệu nhanh hơn

// === CHỈ BÁO ===
ema = ta.ema(close, emaLen)
[macdLine, signalLine, _] = ta.macd(close, 6, 13, 6)  // Giảm độ dài MACD để tín hiệu nhanh hơn
rsi = ta.rsi(close, rsiLen)
atr = ta.atr(atrLen)

// === TÍN HIỆU ===
macdBuy = ta.crossover(macdLine, signalLine)
macdSell = ta.crossunder(macdLine, signalLine)
rsiOk = rsi > 40 and rsi < 75  // Mở rộng vùng RSI để tăng tần suất

longCond = close > ema and macdBuy and rsiOk
shortCond = close < ema and macdSell and rsi < 60  // Điều chỉnh vùng RSI cho lệnh sell

// === VÀO LỆNH ===
if (longCond)
    strategy.entry("BUY", strategy.long)
    strategy.exit("TP/TSL BUY", from_entry="BUY", limit=close * (1 + takeProfitPerc / 100), trail_points=atr * atrMult, trail_offset=atr * atrMult)

if (shortCond)
    strategy.entry("SELL", strategy.short)
    strategy.exit("TP/TSL SELL", from_entry="SELL", limit=close * (1 - takeProfitPerc / 100), trail_points=atr * atrMult, trail_offset=atr * atrMult)

// === HIỂN THỊ ===
plot(ema, title="EMA 20", color=color.orange)
plotshape(longCond, title="BUY", location=location.belowbar, color=color.green, style=shape.labelup, text="BUY")
plotshape(shortCond, title="SELL", location=location.abovebar, color=color.red, style=shape.labeldown, text="SELL")

// === CẢNH BÁO ===
alertcondition(longCond, title="BUY Signal", message="BUY signal: EMA trend up, MACD crossover, RSI OK")
alertcondition(shortCond, title="SELL Signal", message="SELL signal: EMA trend down, MACD crossunder, RSI low")
Detail
https://www.fmz.com/strategy/490804
Last Modified
2025-04-16 15:56:42