
19 KiB
Name
多指标动态趋势捕捉与均值回归策略-Multi-Indicator-Dynamic-Trend-Capture-and-Mean-Reversion-Strategy
Author
ianzeng123
Strategy Description
[trans]
概述
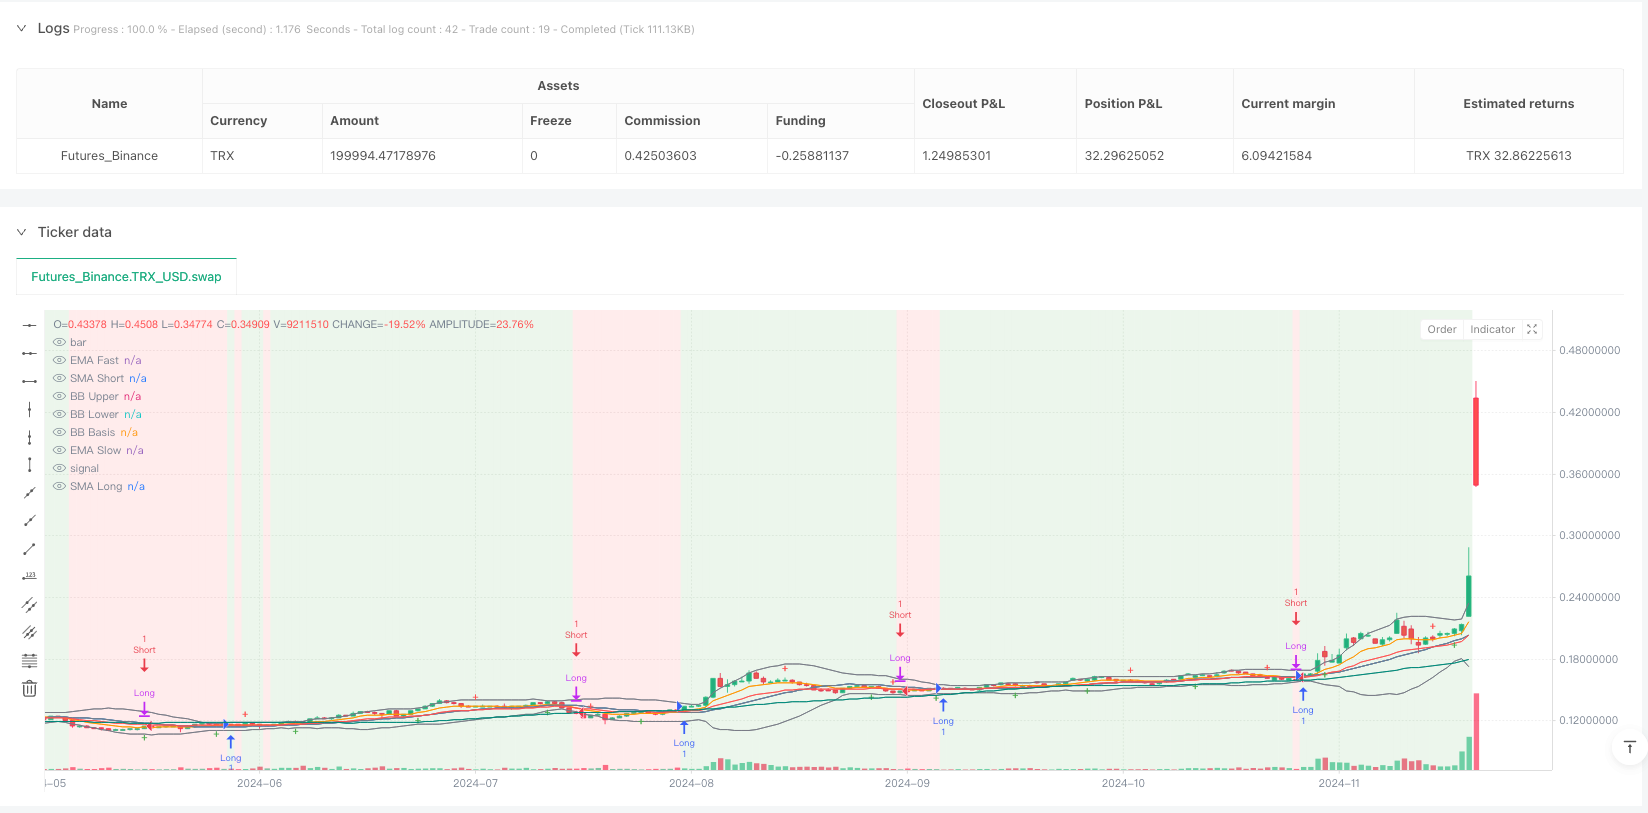
多指标动态趋势捕捉与均值回归策略是一种综合性交易系统,融合了多种技术指标进行市场分析和自动化交易决策。该策略整合了趋势追踪与均值回归的优势,通过指数移动平均线(EMA)、简单移动平均线(SMA)识别市场趋势,相对强弱指标(RSI)判断动量,布林带(BB)监测波动率,以及支撑阻力位和ZigZag识别市场结构,形成了一个多维度的交易决策框架。其核心逻辑围绕着趋势确认、价格动量、超买超卖区域以及价格相对于均值的位置,构建了一套完整的多因子交易系统。
策略原理
该策略的核心原理基于多指标协同确认的方法学,主要包括以下几个关键组成部分:
-
趋势识别系统:使用快速EMA(默认9周期)与慢速EMA(默认21周期)的交叉判断短期趋势方向,同时结合短期SMA(默认20周期)和长期SMA(默认50周期)确认整体市场走势,形成多层次的趋势过滤机制。
-
动量监测:采用RSI指标(默认14周期)判断市场超买超卖状态,在多头条件下要求RSI低于60,避免在过高位置入场;在空头条件下要求RSI高于40,避免在过低位置做空。
-
波动率分析:使用布林带(默认20周期,2倍标准差)测量市场波动性并识别潜在的突破,价格相对于布林带中轨(均值)的位置是入场信号的关键组成部分。
-
市场结构识别:结合枢轴点(Pivot)高点/低点来标记潜在的支撑与阻力区域,以及ZigZag指标简化价格结构,帮助识别重要的摆动高点与低点。
多头入场条件要求同时满足:快速EMA大于慢速EMA、收盘价高于短期SMA、RSI低于60、收盘价高于布林带中轨。空头入场条件则相反:快速EMA小于慢速EMA、收盘价低于短期SMA、RSI高于40、收盘价低于布林带中轨。策略采用对立条件作为出场信号,即当空头条件触发时平仓多头,当多头条件触发时平仓空头。
策略优势
通过深入分析该策略的代码实现,可以总结出以下显著优势:
-
多重确认机制:通过整合多个技术指标,策略确保交易信号得到多维度的确认,有效减少虚假信号,提高交易质量。
-
适应性强:该策略利用不同周期的移动平均线和多种类型的指标,能够适应不同市场环境,无论是趋势市场还是震荡市场都有相应的分析维度。
-
风险管理内置:通过RSI超买超卖过滤和布林带均值参考,策略内置了风险控制机制,避免在不利位置入场。
-
视觉辅助决策:策略提供了丰富的视觉元素,包括趋势背景颜色、支撑阻力标记和ZigZag高低点,使交易者能够直观地理解市场结构。
-
参数可调整性:所有关键指标的参数均可通过输入进行调整,允许交易者根据不同市场条件和交易品种进行优化。
-
完整的进出场逻辑:策略同时提供明确的入场和出场条件,形成了一个封闭的交易循环,避免了仅有入场而缺乏出场逻辑的常见问题。
策略风险
尽管该策略设计全面,但仍存在以下潜在风险和局限性:
-
参数敏感性:策略依赖于多个技术指标的参数设置,不同的参数组合可能产生截然不同的结果。过度优化可能导致过拟合,在未来市场环境中表现不佳。建议进行稳健的回测和前向测试,避免使用过于特定的参数。
-
市场环境依赖:在剧烈波动或快速趋势转变的市场环境下,基于移动平均线的趋势确认可能滞后,导致入场时机延迟或错过关键转折点。建议在不同市场环境下测试策略性能。
-
信号冲突:多指标系统可能在某些市场情况下产生矛盾的信号,特别是在市场转折期。解决方案是引入更高级别的时间框架确认或添加过滤条件。
-
缺乏止损机制:当前策略使用反向信号作为出场条件,但没有明确的止损设置,在极端市场条件下可能导致较大损失。建议添加基于固定百分比或ATR的止损机制。
-
计算复杂度:多指标策略的计算和监控相对复杂,可能增加策略执行的难度和潜在错误。建议使用自动化系统执行策略,减少人为错误。
策略优化方向
基于代码分析,该策略可以从以下几个方向进行优化:
-
自适应参数:将固定的指标参数改为自适应参数,例如基于市场波动率(ATR)动态调整EMA和布林带参数,以更好地适应不同市场环境。这样可以在高波动环境下使用较长周期,在低波动环境下使用较短周期。
-
多时间框架分析:引入更高时间框架的趋势确认,仅在更高时间框架趋势方向一致的情况下执行交易。例如,在日线趋势向上时才执行4小时图上的多头信号。
-
止损优化:添加基于ATR或关键支撑阻力位的动态止损机制,提高风险管理能力。可以考虑使用前一个ZigZag低点作为多头止损,前一个ZigZag高点作为空头止损。
-
交易量过滤:结合交易量指标,如OBV或交易量加权移动平均线,确保价格移动得到交易量的确认,避免在低交易量环境下产生的虚假突破。
-
机器学习优化:使用机器学习算法自动寻找最优参数组合,或者基于历史数据预测各指标的有效性,动态调整不同指标在决策中的权重。
-
市场状态分类:增加市场状态识别模块,区分趋势市和震荡市,在不同市场状态下应用不同的交易逻辑。例如,在识别到震荡市场时,可以增加更严格的入场过滤或调整为纯均值回归策略。
总结
多指标动态趋势捕捉与均值回归策略是一种结合了技术分析多个维度的综合交易系统,通过整合EMA、SMA、RSI、布林带以及市场结构分析工具,构建了一个多层次的交易决策框架。该策略在保持系统性和纪律性的同时,提供了足够的灵活性来适应不同的市场环境。
该策略的主要优势在于其多维度信号确认机制和完整的交易逻辑,但也面临参数敏感性和市场环境依赖等挑战。通过引入自适应参数、多时间框架分析、增强风险管理和市场状态分类等优化方向,该策略有潜力进一步提升其稳定性和适应性。
对于交易者而言,这一策略提供了一个良好的起点,但建议根据个人风险偏好和交易目标进行必要的调整和优化。最重要的是,任何策略都应在实际部署前进行充分的回测和小资金验证,以确保其在真实市场环境中的有效性。 ||
Overview
The Multi-Indicator Dynamic Trend Capture and Mean Reversion Strategy is a comprehensive trading system that integrates multiple technical indicators for market analysis and automated trading decisions. This strategy combines the advantages of trend following and mean reversion by using Exponential Moving Averages (EMA), Simple Moving Averages (SMA) to identify market trends, Relative Strength Index (RSI) to assess momentum, Bollinger Bands (BB) to monitor volatility, and support/resistance levels and ZigZag to identify market structure, forming a multi-dimensional trading decision framework. Its core logic revolves around trend confirmation, price momentum, overbought/oversold regions, and price position relative to the mean, creating a complete multi-factor trading system.
Strategy Principles
The core principle of this strategy is based on a methodology of multiple indicator confirmation, mainly including the following key components:
-
Trend Identification System: Uses the crossover of Fast EMA (default 9 periods) and Slow EMA (default 21 periods) to determine short-term trend direction, while combining Short SMA (default 20 periods) and Long SMA (default 50 periods) to confirm overall market trends, forming a multi-layered trend filtering mechanism.
-
Momentum Monitoring: Employs the RSI indicator (default 14 periods) to judge market overbought/oversold conditions, requiring RSI below 60 for long positions to avoid entering at excessively high levels, and RSI above 40 for short positions to avoid shorting at excessively low levels.
-
Volatility Analysis: Uses Bollinger Bands (default 20 periods, 2 standard deviations) to measure market volatility and identify potential breakouts. The price position relative to the Bollinger middle band (mean) is a key component of entry signals.
-
Market Structure Recognition: Combines Pivot highs/lows to mark potential support and resistance areas, as well as the ZigZag indicator to simplify price structure, helping to identify important swing highs and lows.
Long entry conditions require simultaneous satisfaction of: Fast EMA greater than Slow EMA, closing price above Short SMA, RSI below 60, and closing price above the Bollinger middle band. Short entry conditions are the opposite: Fast EMA less than Slow EMA, closing price below Short SMA, RSI above 40, and closing price below the Bollinger middle band. The strategy uses opposing conditions as exit signals, i.e., exiting long positions when short conditions trigger, and exiting short positions when long conditions trigger.
Strategy Advantages
Through in-depth analysis of the strategy's code implementation, the following significant advantages can be summarized:
-
Multiple Confirmation Mechanism: By integrating multiple technical indicators, the strategy ensures that trading signals are confirmed from multiple dimensions, effectively reducing false signals and improving trading quality.
-
Strong Adaptability: The strategy utilizes moving averages of different periods and various types of indicators, allowing it to adapt to different market environments, whether trending or oscillating markets.
-
Built-in Risk Management: Through RSI overbought/oversold filtering and Bollinger Band mean reference, the strategy has built-in risk control mechanisms to avoid entering at unfavorable positions.
-
Visual Decision Support: The strategy provides rich visual elements, including trend background colors, support/resistance markers, and ZigZag highs/lows, allowing traders to intuitively understand market structure.
-
Parameter Adjustability: All key indicator parameters can be adjusted through inputs, allowing traders to optimize according to different market conditions and trading instruments.
-
Complete Entry and Exit Logic: The strategy provides clear entry and exit conditions simultaneously, forming a closed trading loop and avoiding the common problem of having only entry logic without exit logic.
Strategy Risks
Despite the comprehensive design of this strategy, there are still the following potential risks and limitations:
-
Parameter Sensitivity: The strategy relies on parameter settings of multiple technical indicators, and different parameter combinations may produce vastly different results. Excessive optimization may lead to overfitting, resulting in poor performance in future market environments. It is recommended to conduct robust backtesting and forward testing, avoiding the use of overly specific parameters.
-
Market Environment Dependency: In markets with violent fluctuations or rapid trend changes, trend confirmation based on moving averages may lag, leading to delayed entry timing or missing key turning points. It is recommended to test strategy performance under different market environments.
-
Signal Conflicts: Multi-indicator systems may produce contradictory signals in certain market situations, especially during market transitions. The solution is to introduce higher timeframe confirmation or add filtering conditions.
-
Lack of Stop-Loss Mechanism: The current strategy uses reverse signals as exit conditions but has no explicit stop-loss settings, which may lead to significant losses under extreme market conditions. It is recommended to add stop-loss mechanisms based on fixed percentages or ATR.
-
Computational Complexity: Multi-indicator strategies have relatively complex calculations and monitoring, which may increase the difficulty of strategy execution and potential for errors. It is recommended to use automated systems to execute the strategy, reducing human error.
Strategy Optimization Directions
Based on code analysis, this strategy can be optimized in the following directions:
-
Adaptive Parameters: Change fixed indicator parameters to adaptive ones, such as dynamically adjusting EMA and Bollinger Band parameters based on market volatility (ATR), to better adapt to different market environments. This allows for using longer periods in high volatility environments and shorter periods in low volatility environments.
-
Multi-Timeframe Analysis: Introduce higher timeframe trend confirmation, executing trades only when the trend direction in the higher timeframe is consistent. For example, only execute long signals on the 4-hour chart when the daily trend is upward.
-
Stop-Loss Optimization: Add dynamic stop-loss mechanisms based on ATR or key support/resistance levels to improve risk management capabilities. Consider using the previous ZigZag low as a stop-loss for long positions and the previous ZigZag high as a stop-loss for short positions.
-
Volume Filtering: Integrate volume indicators, such as OBV or volume-weighted moving averages, to ensure price movements are confirmed by trading volume, avoiding false breakouts in low volume environments.
-
Machine Learning Optimization: Use machine learning algorithms to automatically find optimal parameter combinations, or dynamically adjust the weight of different indicators in decision-making based on historical data predictions of each indicator's effectiveness.
-
Market State Classification: Add a market state recognition module to distinguish between trending and oscillating markets, applying different trading logic in different market states. For example, when identifying an oscillating market, more stringent entry filters can be added or the strategy can be adjusted to a pure mean reversion approach.
Summary
The Multi-Indicator Dynamic Trend Capture and Mean Reversion Strategy is a comprehensive trading system that combines multiple dimensions of technical analysis, building a multi-layered trading decision framework by integrating EMA, SMA, RSI, Bollinger Bands, and market structure analysis tools. This strategy provides sufficient flexibility to adapt to different market environments while maintaining systematicity and discipline.
The main advantages of this strategy lie in its multi-dimensional signal confirmation mechanism and complete trading logic, but it also faces challenges such as parameter sensitivity and market environment dependency. By introducing adaptive parameters, multi-timeframe analysis, enhanced risk management, and market state classification, this strategy has the potential to further improve its stability and adaptability.
For traders, this strategy provides a good starting point, but it is recommended to make necessary adjustments and optimizations according to personal risk preferences and trading objectives. Most importantly, any strategy should undergo thorough backtesting and small capital verification before actual deployment to ensure its effectiveness in real market environments.[/trans]
Source (PineScript)
/*backtest
start: 2024-04-18 00:00:00
end: 2024-12-05 00:00:00
period: 1d
basePeriod: 1d
exchanges: [{"eid":"Futures_Binance","currency":"TRX_USD"}]
*/

// This Pine Script® code is subject to the terms of the Mozilla Public License 2.0 at https://mozilla.org/MPL/2.0/
// © phoenixtradeteam

//@version=5
strategy("Phoenix Pro Strategy", overlay=true, max_lines_count=500, max_labels_count=500)

// === INPUTS === //
// Moving Averages
emaFastLen = input.int(9, "EMA Fast Length")
emaSlowLen = input.int(21, "EMA Slow Length")
smaShortLen = input.int(20, "SMA Short Length")
smaLongLen = input.int(50, "SMA Long Length")

// RSI
rsiLen = input.int(14, "RSI Period")
rsiOB = input.int(70, "RSI Overbought")
rsiOS = input.int(30, "RSI Oversold")

// Pivot High/Low
pivotLeft = input.int(5, "Pivot Left Bars")
pivotRight = input.int(5, "Pivot Right Bars")

// ZigZag
zigzagDev = input.float(5.0, "ZigZag Deviation %", step=0.1)

// Bollinger Bands
bbLength = input.int(20, "Bollinger Band Length")
bbMult = input.float(2.0, "Bollinger Band Multiplier")

// === CALCULATIONS === //
// MAs
emaFast = ta.ema(close, emaFastLen)
emaSlow = ta.ema(close, emaSlowLen)
smaShort = ta.sma(close, smaShortLen)
smaLong = ta.sma(close, smaLongLen)

// RSI
rsi = ta.rsi(close, rsiLen)

// Bollinger Bands
basis = ta.sma(close, bbLength)
deviation = bbMult * ta.stdev(close, bbLength)
upperBB = basis + deviation
lowerBB = basis - deviation

// Pivots
pivotHigh = ta.pivothigh(high, pivotLeft, pivotRight)
pivotLow = ta.pivotlow(low, pivotLeft, pivotRight)

// ZigZag
var float zigzagTop = na
var float zigzagBot = na
zigzagTop := (high >= high * (1 + zigzagDev / 100)) ? high : zigzagTop
zigzagBot := (low <= low * (1 - zigzagDev / 100)) ? low : zigzagBot

// === SIGNAL CONDITIONS === //
longCond = emaFast > emaSlow and close > smaShort and rsi < 60 and close > basis
shortCond = emaFast < emaSlow and close < smaShort and rsi > 40 and close < basis

// === STRATEGY EXECUTION === //
strategy.entry("Long", strategy.long, when=longCond)
strategy.close("Long", when=shortCond)
strategy.entry("Short", strategy.short, when=shortCond)
strategy.close("Short", when=longCond)

// === PLOTS === //
plot(emaFast, title="EMA Fast", color=color.orange)
plot(emaSlow, title="EMA Slow", color=color.red)
plot(smaShort, title="SMA Short", color=color.blue)
plot(smaLong, title="SMA Long", color=color.teal)

plot(upperBB, title="BB Upper", color=color.gray)
plot(lowerBB, title="BB Lower", color=color.gray)
plot(basis, title="BB Basis", color=color.gray)

plotshape(pivotHigh, title="Resistance", location=location.abovebar, style=shape.cross, color=color.red, size=size.tiny)
plotshape(pivotLow, title="Support", location=location.belowbar, style=shape.cross, color=color.green, size=size.tiny)

plot(zigzagTop, title="ZigZag High", color=color.fuchsia, linewidth=2)
plot(zigzagBot, title="ZigZag Low", color=color.aqua, linewidth=2)

// Background based on trend
bgcolor(emaFast > emaSlow ? color.new(color.green, 85) : emaFast < emaSlow ? color.new(color.red, 85) : na, title="Trend Background")
Detail
https://www.fmz.com/strategy/491038
Last Modified
2025-04-18 09:27:27