
11 KiB
Name
多指标动态波动预警交易系统-Multi-Indicator-Dynamic-Volatility-Alert-Trading-System
Author
ChaoZhang
Strategy Description
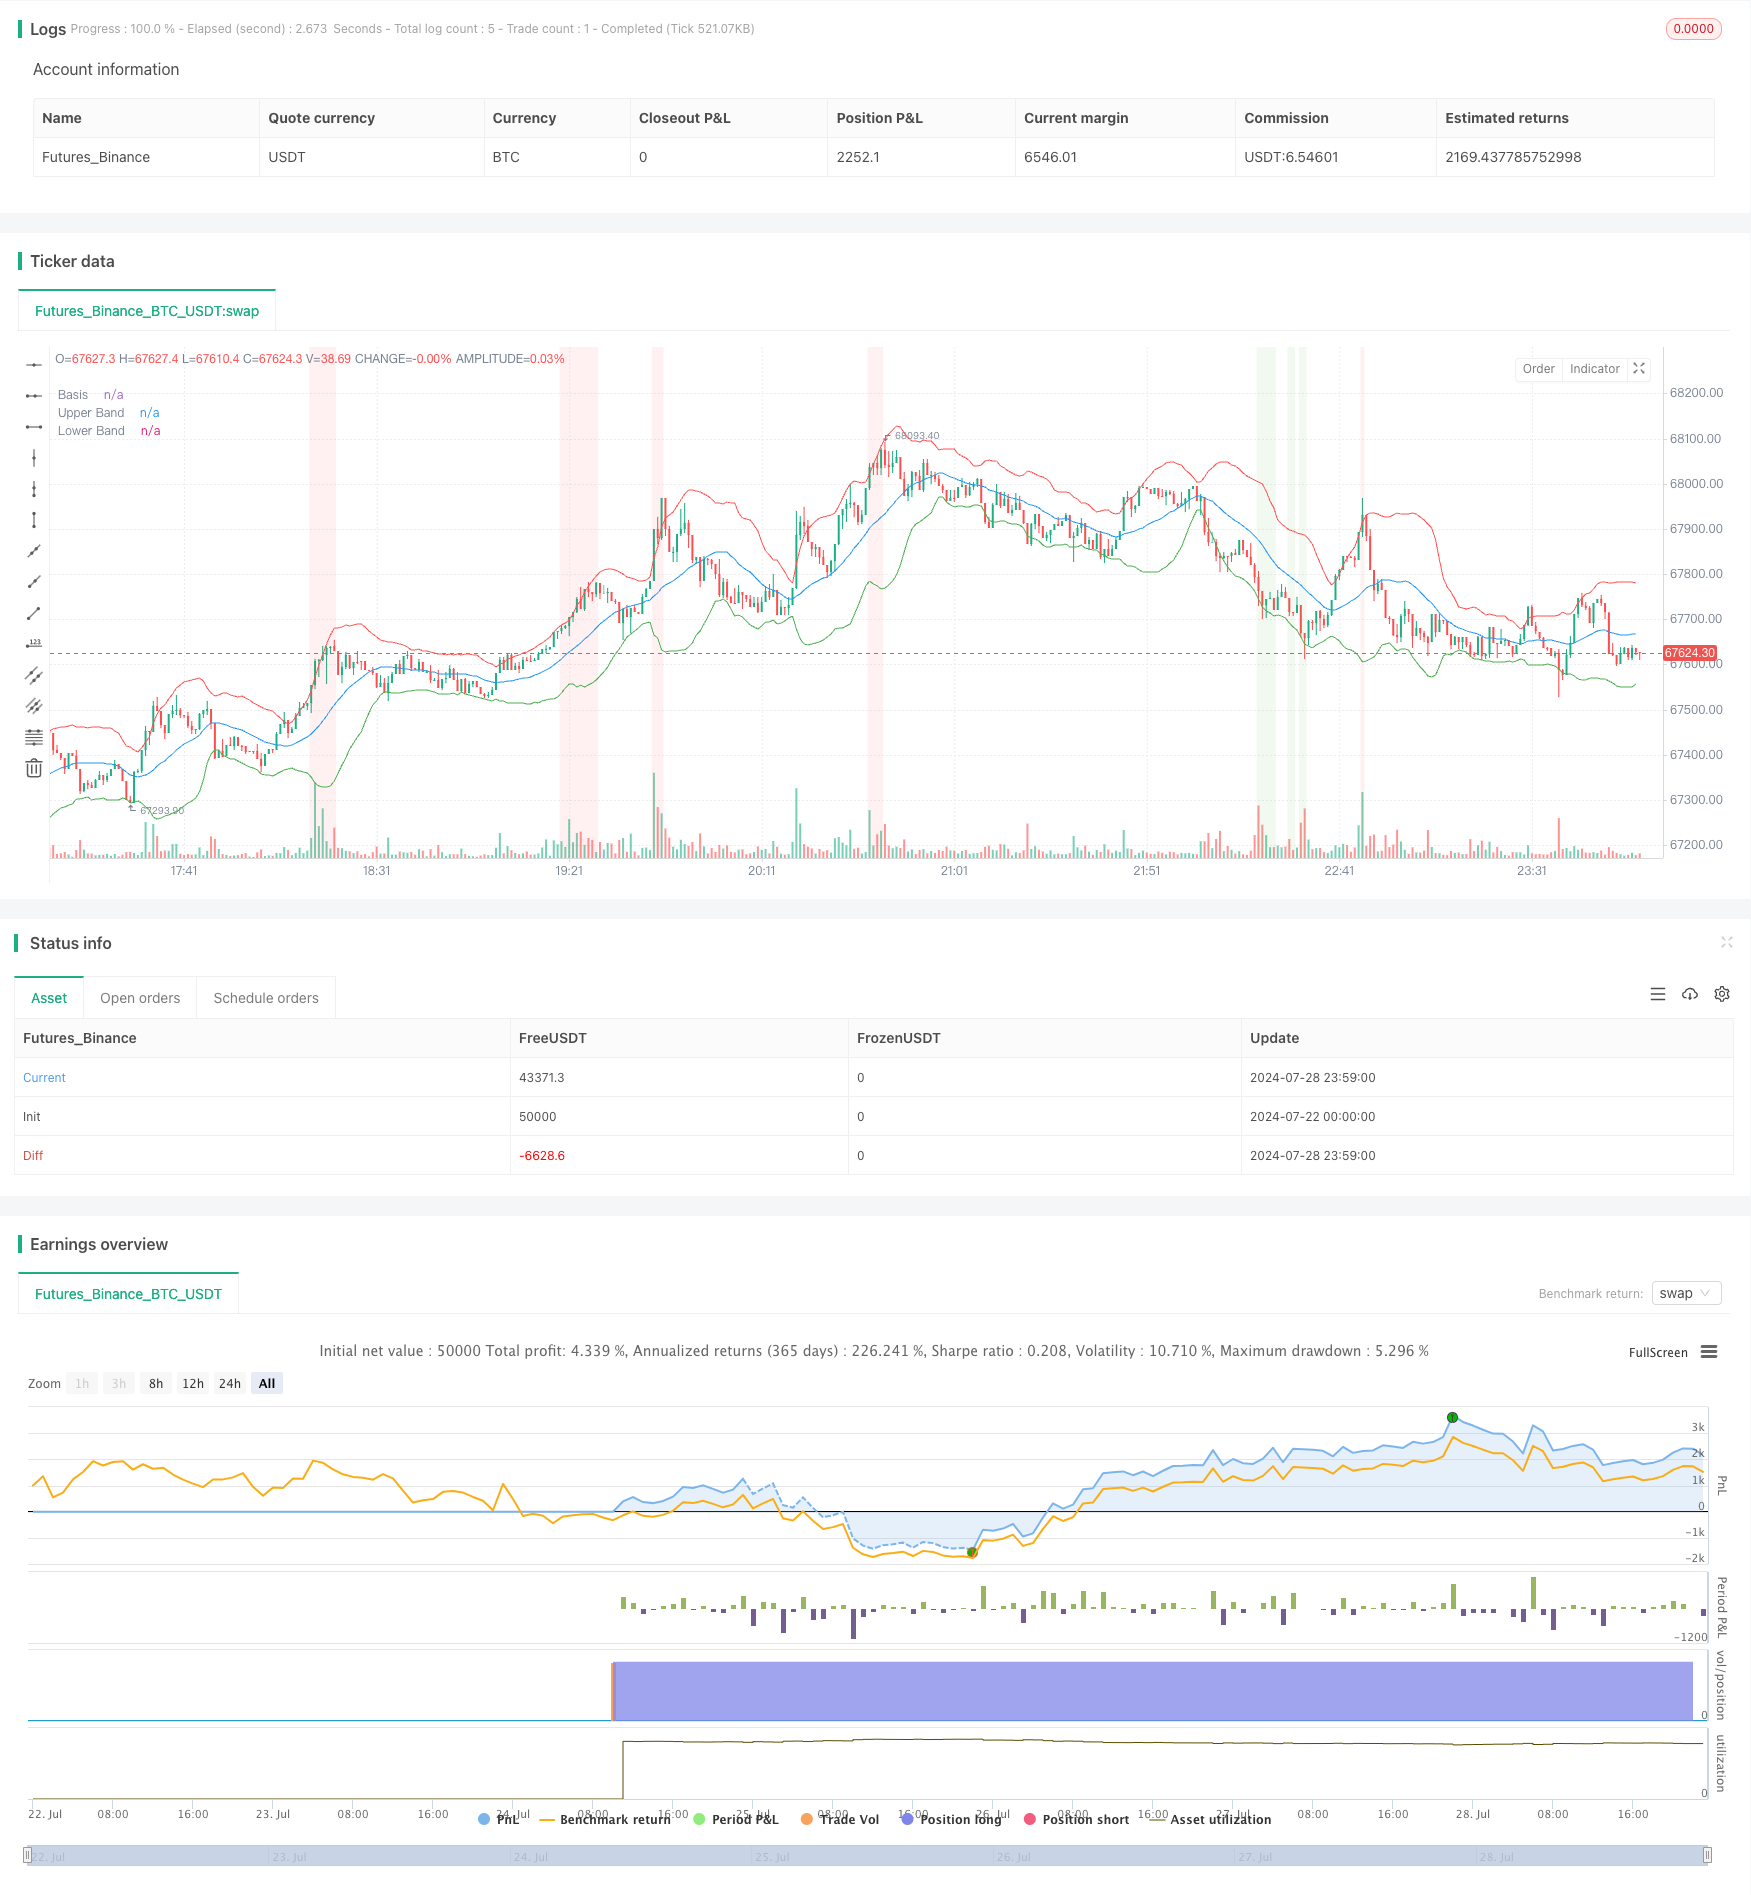
[trans]
概述
本策略是一个结合布林带、MACD和RSI三大技术指标的综合交易系统。它通过分析价格波动、趋势强度和超买超卖状态来生成交易信号。该策略的核心思想是在市场出现极端波动且趋势和动量指标确认时进行交易。
策略原理
-
布林带:使用20周期的简单移动平均线(SMA)作为中轨,上下轨距离中轨2个标准差。它用于衡量价格波动性和识别潜在的突破点。
-
MACD:采用12和26周期作为快慢线,9周期作为信号线。MACD用于确认价格趋势和动量。
-
RSI:使用14周期的相对强弱指数,设定70为超买水平,30为超卖水平。RSI用于识别可能的市场反转点。
-
交易逻辑:
- 买入信号:当价格低于布林带下轨、MACD快线上穿慢线且RSI低于30时。
- 卖出信号:当价格高于布林带上轨、MACD快线下穿慢线且RSI高于70时。
-
可视化:策略在图表上绘制布林带、MACD和RSI指标,并用背景色标注RSI的超买超卖区域。买卖信号通过标签直观显示。
策略优势
-
多维度分析:结合了趋势、动量和波动性分析,提供更全面的市场洞察。
-
风险管理:通过布林带和RSI的极值设置,有效控制入场风险。
-
趋势确认:MACD的使用有助于过滤假突破,提高交易的可靠性。
-
视觉直观:图表上清晰展示各指标和信号,便于交易者快速判断市场状况。
-
灵活性:关键参数可自定义,适应不同市场和交易风格。
-
市场适应性:适用于各种时间周期和交易品种,具有广泛的应用场景。
策略风险
-
滞后性:技术指标本质上是滞后的,可能导致在趋势转折点附近的错误信号。
-
过度交易:在震荡市场中可能产生频繁的交易信号,增加交易成本。
-
假突破:尽管有多重确认,仍可能在波动剧烈的市场中产生假信号。
-
参数敏感性:策略性能高度依赖于参数设置,不同市场可能需要频繁调整。
-
忽视基本面:纯技术分析可能忽视重要的基本面因素,影响长期表现。
策略优化方向
-
动态参数调整:引入自适应机制,根据市场波动性动态调整布林带和RSI的参数。
-
加入成交量分析:结合成交量指标,如OBV或CMF,以增强信号的可靠性。
-
时间过滤:增加交易时间窗口限制,避开高波动性或低流动性时段。
-
止损止盈优化:加入动态止损止盈机制,如跟踪止损或基于ATR的止损设置。
-
市场regime识别:加入市场状态(趋势/震荡)的判断逻辑,在不同市场环境下采用不同的交易策略。
-
多时间周期分析:整合多个时间周期的信号,提高交易决策的稳健性。
总结
多指标动态波动预警交易系统是一个综合了布林带、MACD和RSI的复杂策略。它通过多维度分析市场,在极端波动时捕捉潜在的交易机会。该策略的优势在于其全面的市场洞察和灵活的参数设置,但也面临着技术指标固有的滞后性和过度交易的风险。通过引入动态参数调整、加入成交量分析和优化止损止盈机制等方法,可以进一步提升策略的性能和稳定性。对于寻求在波动市场中把握机会的交易者来说,这是一个值得考虑的策略框架。然而,使用者需要谨记,没有完美的交易系统,持续的回测、优化和风险管理对于策略的长期成功至关重要。
||
Overview
This strategy is a comprehensive trading system that combines three major technical indicators: Bollinger Bands, MACD, and RSI. It generates trading signals by analyzing price volatility, trend strength, and overbought/oversold conditions. The core idea of this strategy is to initiate trades when extreme market volatility occurs and is confirmed by trend and momentum indicators.
Strategy Principles
-
Bollinger Bands: Uses a 20-period Simple Moving Average (SMA) as the middle band, with upper and lower bands set at 2 standard deviations. It measures price volatility and identifies potential breakout points.
-
MACD: Employs 12 and 26 periods for fast and slow lines, with a 9-period signal line. MACD confirms price trends and momentum.
-
RSI: Utilizes a 14-period Relative Strength Index, with 70 set as the overbought level and 30 as the oversold level. RSI identifies potential market reversal points.
-
Trading Logic:
- Buy Signal: When price is below the lower Bollinger Band, MACD line crosses above the signal line, and RSI is below 30.
- Sell Signal: When price is above the upper Bollinger Band, MACD line crosses below the signal line, and RSI is above 70.
-
Visualization: The strategy plots Bollinger Bands, MACD, and RSI indicators on the chart, with background colors highlighting RSI overbought/oversold zones. Buy and sell signals are visually displayed through labels.
Strategy Advantages
-
Multi-dimensional Analysis: Combines trend, momentum, and volatility analysis for a more comprehensive market insight.
-
Risk Management: Effectively controls entry risk through Bollinger Bands and RSI extreme value settings.
-
Trend Confirmation: The use of MACD helps filter out false breakouts, improving trade reliability.
-
Visual Intuitiveness: Clearly displays all indicators and signals on the chart, allowing traders to quickly assess market conditions.
-
Flexibility: Key parameters can be customized to adapt to different markets and trading styles.
-
Market Adaptability: Applicable to various time frames and trading instruments, offering a wide range of application scenarios.
Strategy Risks
-
Lagging Nature: Technical indicators are inherently lagging, which may lead to false signals near trend reversal points.
-
Over-trading: May generate frequent trading signals in range-bound markets, increasing transaction costs.
-
False Breakouts: Despite multiple confirmations, false signals may still occur in highly volatile markets.
-
Parameter Sensitivity: Strategy performance highly depends on parameter settings, which may require frequent adjustments for different markets.
-
Neglect of Fundamentals: Pure technical analysis may overlook important fundamental factors, affecting long-term performance.
Strategy Optimization Directions
-
Dynamic Parameter Adjustment: Introduce adaptive mechanisms to dynamically adjust Bollinger Bands and RSI parameters based on market volatility.
-
Incorporate Volume Analysis: Integrate volume indicators such as OBV or CMF to enhance signal reliability.
-
Time Filtering: Add trading time window restrictions to avoid high volatility or low liquidity periods.
-
Stop-loss and Take-profit Optimization: Implement dynamic stop-loss and take-profit mechanisms, such as trailing stops or ATR-based stop settings.
-
Market Regime Recognition: Add logic to identify market states (trending/ranging) and apply different trading strategies accordingly.
-
Multi-timeframe Analysis: Integrate signals from multiple time frames to improve the robustness of trading decisions.
Conclusion
The Multi-Indicator Dynamic Volatility Alert Trading System is a sophisticated strategy combining Bollinger Bands, MACD, and RSI. It analyzes the market from multiple dimensions to capture potential trading opportunities during extreme volatility. The strategy's strengths lie in its comprehensive market insights and flexible parameter settings, but it also faces risks inherent to technical indicators, such as lag and potential over-trading. Performance and stability can be further enhanced through dynamic parameter adjustments, volume analysis integration, and optimized stop-loss and take-profit mechanisms. This strategy framework is worth considering for traders seeking to capitalize on opportunities in volatile markets. However, users should remember that no trading system is perfect, and continuous backtesting, optimization, and risk management are crucial for long-term success.
[/trans]
Source (PineScript)
/*backtest
start: 2024-07-22 00:00:00
end: 2024-07-29 00:00:00
period: 1m
basePeriod: 1m
exchanges: [{"eid":"Futures_Binance","currency":"BTC_USDT"}]
*/

//@version=5
strategy("Bollinger Bands with MACD and RSI Strategy", overlay=true)

// Bollinger Bands parameters
length = input(20, title="Bollinger Bands Length")
src = input(close, title="Source")
mult = input(2.0, title="Bollinger Bands Multiplier")

// MACD parameters
macdFastLength = input(12, title="MACD Fast Length")
macdSlowLength = input(26, title="MACD Slow Length")
macdSignalSmoothing = input(9, title="MACD Signal Smoothing")

// RSI parameters
rsiLength = input(14, title="RSI Length")
rsiOverbought = input(70, title="RSI Overbought Level")
rsiOversold = input(30, title="RSI Oversold Level")

// Bollinger Bands calculation
basis = ta.sma(src, length)
dev = mult * ta.stdev(src, length)
upper = basis + dev
lower = basis - dev

plot(basis, color=color.blue, linewidth=1, title="Basis")
plot(upper, color=color.red, linewidth=1, title="Upper Band")
plot(lower, color=color.green, linewidth=1, title="Lower Band")

// MACD calculation
[macdLine, signalLine, _] = ta.macd(src, macdFastLength, macdSlowLength, macdSignalSmoothing)
macdHist = macdLine - signalLine

// RSI calculation
rsi = ta.rsi(src, rsiLength)

// Buy/Sell signals based on Bollinger Bands, MACD, and RSI
buySignal = (src < lower) and (macdLine > signalLine) and (rsi < rsiOversold)
sellSignal = (src > upper) and (macdLine < signalLine) and (rsi > rsiOverbought)

plotshape(series=buySignal, location=location.belowbar, color=color.green, style=shape.labelup, text="BUY")
plotshape(series=sellSignal, location=location.abovebar, color=color.red, style=shape.labeldown, text="SELL")

// Plotting the MACD and RSI on the chart
// hline(0, "Zero Line", color=color.gray)
// plot(macdLine, title="MACD Line", color=color.blue, linewidth=1)
// plot(signalLine, title="Signal Line", color=color.orange, linewidth=1)
// plot(macdHist, title="MACD Histogram", color=color.red, style=plot.style_histogram, histbase=0)
// hline(rsiOverbought, "Overbought", color=color.red, linestyle=hline.style_dotted)
// hline(rsiOversold, "Oversold", color=color.green, linestyle=hline.style_dotted)
// plot(rsi, title="RSI", color=color.orange, linewidth=1)

// Background color for RSI levels
bgcolor(rsi > rsiOverbought ? color.new(color.red, 90) : na)
bgcolor(rsi < rsiOversold ? color.new(color.green, 90) : na)

// Strategy logic
if (buySignal)
    strategy.entry("Buy", strategy.long)
if (sellSignal)
    strategy.entry("Sell", strategy.short)
Detail
https://www.fmz.com/strategy/458176
Last Modified
2024-07-30 15:57:24