
16 KiB
Name
多指标动态波动突破策略基于EMA趋势确认与RSI超买超卖结合K线形态分析-Multi-Indicator-Dynamic-Volatility-Breakout-Strategy-EMA-Trend-Confirmation-with-RSI-Overbought-Oversold-and-Candlestick-Pattern-Analysis
Author
ianzeng123
Strategy Description
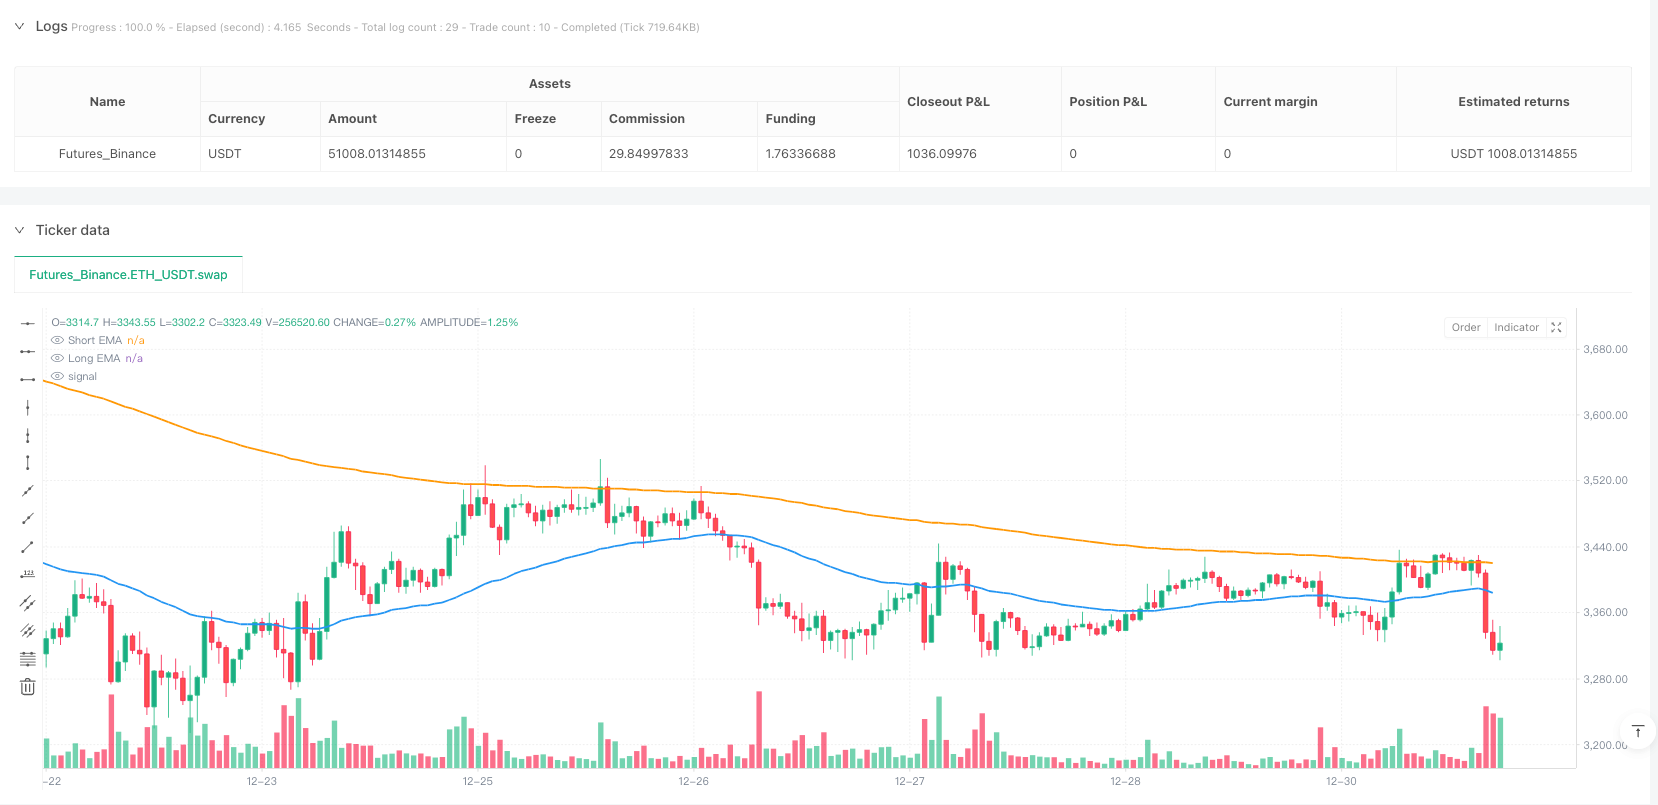
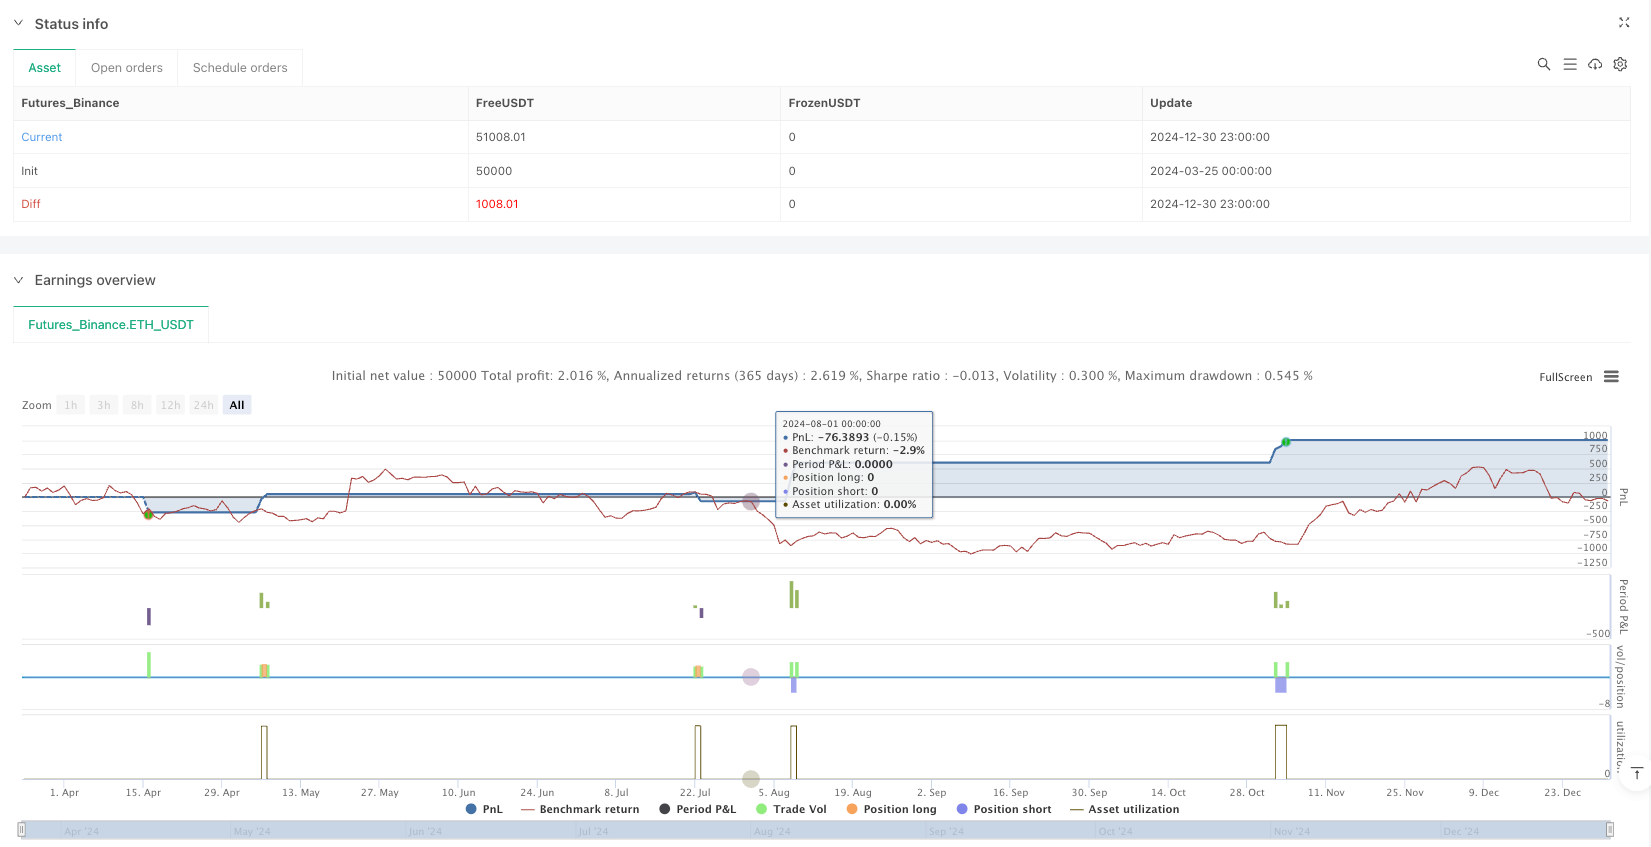
[trans]
概述
多指标动态波动突破策略是一种综合性交易策略,结合了技术分析中的多种指标和K线形态,旨在捕捉市场趋势的转折点。该策略主要利用指数移动平均线(EMA)确认趋势方向,相对强弱指标(RSI)识别超买超卖区域,平均真实波幅(ATR)动态计算止损和止盈水平,并结合多种反转K线形态作为交易信号的确认。这种多层次的信号确认机制,能够有效过滤假突破信号,提高交易的成功率。
策略原理
该策略的核心原理基于多重条件的聚合分析,形成了一套完整的交易系统:
-
趋势确认:使用短期EMA(50周期)和长期EMA(200周期)来确定市场趋势。价格必须突破短期EMA且位于长期EMA之上才考虑做多;反之,价格必须跌破短期EMA且位于长期EMA之下才考虑做空。这确保了交易方向与主要趋势一致。
-
动量分析:利用RSI指标(14周期)评估市场动量。做多条件要求RSI低于45或处于超卖区域(RSI<30);做空条件要求RSI高于55或处于超买区域(RSI>70)。这帮助在趋势可能反转的区域进行交易。
-
K线形态确认:
- 做多信号需要出现锤子线或启明星形态
- 做空信号需要出现射击之星或黄昏之星形态 这些K线形态是市场心理转变的视觉表现,增强了信号的可靠性。
-
风险管理:使用ATR(14周期)计算动态止损和止盈水平:
- 做多止损:当前价格 - (ATR × 1.5)
- 做多止盈:当前价格 + (ATR × 2.0 × 2)
- 做空止损:当前价格 + (ATR × 1.5)
- 做空止盈:当前价格 - (ATR × 2.0 × 2)
该止损设计考虑了市场波动性,而止盈比例是止损的2倍以上,建立了理想的风险回报比。
策略优势
-
多层次信号过滤:结合多个技术指标和K线形态,大大降低了假信号风险。只有当趋势、动量和形态共同确认时,才会生成交易信号,提高了策略的精确度。
-
自适应风险管理:基于ATR的动态止损止盈机制能够根据市场波动性自动调整,在波动剧烈的市场环境中设置更大的保护区间,在稳定市场中则更为精确。
-
灵活的时间框架:该策略可应用于所有时间周期,从日内交易到长期投资均可适用,为不同交易风格的投资者提供了选择空间。
-
明确的进出场规则:策略提供了客观的入场和出场条件,减少了主观判断,帮助交易者保持纪律性和一致性。
-
资金管理集成:策略默认使用账户资金的20%进行每笔交易,这种比例分配有助于长期资金增长和风险分散。
策略风险
-
假突破风险:虽然策略包含多层过滤条件,但在震荡市场中仍可能出现假突破。解决方法:可考虑增加确认周期或在高波动性环境中调整RSI参数。
-
趋势反转迟滞:使用EMA作为趋势确认工具可能导致在趋势反转时存在一定滞后。解决方法:可结合更敏感的指标如MACD或考虑缩短EMA长度,但需平衡信号质量和及时性。
-
K线形态识别局限性:代码中的K线形态识别相对简化,可能无法捕捉所有复杂市场形态。解决方法:优化形态识别算法,或考虑引入更全面的形态库。
-
参数优化风险:策略性能高度依赖于参数设置(如EMA长度、RSI阈值等)。解决方法:进行回测分析找到稳健参数,避免过度优化导致的曲线拟合问题。
-
流动性风险:策略未考虑市场流动性,在低流动性环境中可能导致滑点增加。解决方法:增加交易量过滤条件,避免在低流动性条件下交易。
策略优化方向
-
加入波动率过滤器:在策略中引入波动率限制条件,例如基于ATR的波动率百分比,只在波动率适中的环境下交易,可以提高信号质量。原因:极高或极低波动率环境下的交易信号通常质量较差。
-
增强K线形态识别:当前策略使用的K线形态识别较为基础,可以引入更复杂的形态识别算法,如考虑更长的K线序列或引入机器学习方法识别形态。原因:更精确的形态识别能显著提高交易信号的质量。
-
优化资金管理:可实施动态头寸大小管理,根据信号强度、市场波动性或账户绩效调整仓位大小。原因:固定百分比资金管理无法充分利用高质量交易机会或降低高风险环境中的敞口。
-
加入时间过滤器:某些市场在特定时段表现出更好的趋势性或流动性,可引入时间过滤条件,仅在最佳交易时段执行策略。原因:市场效率在不同时段存在显著差异。
-
引入多时间框架分析:将更长时间周期的趋势分析整合到当前周期的交易决策中,只在主趋势方向上进行交易。原因:与更大趋势一致的交易通常具有更高的成功率。
总结
多指标动态波动突破策略是一个结构完善、逻辑严谨的量化交易系统,通过整合EMA趋势分析、RSI动量评估、K线形态识别和基于ATR的风险管理,形成了一套全面的交易决策框架。该策略最大的优势在于其多层次的信号确认机制和自适应的风险管理系统,能够在不同市场环境中灵活应对。
尽管存在一些固有的风险,如假突破和参数依赖等问题,但通过针对性的优化措施,如增强形态识别、引入波动率过滤和实施多时间框架分析等,可以进一步提高策略的稳健性和盈利能力。对于寻求系统化、规则明确且具有自适应特性的交易方法的投资者而言,这一策略提供了一个值得考虑的选择。
最终,任何策略的成功都离不开持续的监控和动态调整。投资者应根据市场变化和自身风险偏好,不断优化策略参数和交易规则,以实现长期稳定的投资回报。
||
Overview
The Multi-Indicator Dynamic Volatility Breakout Strategy is a comprehensive trading approach that combines multiple technical indicators and candlestick patterns to capture market trend reversal points. This strategy primarily utilizes Exponential Moving Averages (EMA) to confirm trend direction, Relative Strength Index (RSI) to identify overbought and oversold zones, Average True Range (ATR) to dynamically calculate stop-loss and take-profit levels, and incorporates various reversal candlestick patterns as confirmation signals. This multi-layered signal confirmation mechanism effectively filters out false breakout signals and improves trading success rates.
Strategy Principles
The core principle of this strategy is based on aggregated analysis of multiple conditions, forming a complete trading system:
-
Trend Confirmation: Using short-term EMA (50 periods) and long-term EMA (200 periods) to determine market trends. Prices must break above the short-term EMA and be above the long-term EMA for long positions; conversely, prices must break below the short-term EMA and be below the long-term EMA for short positions. This ensures that trading direction aligns with the primary trend.
-
Momentum Analysis: Utilizing the RSI indicator (14 periods) to evaluate market momentum. Long conditions require RSI below 45 or in oversold territory (RSI<30); short conditions require RSI above 55 or in overbought territory (RSI>70). This helps to trade in areas where trends may be reversing.
-
Candlestick Pattern Confirmation:
- Long signals require hammer or morning star patterns
- Short signals require shooting star or evening star patterns These candlestick patterns are visual representations of market psychology shifts, enhancing signal reliability.
-
Risk Management: Using ATR (14 periods) to calculate dynamic stop-loss and take-profit levels:
- Long stop-loss: Current price - (ATR × 1.5)
- Long take-profit: Current price + (ATR × 2.0 × 2)
- Short stop-loss: Current price + (ATR × 1.5)
- Short take-profit: Current price - (ATR × 2.0 × 2)
This stop-loss design considers market volatility, while the take-profit ratio is more than twice the stop-loss, establishing an ideal risk-reward ratio.
Strategy Advantages
-
Multi-layered Signal Filtering: Combining multiple technical indicators and candlestick patterns significantly reduces the risk of false signals. Trading signals are only generated when trend, momentum, and pattern all confirm together, improving the strategy's precision.
-
Adaptive Risk Management: The ATR-based dynamic stop-loss and take-profit mechanism automatically adjusts according to market volatility, setting wider protection ranges in volatile market environments and more precise ones in stable markets.
-
Flexible Timeframes: The strategy can be applied to all time periods, from intraday trading to long-term investment, providing options for investors with different trading styles.
-
Clear Entry and Exit Rules: The strategy provides objective entry and exit conditions, reducing subjective judgment and helping traders maintain discipline and consistency.
-
Integrated Capital Management: The strategy defaults to using 20% of account equity for each trade, a proportion that helps with long-term capital growth and risk diversification.
Strategy Risks
-
False Breakout Risk: Despite multiple filtering conditions, false breakouts may still occur in oscillating markets. Solution: Consider adding confirmation periods or adjusting RSI parameters in high-volatility environments.
-
Trend Reversal Lag: Using EMA as a trend confirmation tool may lead to some lag when trends reverse. Solution: Combine with more sensitive indicators like MACD or consider shortening EMA length, balancing signal quality and timeliness.
-
Candlestick Pattern Recognition Limitations: The candlestick pattern recognition in the code is relatively simplified and may not capture all complex market patterns. Solution: Optimize pattern recognition algorithms or consider introducing a more comprehensive pattern library.
-
Parameter Optimization Risk: Strategy performance is highly dependent on parameter settings (such as EMA length, RSI thresholds, etc.). Solution: Conduct backtesting analysis to find robust parameters, avoiding curve-fitting issues from excessive optimization.
-
Liquidity Risk: The strategy does not consider market liquidity, which may lead to increased slippage in low-liquidity environments. Solution: Add trading volume filtering conditions to avoid trading in low-liquidity conditions.
Strategy Optimization Directions
-
Add Volatility Filter: Introduce volatility limit conditions in the strategy, such as volatility percentages based on ATR, only trading in environments with moderate volatility to improve signal quality. Reason: Trading signals in extremely high or low volatility environments typically have poorer quality.
-
Enhance Candlestick Pattern Recognition: The current strategy uses basic candlestick pattern recognition. More complex pattern recognition algorithms could be introduced, such as considering longer candlestick sequences or introducing machine learning methods for pattern recognition. Reason: More precise pattern recognition can significantly improve trading signal quality.
-
Optimize Capital Management: Implement dynamic position sizing management, adjusting position size based on signal strength, market volatility, or account performance. Reason: Fixed percentage capital management cannot fully utilize high-quality trading opportunities or reduce exposure in high-risk environments.
-
Add Time Filters: Some markets show better trending characteristics or liquidity during specific time periods. Time filtering conditions could be introduced to execute the strategy only during optimal trading periods. Reason: Market efficiency varies significantly across different time periods.
-
Introduce Multi-timeframe Analysis: Integrate trend analysis from longer timeframes into current timeframe trading decisions, only trading in the direction of the main trend. Reason: Trades aligned with larger trends typically have higher success rates.
Summary
The Multi-Indicator Dynamic Volatility Breakout Strategy is a well-structured and logically rigorous quantitative trading system that forms a comprehensive trading decision framework by integrating EMA trend analysis, RSI momentum assessment, candlestick pattern recognition, and ATR-based risk management. The strategy's greatest advantage lies in its multi-layered signal confirmation mechanism and adaptive risk management system, allowing flexible responses in different market environments.
Despite some inherent risks such as false breakouts and parameter dependency issues, the strategy's robustness and profitability can be further enhanced through targeted optimization measures, including strengthened pattern recognition, introduction of volatility filters, and implementation of multi-timeframe analysis. For investors seeking systematized, rule-clear, and adaptive trading methods, this strategy provides a worthy consideration.
Ultimately, the success of any strategy depends on continuous monitoring and dynamic adjustment. Investors should constantly optimize strategy parameters and trading rules based on market changes and personal risk preferences to achieve long-term stable investment returns. [/trans]
Source (PineScript)
/*backtest
start: 2024-03-25 00:00:00
end: 2024-12-31 00:00:00
period: 1h
basePeriod: 1h
exchanges: [{"eid":"Futures_Binance","currency":"ETH_USDT"}]
*/

//@version=5
strategy("Comprehensive Trading Strategy", overlay=true, pyramiding=1, calc_on_every_tick=true, process_orders_on_close=true, default_qty_type=strategy.percent_of_equity, default_qty_value=20)

// Input Settings
emaLength = input.int(50, title="Short EMA Length")
longEmaLength = input.int(200, title="Long EMA Length")
rsiLength = input.int(14, title="RSI Length")
atrLength = input.int(14, title="ATR Length")
stopLossMultiplier = input.float(1.5, title="Stop Loss Multiplier")
takeProfitMultiplier = input.float(2.0, title="Take Profit Multiplier")

// Indicators
ema = ta.ema(close, emaLength)
longEma = ta.ema(close, longEmaLength)
rsi = ta.rsi(close, rsiLength)
atr = ta.atr(atrLength)

// Candlestick Patterns
hammer = close > open and ta.lowest(low, 5) == low and (high - low) > 2 * (close - open)
shootingStar = close < open and ta.highest(high, 5) == high and (high - low) > 2 * (open - close)
hangingMan = close < open and ta.lowest(low, 5) == low and (high - low) > 2 * (open - close)
morningStar = close[2] < open[2] and close[1] < open[1] and close > open and close > close[1]
eveningStar = close[2] > open[2] and close[1] > open[1] and close < open and close < close[1]

// Buy & Sell Conditions
longCondition = ta.crossover(close, ema) and rsi < 45 and (hammer or morningStar or rsi < 30) and close > longEma
shortCondition = ta.crossunder(close, ema) and rsi > 55 and (shootingStar or eveningStar or rsi > 70) and close < longEma

// Stop Loss & Take Profit
longStopLoss = close - (atr * stopLossMultiplier)
longTakeProfit = close + (atr * takeProfitMultiplier * 2)
shortStopLoss = close + (atr * stopLossMultiplier)
shortTakeProfit = close - (atr * takeProfitMultiplier * 2)

// Execute Trades
if longCondition
    strategy.entry("Buy", strategy.long)
    strategy.exit("Take Profit", from_entry="Buy", limit=longTakeProfit, stop=longStopLoss)

if shortCondition
    strategy.entry("Sell", strategy.short)
    strategy.exit("Take Profit", from_entry="Sell", limit=shortTakeProfit, stop=shortStopLoss)

// Plot Indicators
plot(ema, title="Short EMA", color=color.blue, linewidth=2)
plot(longEma, title="Long EMA", color=color.orange, linewidth=2)
plotshape(series=longCondition, location=location.belowbar, color=color.green, style=shape.labelup, title="Buy Signal", text="شراء")
plotshape(series=shortCondition, location=location.abovebar, color=color.red, style=shape.labeldown, title="Sell Signal", text="بيع")
Detail
https://www.fmz.com/strategy/488271
Last Modified
2025-03-26 14:07:38