
11 KiB
Name
多指标优化型KDJ趋势交叉策略基于动态随机形态的交易系统-Multi-Indicator-Optimized-KDJ-Trend-Crossover-Strategy-Based-on-Dynamic-Stochastic-Pattern-Trading-System
Author
ChaoZhang
Strategy Description
[trans]
概述
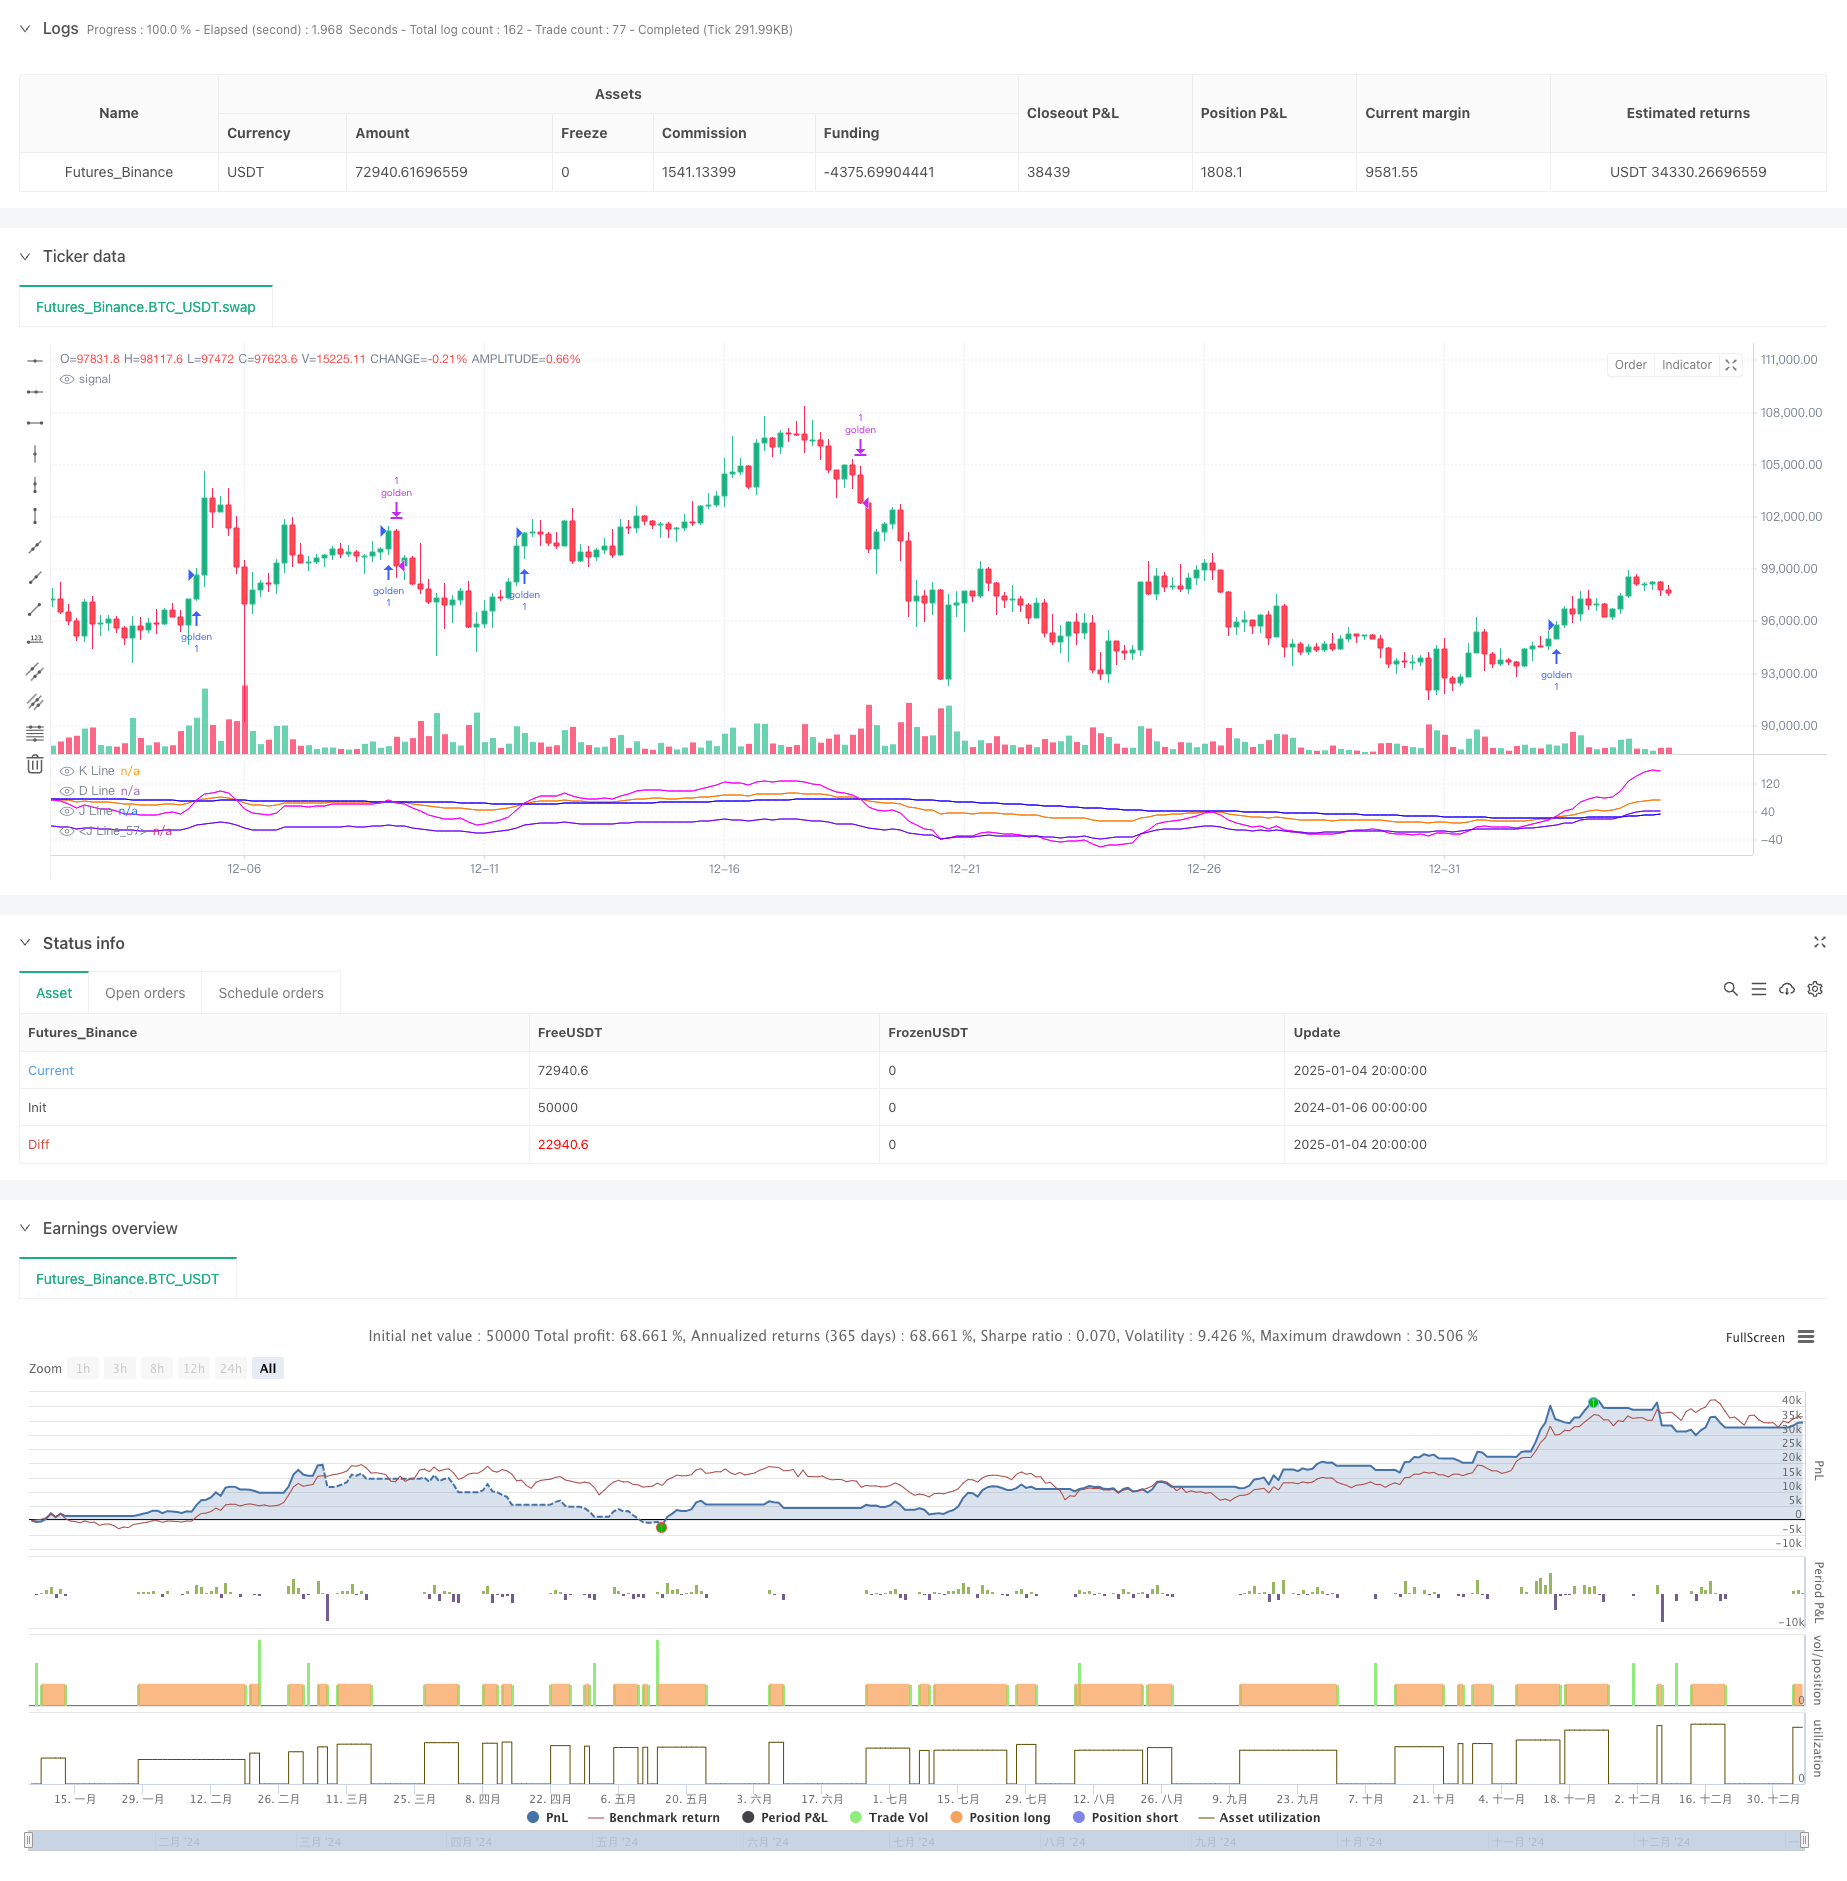
该策略是一个基于KDJ指标的高级交易系统,通过对K线、D线和J线的交叉形态进行深度分析来捕捉市场趋势。策略集成了自定义的BCWSMA平滑算法,通过对随机指标的优化计算提高了信号的可靠性。系统采用了严格的风险控制机制,包括止损和移动止损功能,以实现稳健的资金管理。
策略原理
策略的核心逻辑基于以下几个关键要素:
- 使用自定义的BCWSMA(加权移动平均)算法计算KDJ指标,提高了指标的平滑性和稳定性
- 通过RSV(未成熟随机值)的计算,将价格转化为0-100区间的数值,更好地反映价格在高低点之间的位置
- 设计了独特的J线与J5线(衍生指标)交叉验证机制,通过多重确认提高交易信号的准确性
- 建立了基于持续性的趋势确认机制,要求J线连续3天保持在D线上方才确认趋势的有效性
- 集成了百分比止损和移动止损的复合风险控制系统
策略优势
- 信号生成机制先进:通过多重技术指标交叉验证,显著降低了虚假信号的影响
- 风险控制完善:采用多层次的风险控制机制,包括固定止损和移动止损,有效控制下行风险
- 参数可调性强:关键参数如KDJ周期、信号平滑系数等都可根据市场情况灵活调整
- 计算效率高:使用优化的BCWSMA算法,降低了计算复杂度,提高了策略执行效率
- 适应性好:可以适应不同的市场环境,通过参数调整优化策略表现
策略风险
- 震荡市场风险:在横盘震荡市场中可能产生频繁的假突破信号,增加交易成本
- 滞后性风险:由于使用了均线平滑处理,信号可能出现一定程度的滞后
- 参数敏感性:策略效果对参数设置较为敏感,不当的参数设置可能导致策略效果显著降低
- 市场环境依赖:在某些特定市场环境下,策略表现可能不够理想
策略优化方向
- 信号过滤机制优化:可以引入成交量、波动率等辅助指标,提高信号的可靠性
- 动态参数调整:根据市场波动情况动态调整KDJ参数和止损参数
- 市场环境识别:增加市场环境判断模块,在不同市场环境下采用不同的交易策略
- 风险控制增强:可以添加最大回撤控制、持仓时间限制等额外的风险控制手段
- 性能优化:进一步优化BCWSMA算法,提高计算效率
总结
该策略通过创新的技术指标组合和严格的风险控制,构建了一个完整的交易系统。策略的核心优势在于多重信号确认机制和完善的风险控制体系,但也需要注意参数优化和市场环境适应性的问题。通过持续优化和改进,策略有望在不同市场环境下都能保持稳定的表现。
||
Overview
This strategy is an advanced trading system based on the KDJ indicator, which captures market trends through in-depth analysis of K-line, D-line, and J-line crossover patterns. The strategy integrates a custom BCWSMA smoothing algorithm, improving signal reliability through optimized calculation of stochastic indicators. The system employs strict risk control mechanisms, including stop-loss and trailing stop features, to achieve robust money management.
Strategy Principles
The core logic of the strategy is based on several key elements:
- Uses custom BCWSMA (Weighted Moving Average) algorithm to calculate KDJ indicators, improving indicator smoothness and stability
- Converts prices to 0-100 range through RSV (Raw Stochastic Value) calculation, better reflecting price position between highs and lows
- Designs unique J-line and J5-line (derivative indicator) cross-validation mechanism, improving trade signal accuracy through multiple confirmations
- Establishes trend confirmation mechanism based on continuity, requiring J-line to remain above D-line for 3 consecutive days to confirm trend validity
- Integrates composite risk control system with percentage stop-loss and trailing stop-loss
Strategy Advantages
- Advanced Signal Generation: Significantly reduces false signals through multiple technical indicator cross-validation
- Comprehensive Risk Control: Employs multi-level risk control mechanisms, including fixed and trailing stops, effectively controlling downside risk
- Strong Parameter Adaptability: Key parameters like KDJ period and signal smoothing coefficients can be flexibly adjusted based on market conditions
- High Computational Efficiency: Uses optimized BCWSMA algorithm, reducing computational complexity and improving strategy execution efficiency
- Good Adaptability: Can adapt to different market environments through parameter adjustment optimization
Strategy Risks
- Oscillation Market Risk: May generate frequent false breakout signals in sideways markets, increasing trading costs
- Lag Risk: Signals may experience some delay due to moving average smoothing
- Parameter Sensitivity: Strategy effectiveness is sensitive to parameter settings, improper settings may significantly reduce strategy performance
- Market Environment Dependency: Strategy performance may not be ideal in certain specific market environments
Strategy Optimization Directions
- Signal Filter Mechanism Optimization: Can introduce auxiliary indicators like volume and volatility to improve signal reliability
- Dynamic Parameter Adjustment: Dynamically adjust KDJ parameters and stop-loss parameters based on market volatility
- Market Environment Recognition: Add market environment judgment module to adopt different trading strategies in different market environments
- Risk Control Enhancement: Can add additional risk control measures like maximum drawdown control and position time limits
- Performance Optimization: Further optimize BCWSMA algorithm to improve computational efficiency
Summary
The strategy builds a complete trading system through innovative technical indicator combinations and strict risk control. The core advantages lie in multiple signal confirmation mechanisms and comprehensive risk control systems, but attention needs to be paid to parameter optimization and market environment adaptability. Through continuous optimization and improvement, the strategy has the potential to maintain stable performance across different market environments.[/trans]
Source (PineScript)
/*backtest
start: 2024-01-06 00:00:00
end: 2025-01-05 00:00:00
period: 4h
basePeriod: 4h
exchanges: [{"eid":"Futures_Binance","currency":"BTC_USDT"}]
*/

// This Pine Script™ code is subject to the terms of the Mozilla Public License 2.0 at https://mozilla.org/MPL/2.0/
// © hexu90

//@version=6

// Date Range
// STEP 1. Create inputs that configure the backtest's date range
useDateFilter = input.bool(true, title="Filter Date Range of Backtest",
     group="Backtest Time Period")
backtestStartDate = input(timestamp("1 Jan 2020"),
     title="Start Date", group="Backtest Time Period",
     tooltip="This start date is in the time zone of the exchange " +
     "where the chart's instrument trades. It doesn't use the time " +
     "zone of the chart or of your computer.")
backtestEndDate = input(timestamp("15 Dec 2024"),
     title="End Date", group="Backtest Time Period",
     tooltip="This end date is in the time zone of the exchange " +
     "where the chart's instrument trades. It doesn't use the time " +
     "zone of the chart or of your computer.")
// STEP 2. See if current bar falls inside the date range
inTradeWindow = true

//KDJ strategy
// indicator("My Customized KDJ", shorttitle="KDJ")
strategy("My KDJ Strategy", overlay = false)

// Input parameters
ilong = input(90, title="Period")
k_isig = input(3, title="K Signal")
d_isig = input(30, title="D Signal")

// Custom BCWSMA calculation outside the function
bcwsma(source, length, weight) =>
    var float prev = na  // Persistent variable to store the previous value
    if na(prev)
        prev := source  // Initialize on the first run
    prev := (weight * source + (length - weight) * prev) / length
    prev

// Calculate KDJ
c = close
h = ta.highest(high, ilong)
l = ta.lowest(low, ilong)
RSV = 100 * ((c - l) / (h - l))
pK = bcwsma(RSV, k_isig, 1)
pD = bcwsma(pK, d_isig, 1)
pJ = 3 * pK - 2 * pD

pJ1 = 0
pJ2 = 80
pJ5 = (pJ-pK)-(pK-pD)

// Plot the K, D, J lines with colors
plot(pK, color=color.rgb(251, 121, 8), title="K Line")  // Orange
plot(pD, color=color.rgb(30, 0, 255), title="D Line")  // Blue
plot(pJ, color=color.new(color.rgb(251, 0, 255), 10), title="J Line")  // Pink with transparency
plot(pJ5, color=#6f03f3e6, title="J Line")  // Pink with transparency

// Background color and reference lines
// bgcolor(pJ > pD ? color.new(color.green, 75) : color.new(color.red, 75))
// hline(80, "Upper Band", color=color.gray)
// hline(20, "Lower Band", color=color.gray)

// Variables to track the conditions
var bool condition1_met = false
var int condition2_met = 0

// Condition 1: pJ drops below pJ5
if ta.crossunder(pJ, pJ5)
    condition1_met := true
    condition2_met := 0  // Reset condition 2 if pJ drops below pJ5 again

if ta.crossover(pJ, pD)
    condition2_met += 1

to_long = ta.crossover(pJ, pD)


var int consecutiveDays = 0
// Update the count of consecutive days
if pJ > pD
    consecutiveDays += 1
else
    consecutiveDays := 0

// Check if pJ has been above pD for more than 3 days
consPJacrossPD = false
if consecutiveDays > 3
    consPJacrossPD := true

// Entry condition: After condition 2, pJ crosses above pD a second time
// if condition1_met and condition2_met > 1
//     strategy.entry("golden", strategy.long, qty=1000)
//     condition1_met := false  // Reset the conditions for a new cycle
//     condition2_met = 0
//
if ta.crossover(pJ, pD)
    // and pD < 40 and consPJacrossPD
    // consecutiveDays == 1
    //  consecutiveDays == 3 and
    strategy.entry("golden", strategy.long, qty=1)

// to_short =
// or ta.crossunder(pJ, 100)

// Exit condition
if ta.crossover(pD, pJ)
    strategy.close("golden", qty = 1)

// Stop loss and trailing profit
trail_stop_pct = input.float(0.5, title="Trailing Stop activation (%)", group="Exit Lonng", inline="LTS", tooltip="Trailing Treshold %")
trail_offset_pct = input.float(0.5, title="Trailing Offset (%)", group="Exit Lonng", inline="LTS", tooltip="Trailing Offset %")
trail_stop_tick = trail_stop_pct * close/100
trail_offset_tick = trail_offset_pct * close/100

sl_pct = input.float(5, title="Stop Loss", group="SL and TP", inline="LSLTP")
// tp_pct = input.float(9, title="Take Profit", group="SL and TP", inline="LSLTP")

long_sl_price = strategy.position_avg_price * (1 - sl_pct/100)
// long_tp_price = strategy.position_avg_price * (1 + tp_pct/100)

strategy.exit('golden Exit', 'golden', stop = long_sl_price)
// trail_points = trail_stop_tick, trail_offset=trail_offset_tick
Detail
https://www.fmz.com/strategy/477597
Last Modified
2025-01-06 16:23:38