
20 KiB
Name
多层级动态趋势跟随系统-Multi-Level-Dynamic-Trend-Following-System
Author
ChaoZhang
Strategy Description
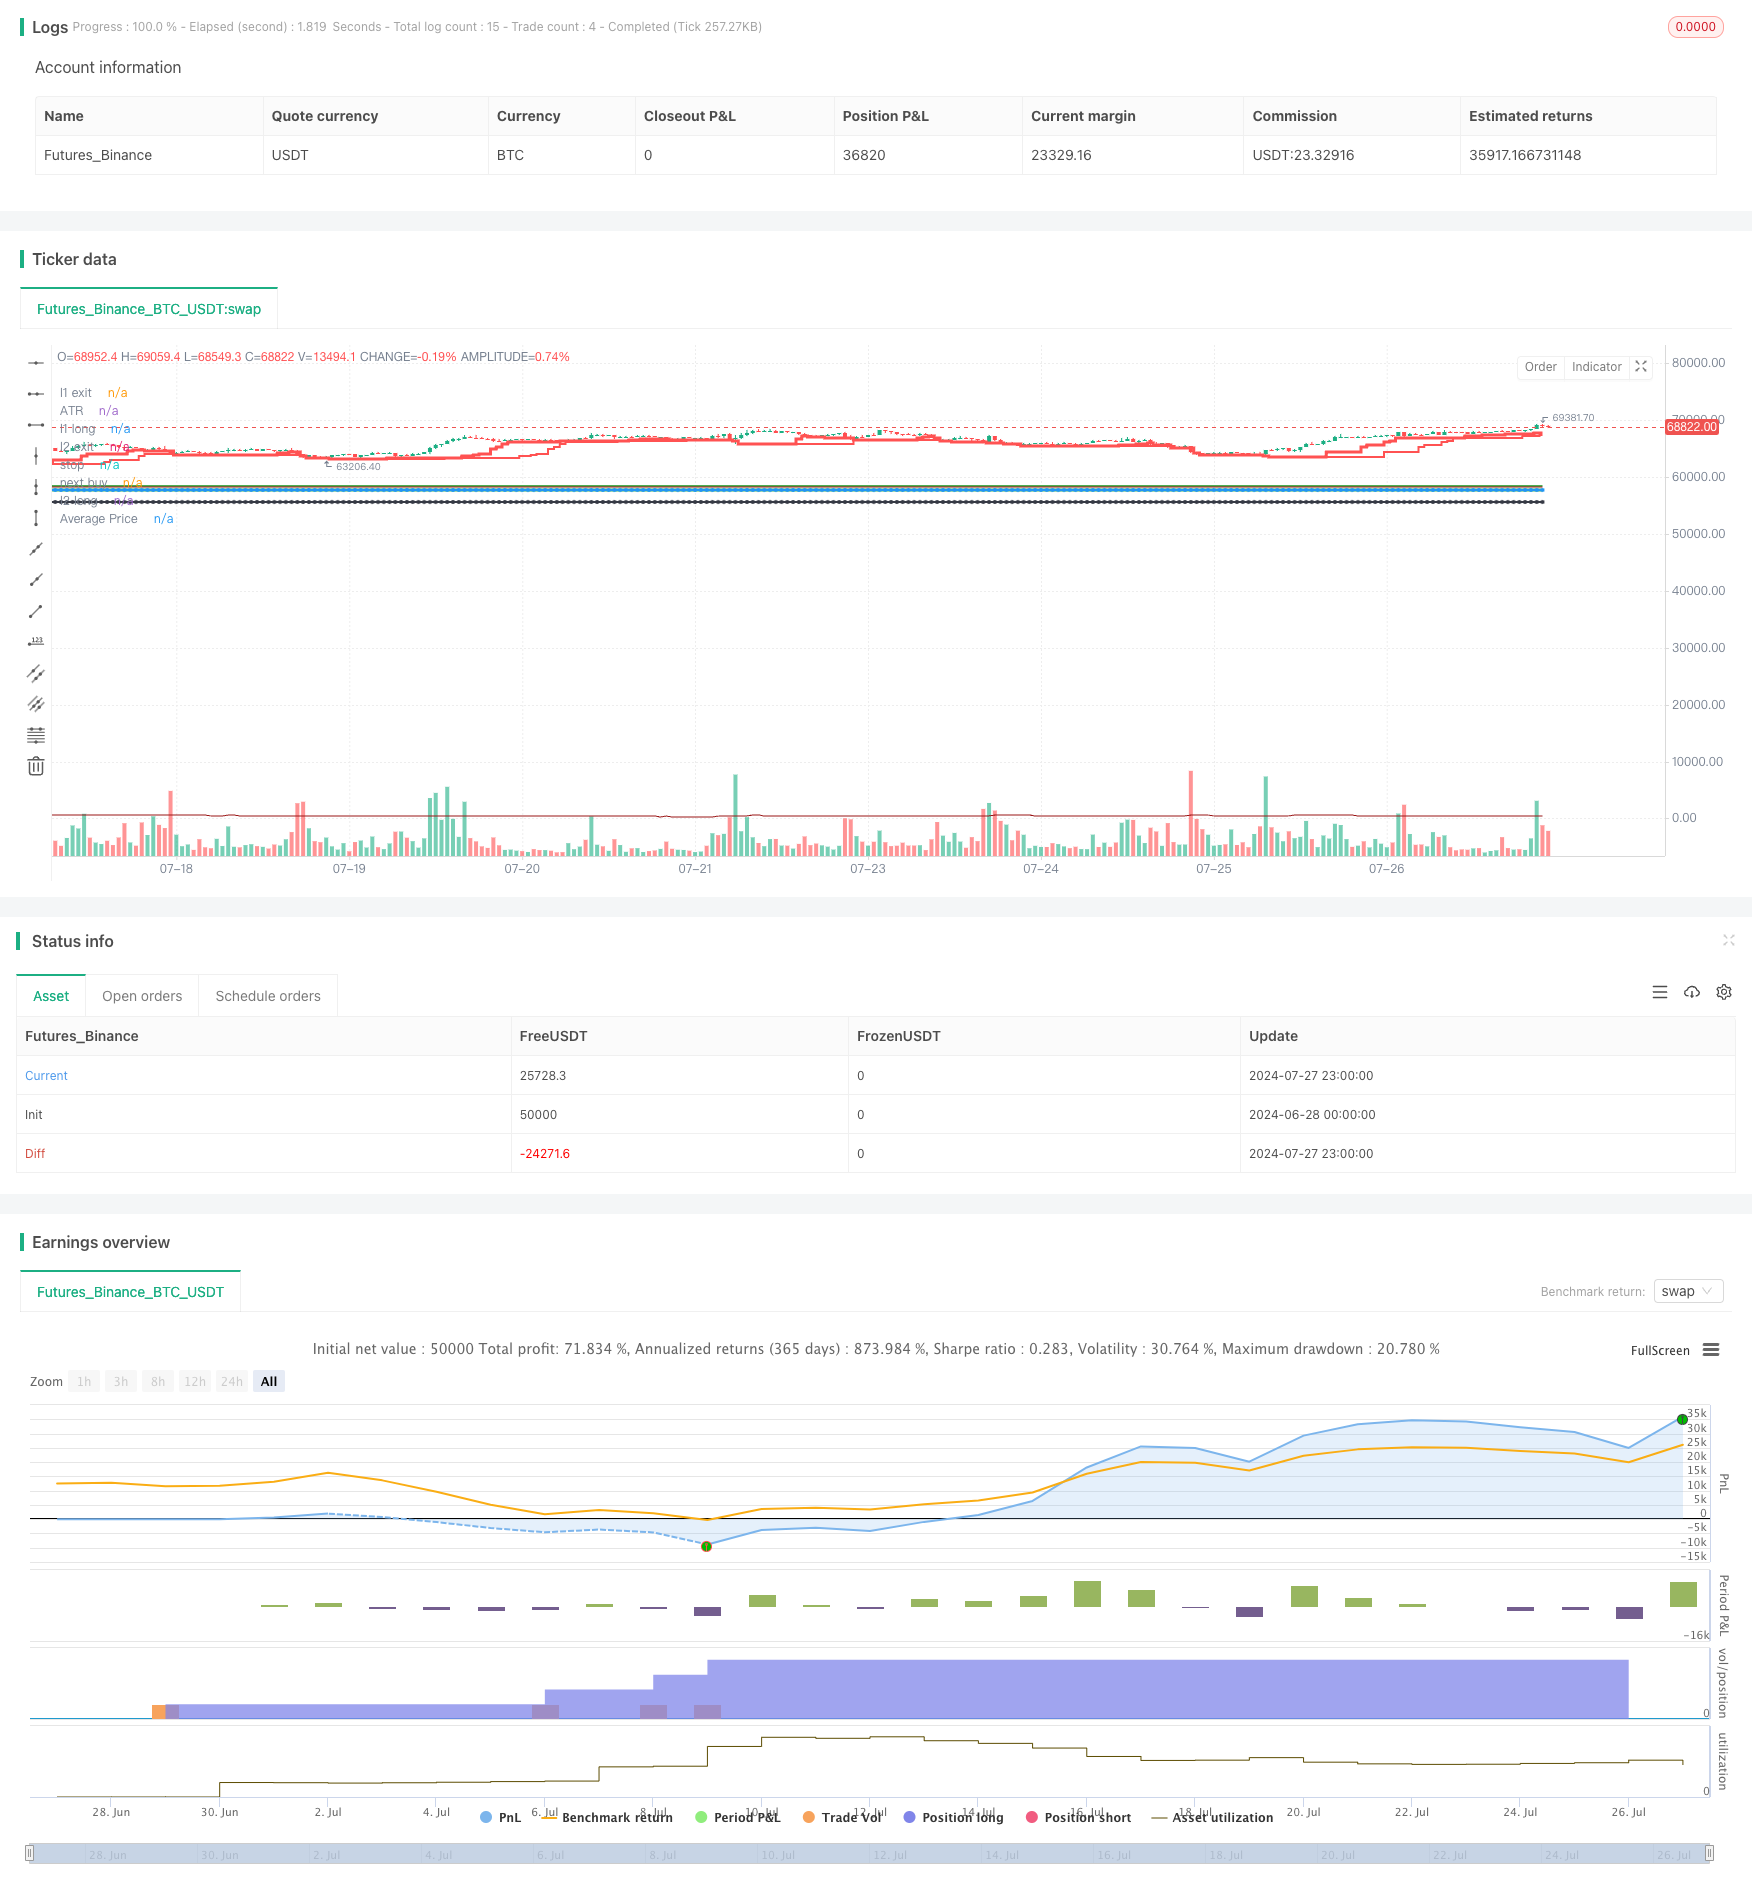
[trans]
概述
多层级动态趋势跟随系统是一种基于海龟交易法则的改进策略。该策略利用多个时间周期的趋势信号,结合动态止损和金字塔加仓,实现对中长期趋势的把握。系统通过设置两个趋势跟随周期(L1和L2)来捕捉不同速度的趋势,并使用自适应的ATR指标来动态调整入场、加仓和止损位置。这种多层级的设计使得策略能够在不同市场环境下保持稳定性,同时通过金字塔加仓来最大化盈利潜力。
策略原理
-
趋势识别:使用两个移动平均线周期(L1和L2)来识别不同速度的趋势。L1用于捕捉较快的趋势,L2用于捕捉较慢但更可靠的趋势。
-
入场信号:当价格突破L1或L2的高点时产生做多信号。如果上一次L1交易盈利,则跳过下一次L1信号,直到出现L2信号。
-
动态止损:使用ATR的倍数(默认3倍)作为初始止损距离,随着持仓时间的增加,止损位会逐渐上移。
-
金字塔加仓:在趋势延续过程中,每当价格上涨0.5个ATR时进行加仓,最多加仓5次。
-
风险控制:每笔交易的风险不超过账户净值的2%,通过动态计算持仓量来实现。
-
退出机制:当价格跌破10日低点(L1)或20日低点(L2)时平仓,或者触发移动止损线时平仓。
策略优势
-
多层级趋势捕捉:通过L1和L2两个周期,既能捕捉快速趋势,又能把握长期趋势,提高了策略的适应性和稳定性。
-
动态风险管理:使用ATR作为波动性指标,实现了入场、止损和加仓位置的动态调整,更好地适应市场变化。
-
金字塔加仓:在趋势延续时逐步加仓,既控制了风险,又最大化了盈利潜力。
-
灵活的参数设置:多个可调参数使策略能够适应不同的市场和交易风格。
-
自动化执行:策略可以完全自动化运行,减少人为干预和情绪影响。
策略风险
-
趋势反转风险:在强趋势市场表现优异,但在震荡市场可能频繁交易导致亏损。
-
滑点和交易成本:频繁的加仓和移动止损可能带来较高的交易成本。
-
过度优化风险:参数众多,容易造成过度拟合历史数据。
-
资金管理风险:如果初始资金较小,可能无法有效执行多次加仓。
-
市场流动性风险:在流动性较差的市场,可能难以按照理想价格执行交易。
策略优化方向
-
引入市场环境过滤:可以添加趋势强度指标(如ADX)来判断市场环境,在震荡市场减少交易频率。
-
优化加仓策略:可以考虑根据趋势强度动态调整加仓间隔和次数,而不是固定的0.5ATR和5次。
-
引入止盈机制:在长期趋势中,可以设置部分止盈以锁定利润,如在达到3倍ATR盈利时平掉一半仓位。
-
多品种相关性分析:在组合应用时,可以加入品种间相关性分析,以优化整体风险收益比。
-
加入波动率过滤:在极高波动率时期可以暂停交易或调整风险参数,以应对异常市场。
-
优化退出机制:可以考虑使用更灵活的退出指标,如parabolic SAR或Chandelier Exit。
总结
多层级动态趋势跟随系统是一种结合了经典海龟交易法则和现代量化技术的综合策略。通过多层级趋势识别、动态风险管理和金字塔加仓等方法,该策略在保持稳健性的同时,提高了对趋势的把握能力和盈利潜力。虽然在震荡市场面临挑战,但通过合理的参数优化和风险控制,该策略有望在不同市场环境下保持稳定表现。未来可以通过引入市场环境判断、优化加仓和退出机制等方向进行进一步改进,以提高策略的鲁棒性和盈利能力。
||
Overview
The Multi-Level Dynamic Trend Following System is an improved strategy based on the Turtle Trading Rules. This strategy utilizes trend signals from multiple time periods, combined with dynamic stop-loss and pyramid position building, to capture medium to long-term trends. The system sets up two trend-following periods (L1 and L2) to capture trends at different speeds and uses an adaptive ATR indicator to dynamically adjust entry, position building, and stop-loss points. This multi-level design allows the strategy to maintain stability in different market environments while maximizing profit potential through pyramid position building.
Strategy Principles
-
Trend Identification: Two moving average periods (L1 and L2) are used to identify trends at different speeds. L1 is used to capture faster trends, while L2 captures slower but more reliable trends.
-
Entry Signals: Long signals are generated when the price breaks above the L1 or L2 high. If the previous L1 trade was profitable, the next L1 signal is skipped until an L2 signal appears.
-
Dynamic Stop-Loss: A multiple of the ATR (default 3x) is used as the initial stop-loss distance, which gradually moves up as the position is held.
-
Pyramid Position Building: During trend continuation, additional positions are added every time the price rises by 0.5 ATR, up to a maximum of 5 times.
-
Risk Control: Each trade risks no more than 2% of the account equity, achieved through dynamic position sizing.
-
Exit Mechanism: Positions are closed when the price falls below the 10-day low (L1) or 20-day low (L2), or when the trailing stop-loss is triggered.
Strategy Advantages
-
Multi-Level Trend Capture: The L1 and L2 periods allow for capturing both rapid and long-term trends, improving the strategy's adaptability and stability.
-
Dynamic Risk Management: Using ATR as a volatility indicator enables dynamic adjustment of entry, stop-loss, and position building points, better adapting to market changes.
-
Pyramid Position Building: Gradually increasing positions during trend continuation both controls risk and maximizes profit potential.
-
Flexible Parameter Settings: Multiple adjustable parameters allow the strategy to adapt to different markets and trading styles.
-
Automated Execution: The strategy can run fully automated, reducing human intervention and emotional influence.
Strategy Risks
-
Trend Reversal Risk: Performs well in strong trend markets but may lead to frequent losses in range-bound markets.
-
Slippage and Transaction Costs: Frequent position building and moving stop-losses may result in high transaction costs.
-
Over-Optimization Risk: Numerous parameters may lead to overfitting historical data.
-
Capital Management Risk: Smaller initial capital may not effectively execute multiple position builds.
-
Market Liquidity Risk: In less liquid markets, it may be difficult to execute trades at ideal prices.
Strategy Optimization Directions
-
Incorporate Market Environment Filtering: Add trend strength indicators (e.g., ADX) to assess market conditions and reduce trading frequency in range-bound markets.
-
Optimize Position Building Strategy: Consider dynamically adjusting the interval and number of position builds based on trend strength, rather than fixed 0.5 ATR and 5 times.
-
Introduce Profit-Taking Mechanism: In long-term trends, set partial profit-taking to lock in gains, such as closing half the position when reaching 3x ATR profit.
-
Multi-Instrument Correlation Analysis: When applying to a portfolio, add inter-instrument correlation analysis to optimize overall risk-reward ratio.
-
Add Volatility Filtering: Pause trading or adjust risk parameters during periods of extreme volatility to handle abnormal market conditions.
-
Optimize Exit Mechanism: Consider using more flexible exit indicators such as Parabolic SAR or Chandelier Exit.
Summary
The Multi-Level Dynamic Trend Following System is a comprehensive strategy combining classic Turtle Trading Rules with modern quantitative techniques. Through multi-level trend identification, dynamic risk management, and pyramid position building, this strategy improves trend capture ability and profit potential while maintaining robustness. Although it faces challenges in range-bound markets, with proper parameter optimization and risk control, the strategy has the potential to maintain stable performance across different market environments. Future improvements can focus on introducing market environment assessment, optimizing position building and exit mechanisms to enhance the strategy's robustness and profitability.
[/trans]
Source (PineScript)
/*backtest
start: 2024-06-28 00:00:00
end: 2024-07-28 00:00:00
period: 1h
basePeriod: 15m
exchanges: [{"eid":"Futures_Binance","currency":"BTC_USDT"}]
*/

//@version=5
// This is a strategy based on the famous turtle system.
// https://www.tradingblox.com/originalturtles/originalturtlerules.htm
//
// In a nutshell, it a trend trading system where you are buying on strength, selling on weakness.
// positions should be entered when the price crosses over the 20-day high (L1 high) or 55-day high (L2 high).
// positions should be exited when the prices crosses below the 10-day low (L1 low) or 20-day low (L2 low)
// you can add positions at every unit (measured by multiple of n, where n=1 ATR)
// stops should be placed at 2*n below every position entered, when the stop is hit exit your entire position.
// positions should be entered everytime price crosses over L1 or L2, with one exception:
// if the last trade was an L1 trade and it was a winning trade, skip the next trade unless the price crosses
// over L2, if that is the case, you should take it.
// L1 and L2 levels are also configurable for high and lows.
// N multiple for stops and pyramid are also configurable

// To change this from a strategy to a study:
// 1) uncomment the next line and comment out the strategy line.
// 2) at the end of the file comment out the last 2 lines


// study(title="Turtle Study", overlay=true)
strategy(title='kTF-VNI', overlay=true, initial_capital=100000000, commission_type=strategy.commission.percent, commission_value=0.0, pyramiding=100, process_orders_on_close=true, calc_on_every_tick=true)

stopInput = input.float(3, 'Stop N', step=.05)
riskPercent = input.float(.01, 'Risk % of capital', step=.005)
pyramidInput = input.float(0.5, 'Pyramid N', step=.05)
maxUnits = input.int(5, 'Max Pyramid Units', step=1)
atrPeriod = input(20, 'ATR period')

l1LongInput = 10
l2LongInput = 20
l1LongExitInput = 20
l2LongExitInput = 40

l1LongInput := input.int(20, 'L1 Long', minval=2)
l2LongInput := input.int(60, 'L2 Long', minval=2)
l1LongExitInput := input.int(10, 'L1 Long Exit', minval=2)
l2LongExitInput := input.int(20, 'L2 Long Exit', minval=2)

FromYear = input.int(1970, 'From Year', minval=1900)
FromMonth = input.int(1, 'From Month', minval=1, maxval=12)
FromDay = input.int(1, 'From Day', minval=1, maxval=31)
ToYear = input.int(9999, 'To Year', minval=1900)
ToMonth = input.int(1, 'To Month', minval=1, maxval=12)
ToDay = input.int(1, 'To Day', minval=1, maxval=31)
FromDate = timestamp(FromYear, FromMonth, FromDay, 00, 00)
ToDate = timestamp(ToYear, ToMonth, ToDay, 23, 59)
TradeDateIsAllowed() =>
    time >= FromDate and time <= ToDate

l1Long = ta.highest(l1LongInput)
l1LongExit = ta.lowest(l1LongExitInput)
l2Long = ta.highest(l2LongInput)
l2LongExit = ta.lowest(l2LongExitInput)

bool win = false  // tracks if last trade was winning trade of losing trade.
float buyPrice = 0.0  // tracks the buy price of the last long position.
float nextBuyPrice = 0.0  // tracks the next buy price
float stopPrice = na  // tracks the stop price
int totalBuys = 0  // tracks the total # of pyramid buys
bool inBuy = false  // tracks if we are in a long position or not.
float l1LongPlot = ta.highest(l1LongInput)  // tracks the L1 price to display
float l2LongPlot = ta.highest(l2LongInput)  // tracks the L2 price to display
float n = ta.atr(atrPeriod)  // tracks the n used to calculate stops and pyramid buys
string mode = 'L1'  // tracks whether we are in a L1 position or L2 position.
bool fake = na  // tracks if this is a fake trade, see comments below.
string longLevel = na  // tracks where long positions, stops, pyramid buys occur.
float capitalLeft = strategy.initial_capital
var shares = 0
float fakeBuyPrice = 0.0

// by default use the last value from the previous bar.
buyPrice := buyPrice[1]
totalBuys := totalBuys[1]
nextBuyPrice := nextBuyPrice[1]
stopPrice := stopPrice[1]
win := win[1]
capitalLeft := capitalLeft[1]
inBuy := inBuy[1]
n := ta.atr(atrPeriod)
fakeBuyPrice := fakeBuyPrice[1]

// State to track if we are in a long positon or not.

if not inBuy[1] and (high > l1Long[1] or high > l2Long[1])
    inBuy := true
    inBuy
else
    inBuy := inBuy[1] and low < stopPrice[1] ? false : inBuy
    inBuy := inBuy[1] and mode[1] == 'L1' and low < l1LongExit[1] ? false : inBuy
    inBuy := inBuy[1] and mode[1] == 'L2' and low < l2LongExit[1] ? false : inBuy
    inBuy

// State to track if we are ia a fake trade.  If the last trade was a winning, we need to skip the next trade.
// We still track it though as a fake trade (not counted against us). as the outcome determines if we can
// can take the next trade.

if not inBuy[1] and high > l1Long[1] and win[1]
    fake := true
    fakeBuyPrice := close
    fakeBuyPrice
else
    fake := fake[1]
    fake

if fake[1] and inBuy[1] and not inBuy
    fake := false
    win := close >= fakeBuyPrice
    win

fake := high > l2Long[1] ? false : fake

// Series representing the l1 and l2 levels.   If we break out above the l1 or l2 level, we want the
// line to stay at the breakout level, not follow it up.
l1LongPlot := not inBuy[1] or inBuy[1] and mode == 'L1' and fake[1] ? l1Long[1] : l1LongPlot[1]
l2LongPlot := not inBuy[1] or inBuy[1] and mode == 'L1' and fake[1] ? l2Long[1] : l2LongPlot[1]

// Variable in the series is only set when it happens.   Possible values is L1, L2, SR
// (stopped out with a loss), SG (exited with a gain), and 'P' for pyramid buy.
longLevel := not inBuy[1] and high > l1Long[1] ? 'L1' : na
longLevel := (not inBuy[1] or inBuy[1] and fake[1]) and high > l2Long[1] ? 'L2' : longLevel

// Either 'L1' or 'L2' depending on what breakout level we are in.
mode := longLevel == na ? mode[1] : longLevel

// Variables to track calculating nextBuyPrice for pyramiding.
if longLevel == 'L1' or longLevel == 'L2'
    buyPrice := close
    totalBuys := 1
    stopPrice := close - stopInput * n
    nextBuyPrice := close + pyramidInput * n
    nextBuyPrice

// Marks if we hit our next buy price, if so mark it with a 'P'
longLevel := longLevel == na and inBuy[1] and high > nextBuyPrice and TradeDateIsAllowed() and totalBuys < maxUnits ? 'P' : longLevel

if longLevel == 'P'
    buyPrice := close
    totalBuys := totalBuys[1] + 1
    stopPrice := close - stopInput * n
    nextBuyPrice := close + pyramidInput * n
    nextBuyPrice

// Tracks stops and exits, marking them with SG or SR
longLevel := longLevel == na and inBuy[1] and low < stopPrice and close >= strategy.position_avg_price ? 'SG' : longLevel
longLevel := longLevel == na and inBuy[1] and low < stopPrice and close < strategy.position_avg_price ? 'SR' : longLevel
longLevel := longLevel == na and mode[1] == 'L1' and inBuy[1] and low < l1LongExit[1] and close >= strategy.position_avg_price ? 'SG' : longLevel
longLevel := longLevel == na and mode[1] == 'L2' and inBuy[1] and low < l2LongExit[1] and close >= strategy.position_avg_price ? 'SG' : longLevel
longLevel := longLevel == na and mode[1] == 'L1' and inBuy[1] and low < l1LongExit[1] and close < strategy.position_avg_price ? 'SR' : longLevel
longLevel := longLevel == na and mode[1] == 'L2' and inBuy[1] and low < l2LongExit[1] and close < strategy.position_avg_price ? 'SR' : longLevel

// Tracks if the trade was a win or loss.
win := longLevel == 'SG' ? true : win
win := longLevel == 'SR' ? false : win

// Variables used to tell strategy when to enter/exit trade.
//plotarrow(fake ? 1 : 0, colordown=color.red, colorup=color.purple, transp=40) // down arrow for winning trade
enterLong = (longLevel == 'L1' or longLevel == 'L2' or longLevel == 'P') and not fake and TradeDateIsAllowed()
exitLong = (longLevel == 'SG' or longLevel == 'SR') and not fake and TradeDateIsAllowed()

p1 = plot(l1LongPlot, title='l1 long', linewidth=3, style=plot.style_stepline, color=color.new(color.green, 0))
p2 = plot(l1LongExit[1], title='l1 exit', linewidth=3, style=plot.style_stepline, color=color.new(color.red, 0))
p3 = plot(l2LongPlot, title='l2 long', linewidth=2, style=plot.style_stepline, color=color.new(color.green, 0))
p4 = plot(l2LongExit[1], title='l2 exit', linewidth=2, style=plot.style_stepline, color=color.new(color.red, 0))
color1 = color.new(color.black, 0)
color2 = color.new(color.black, 100)
col = inBuy ? color1 : color2
p5 = plot(stopPrice, title='stop', linewidth=2, style=plot.style_circles, join=true, color=color.new(color.black, 0))
p6 = plot(nextBuyPrice, title='next buy', linewidth=2, style=plot.style_circles, join=true, color=color.new(color.blue, 0))

fill(p1, p3, color=color.new(color.green, 90))
fill(p2, p4, color=color.new(color.red, 90))

risk = (strategy.initial_capital + strategy.netprofit) * riskPercent
shares := math.floor(risk / (stopInput * n))
capitalLeft := strategy.initial_capital + strategy.netprofit - strategy.position_size * strategy.position_avg_price

if shares * close > capitalLeft
    shares := math.max(0, math.floor(capitalLeft / close))
    shares

shares := math.max(0, shares)

plotshape(longLevel == 'L1' and not fake and strategy.position_size == 0 ? true : false, color=color.new(color.green, 40), style=shape.triangleup, text='L1 ')  // up arrow for entering L1 trade
plotshape(not fake[1] and fake and longLevel == 'L1' and strategy.position_size == 0 ? true : false, color=color.new(color.gray, 40), style=shape.triangleup, text='L1')  // up arrow for entering L1 trade
plotshape(longLevel == 'L2' and strategy.position_size == 0 ? true : false, color=color.new(color.green, 40), style=shape.triangleup, text='L2')  // up arrow for entering L2 trade
plotshape((mode == 'L1' or mode == 'L2') and shares > 0 and enterLong and strategy.position_size > 0 ? true : false, color=color.new(color.green, 40), style=shape.triangleup, text='P')

plotarrow(strategy.position_size == 0 and longLevel == 'L1' and enterLong ? 1 : 0, colordown=color.new(color.black, 40), colorup=color.new(color.green, 40))  // up arrow for entering L1 trade
plotarrow(strategy.position_size == 0 and longLevel == 'L2' and enterLong ? 1 : 0, colordown=color.new(color.black, 40), colorup=color.new(color.green, 40))  // up arrow for entering L2 trade
plotarrow(strategy.position_size > 0 and longLevel == 'SR' and exitLong ? -1 : 0, colordown=color.new(color.red, 40), colorup=color.new(color.purple, 40))  // down arrow for losing trade
plotarrow(strategy.position_size > 0 and longLevel == 'SG' and exitLong ? -1 : 0, colordown=color.new(color.green, 40), colorup=color.new(color.purple, 40))  // down arrow for winning trade
plotshape(longLevel == na and inBuy[1] and not inBuy, color=color.new(color.gray, 40), style=shape.triangleup, text='Exit')  // up arrow for entering L1 trade

plot(ta.atr(atrPeriod), title='ATR', color=color.new(#991515, 0))
plot(strategy.position_avg_price, title='Average Price', color=color.new(#991515, 0))

alertcondition(low < stopPrice, title='crosses under stop price', message='price crossed under stop price')
alertcondition(high > l1Long, title='crosses over L1 price', message='price crossed over L1 price')
alertcondition(high > l2Long, title='crosses over L2 price', message='price crossed over L2 price')
alertcondition(low < l1LongExit, title='crosses under L1 exit price', message='price crossed under L1 exit price')
alertcondition(low < l2LongExit, title='crosses under L2 exit price', message='price crossed under L2 exit price')

strategy.entry('long', strategy.long, qty=shares, comment='long', when=enterLong)
strategy.close('long', when=exitLong)

// simulate_amount = 100000
// simulate_risk = simulate_amount*0.005
// simulate_shares = floor(simulate_risk/(n*stopInput))
// plot(simulate_shares, "Shares", color=#991515, transp=0)
// if (enterLong)
//     label.new(bar_index, high, text=tostring(simulate), style=label.style_none)
Detail
https://www.fmz.com/strategy/458080
Last Modified
2024-07-29 17:19:43